They are going to have to do some serious data tampering to finish off the year. My heart goes out to them.
10-Day Temperature Outlook for the Conterminous U.S.
They probably will….
Steve, I only had to look at Canada Alaska and Greenland to see as much of a warming anomaly as your 48 state map showing a cool forecast: http://wxmaps.org/pix/temp2.html and look at China: http://wxmaps.org/pix/temp5.html thanks for the links from: http://wxmaps.org/pix/clim.html
We can find warm anomalies too: http://wxmaps.org/pix/temp2.html and look at China: http://wxmaps.org/pix/temp5.html thanks for the links from: http://wxmaps.org/pix/clim.html
The headline with that image make for a good laugh….
Have you seen Borenstein’s article about the NOAA winter prediction for the US? Funny, no comments in there about the effects of Arctic ice extent.
Simply invert the color-scale and send to lamestream media. They won’t know the difference and will eat it up!
Just an anomaly caused by a lack of red crayons.
But Steven.. they have proven they are well and truly up to it, in the past
especially in the past.. 🙂
NY Times won’t publish unless they tamper. “All the news that’s fixed, we print”
Yes, but cold is totally consistent with a warming planet. And it is all due to our greedy way of life (not wanting to live in caves).
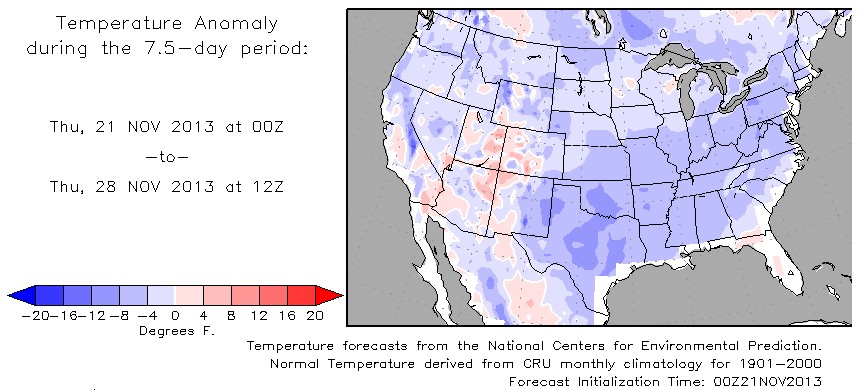
I’m confused, does the blue represent warm/cold and the red drought/flood? Or is it the other way around?
Although forecast temperatures for North and South America are far below normal, forecast temperatures are above normal to far above normal for Europe, Asia, the Middle East, Africa and Australia.
What does that have to do with NOAA tampering with US temperature data?
Fair enough. And the latest Conterminus US 7.5-day outlook, made today, is considerably colder.
Forecast by which model ? roflmao !
Believe that and I got a bridge to sell to you.
Your email address will not be published. Required fields are marked *
Comment *
Name *
Email *
Website
Save my name, email, and website in this browser for the next time I comment.


They probably will….
Steve, I only had to look at Canada Alaska and Greenland to see as much of a warming anomaly as your 48 state map showing a cool forecast:
http://wxmaps.org/pix/temp2.html
and look at China:
http://wxmaps.org/pix/temp5.html
thanks for the links from:
http://wxmaps.org/pix/clim.html
We can find warm anomalies too:
http://wxmaps.org/pix/temp2.html
and look at China:
http://wxmaps.org/pix/temp5.html
thanks for the links from:
http://wxmaps.org/pix/clim.html
The headline with that image make for a good laugh….
Have you seen Borenstein’s article about the NOAA winter prediction for the US? Funny, no comments in there about the effects of Arctic ice extent.
Simply invert the color-scale and send to lamestream media.
They won’t know the difference and will eat it up!
Just an anomaly caused by a lack of red crayons.
But Steven.. they have proven they are well and truly up to it, in the past
especially in the past.. 🙂
NY Times won’t publish unless they tamper. “All the news that’s fixed, we print”
Yes, but cold is totally consistent with a warming planet. And it is all due to our greedy way of life (not wanting to live in caves).
I’m confused, does the blue represent warm/cold and the red drought/flood? Or is it the other way around?
Although forecast temperatures for North and South America are far below normal, forecast temperatures are above normal to far above normal for Europe, Asia, the Middle East, Africa and Australia.
What does that have to do with NOAA tampering with US temperature data?
Fair enough. And the latest Conterminus US 7.5-day outlook, made today, is considerably colder.
Forecast by which model ? roflmao !
Believe that and I got a bridge to sell to you.