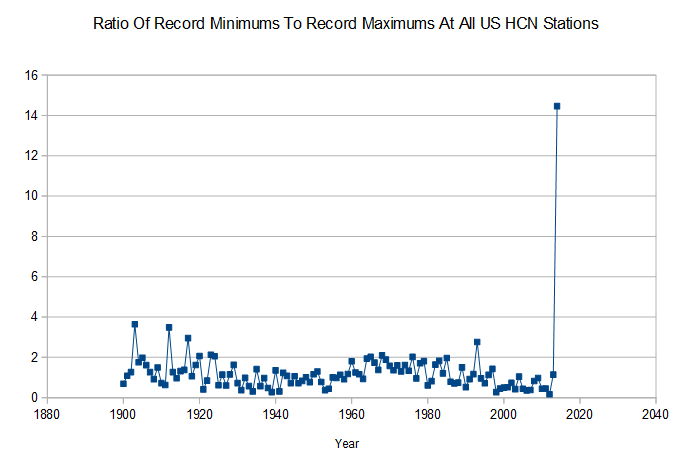
Looks like alarmists have a little bit of catching up to do. 188 record minimums and 13 record maximums so far in 2014.
Disrupting the Borg is expensive and time consuming!
Google Search
-
Recent Posts
- “Why Do You Resist?”
- Climate Attribution Model
- Fact Checking NASA
- Fact Checking Grok
- Fact Checking The New York Times
- New Visitech Features
- Ice-Free Arctic By 2014
- Debt-Free US Treasury Forecast
- Analyzing Big City Crime (Part 2)
- Analyzing Big City Crime
- UK Migration Caused By Global Warming
- Climate Attribution In Greece
- “Brown: ’50 days to save world'”
- The Catastrophic Influence of Bovine Methane Emissions on Extraterrestrial Climate Patterns
- Posting On X
- Seventeen Years Of Fun
- The Importance Of Good Tools
- Temperature Shifts At Blue Hill, MA
- CO2²
- Time Of Observation Bias
- Climate Scamming For Profit
- Climate Scamming For Profit
- Back To The Future
- “records going back to 1961”
- Analyzing Rainfall At Asheville
Recent Comments
- arn on Climate Attribution Model
- Bob G on Climate Attribution Model
- Bob G on Climate Attribution Model
- Bob G on Climate Attribution Model
- Bob G on Climate Attribution Model
- John Francis on Ice-Free Arctic By 2014
- Bob G on Climate Attribution Model
- Bob G on Climate Attribution Model
- Bob G on Climate Attribution Model
- Robertvd on “Why Do You Resist?”


Looks like a hockey stick to me….
Beat me to it. 😀
Whadda ya know, another hockey stick.
What was the ratio last year?
Last year was 1.15
First time since 1993.
2004 1997 1996
Looks like a sine wave. Colder in the 1900’s, warmer in the 30’s, cold through to the 70’s and warmer up to 2000. Likely to be cooler over next two to three decades, if we followed the wave, and don’t follow Warmist prophets of doom.
If you inverted the ratio how high would 2012 have been? Was it over 15:1?
Obviously needs adjusting.
If that data was in the BEST dataset it would be identified as a ‘breakpoint’ and thrown out due to ‘regional differences’.
2004 1997 1996
http://www.climatecentral.org/news/for-first-time-in-20-years-cold-records-may-beat-warm-in-u.s-16790
I guess it depends on what data set you’re looking at.
Climate Central uses a database heavily loaded with stations which were not in existence during the hot 1930’s and 1950’s. That allows them to slime their readers with misinformation.
Interesting how you can see the ~60 year cycle in Steve’s graph.