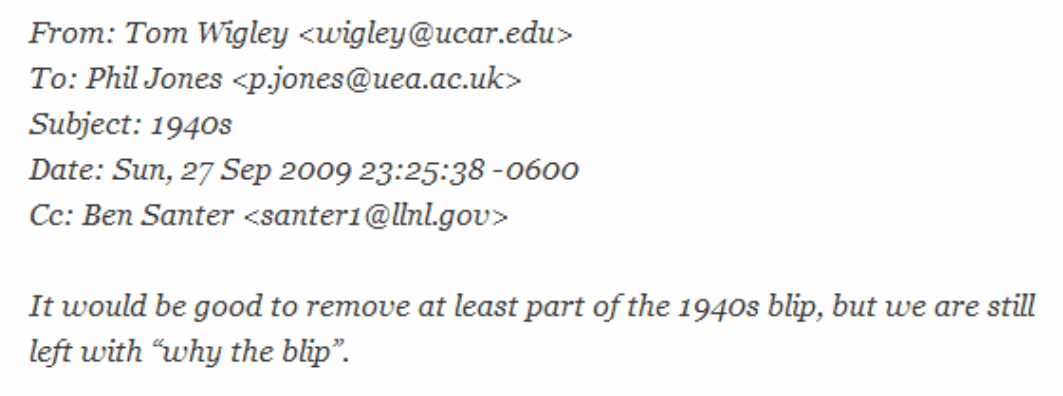
Our Climategate buddies told us that they wanted to get rid of the 1940’s temperature blip, without even knowing why it existed.
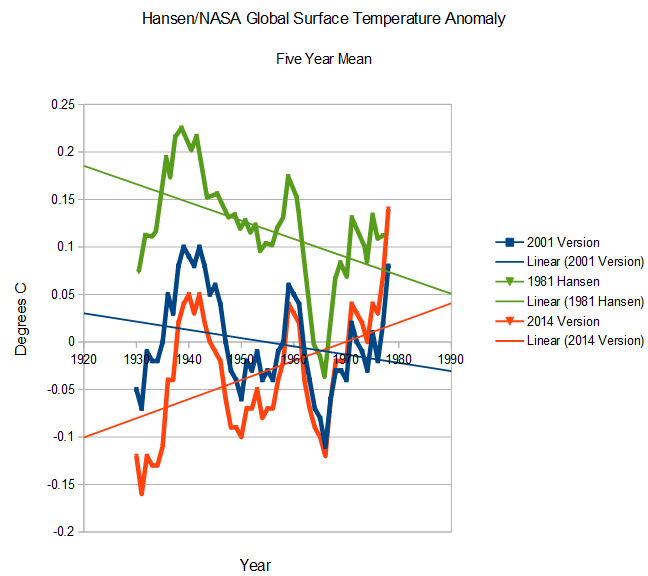
And that they did. The graph below shows the progression of data tampering since 1981 of the global surface (land only) temperature record. In 1981, Hansen showed strong global cooling from the 1930’s through the 1970’s. He got rid of most of that cooling by 2001, and now the same interval shows strong warming.
pubs.giss.nasa.gov/docs/1981/1981_Hansen_etal_1.pdf
The 2001 and 2014 data sets are located here:
2001 version : wayback.archive.org/……./FigA.txt
2014 version : data.giss.nasa.gov/gistemp/graphs_v3/Fig.A.txt
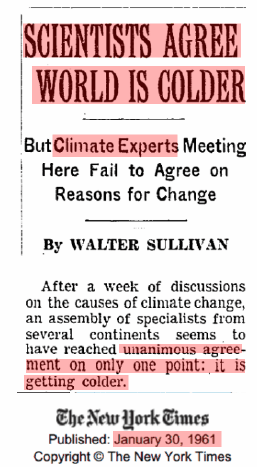
At the time, there was a unanimous consensus that the Earth was cooling, but James Hansen is just plain smarter than the NASA scientists in the 1960s – who were still able to put a man on the moon.


But Steve, every time they revise the data they improve it. You can’t just rely on thermometers, you have to use “science” 60 years later to tell us what those thermometers really meant.
I don’t think those 1940’s farmers knew how to use thermometers anyway. They probably didn’t know what time of day to remove them from the cow’s rectum.
Temperature inflation. A degree Celsius just isn’t worth as much as it used to be.
Thanks, Steven, for couageously using your talents to demonstrate the fraud disguised as consensus science.
I’d use this in a letter to the edtior of our local (Winston Salem NC) paper as proof of what the AGW crowd is doing, except they have adopted the policy of refusing to print letters (and news articles!) that dispute the “settled science” of global warming because “they will just confuse our readers”.
Richard – Please take a look at the following link, specifically Sept 8th – http://physics.unc.edu/seminars/colloquia/
The alarmists have already attempted to have Dr. Happer disinvited. Hope you can make it to the talk in support of Dr. Happer. Thanks!
This time I gott out of google and got the actual info.
Hope to see you there Gail.
Are you familiar with John Droz? If not, he has and continues to do some great work here in NC (particularly providing a big dissenting voice against the wind lobby). Here is a link to his newsletter – http://www.masterresource.org/2014/07/awed-newsletter-july-28-2014/
Let me know if you need his email address….
Thanks!
“they will just confuse our readers”
Makes one wonder what they might have done if they were publishing during the time of the discovery of heliocentricity, or even as recently as the confirmation of continental drift; live in their own little fantasy world?
In 2003 I found the Law Dome and Vostock Ice cores at the ORNL.gov. The Carbon dioxied and Proxy temperature data (hydrogen deuterium ratio data) were published together both in graphical and numerical form. The data were clear, when processed numerically, that increases carbon dioxide levels followed global warming and similarily carbon dioxide levels dropped following global cooling. The delay was 200 to 500 years.
The parallel and most recent carbon dioxide data were removed from the avaliable data ice core data around 2005.
Secondly the carbon dioxide proxy data are averages as the cells containing air in glacial ice do not seal for about 200 years in the Antarctic and Greenland environment. We do not have the instantaneous (annual) carbon dioxide levels in the ice cores; this implies we have neither the peak nor trough levels of carbon dioxide, but 200 years year running averages, with exchange between the air pocets in glacial ice.
The data have been moved to NOAA and less of the data are avaliable than were avalable in 2003.
Cause and effect of the carbon dioxide are not correct for the Carbon dioxide causing global warming. Rather global warming causes the rise in Carbon dioxide woluld be the correct time relationship. This would be consistent with CO2 solubilty in the oceans changing with ocean warming:the oceans area saturated Calcium carbonate calcium hydrogen carbonate, limestone,coral equillibrium system.
That statement is beyond gibberish. Are you trying to say something?
Basically what DK is saying is that atmospheric carbon dioxide levels rise following warming temps…not precedes rising temps as alarmists would have us believe. Please correct me if I am wrong DK…
Dakota kid,
You are correct.
CO2 follows temperature by ~500 to 800 years so the Gore Bull Warblests have the cause and effect backwards.
This is because CO2 is LESS soluble in cold water than in hot water. This means that as the oceans warm they out gas CO2.
As far as the accuracy of CO2 measurements, see the following references.
http://www.greenworldtrust.org.uk/Science/Scientific/CO2-ice-HS.htm
http://www.greenworldtrust.org.uk/Science/Scientific/CO2-flux.htm
http://www.warwickhughes.com/icecore/ (several pdfs including testimony before Congress)
http://www.rocketscientistsjournal.com/2006/10/co2_acquittal.html
http://www.rocketscientistsjournal.com/2007/06/on_why_co2_is_known_not_to_hav.html#more
Keep it up SG. We will be finding it harder and harder to get to the original files as they try to erase all memory of the past.This is hard definite proof and it must hurt them… but its going nowhere and that is the problem, getting it out there on mainstream media.
We live in a strange, strange world, with Putin exposing the flaws in our government?
http://beforeitsnews.com/9-11-and-ground-zero/2014/08/putin-threatens-to-bust-u-s-911-inside-job-conspiracy-with-facts-and-figures-2440862.html?utm_campaign=&utm_content=beforeit39snews-verticalresponse&utm_source=direct-b4in.info&utm_medium=verticalresponse&utm_term=http%3A%2F%2Fb4in.info%2FecbA
Dakota Kid = Kid explains a lot LOL
he may be a kid, however his science is decent.
Most powerful graph yet. Thanks, Steve.