
Climate experts tell us that Greenland is melting down and we are all going to drown in a great flood caused by our carbon sins and greed
National Geographic cites: “A recent study says we can expect the oceans to rise between 2.5 and 6.5 feet by 2100, enough to swamp many of the cities along the U.S. East Coast. More dire estimates, including a complete meltdown of the Greenland ice sheet, push sea level rise to 23 feet, enough to submerge London.”
Cole: Damaging effects of human-caused climate change already hurt sea life
Meanwhile scientists in Greenland have nearly disappeared under the 10,000 foot thick snow and ice, with temperatures 59 degrees below freezing.
Greenland’s surface has gained nearly 500 billion tons of ice over the past eight months
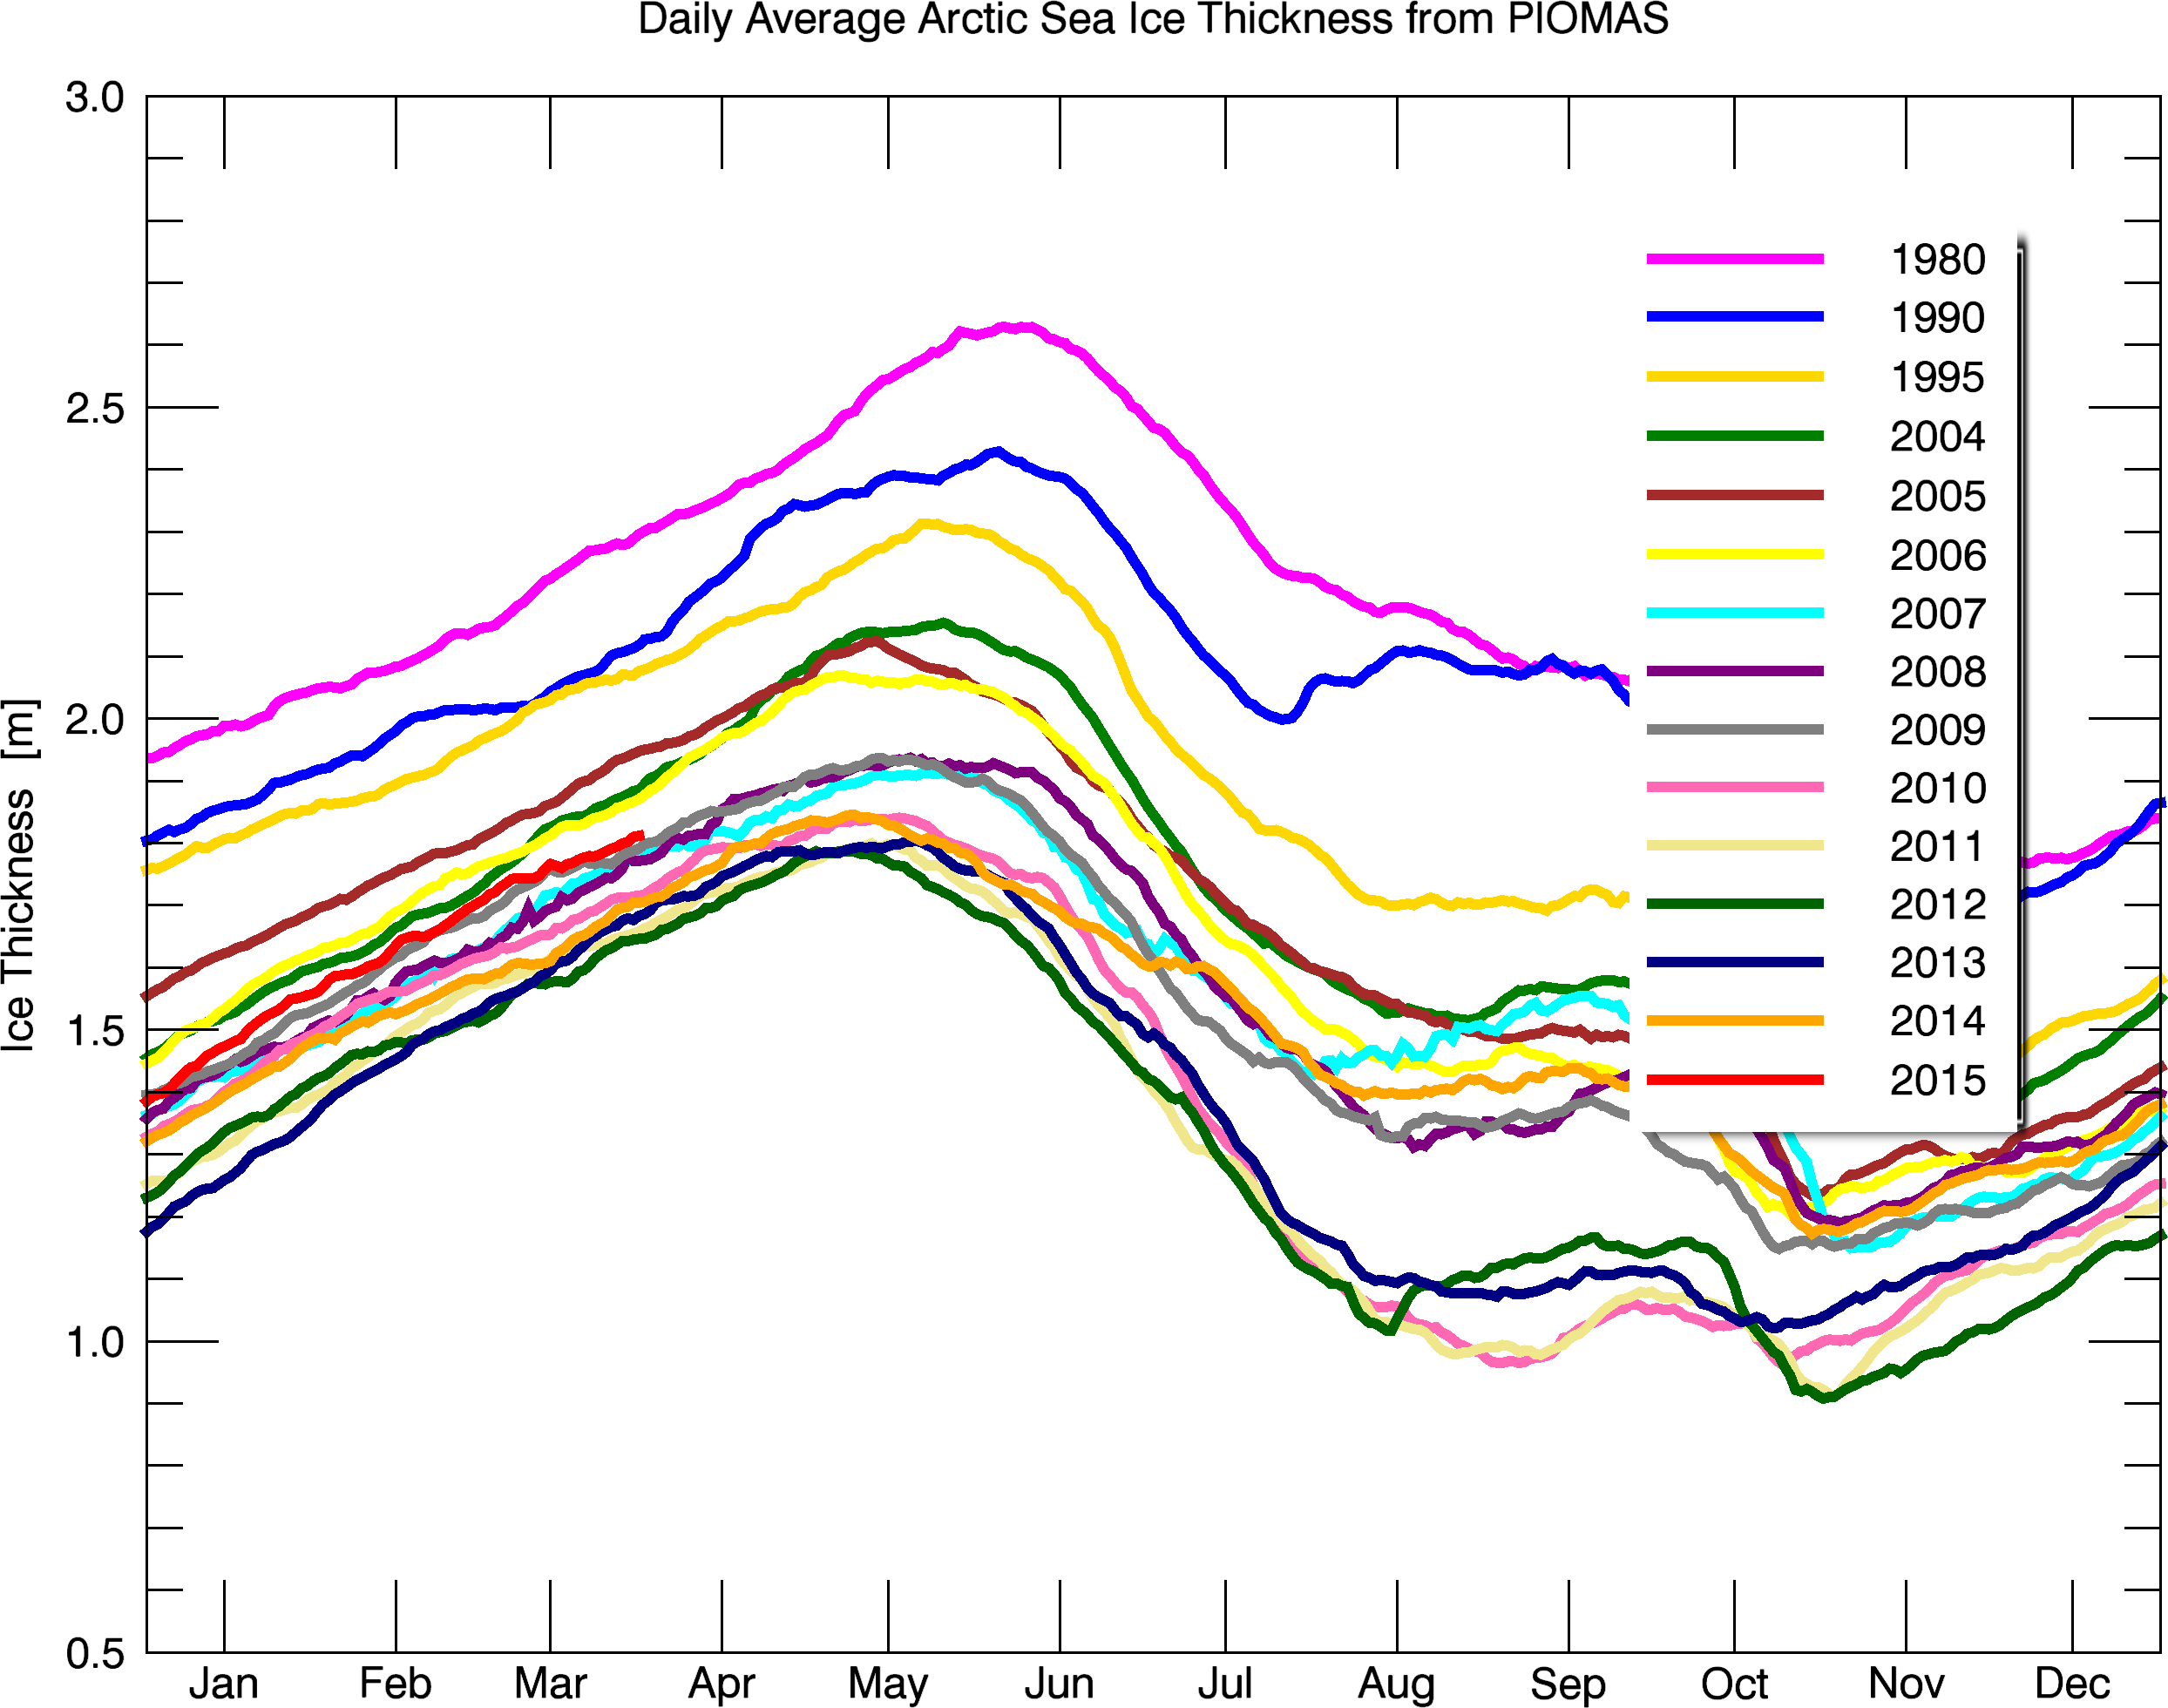
Arctic sea ice is the thickest it has been since 2006
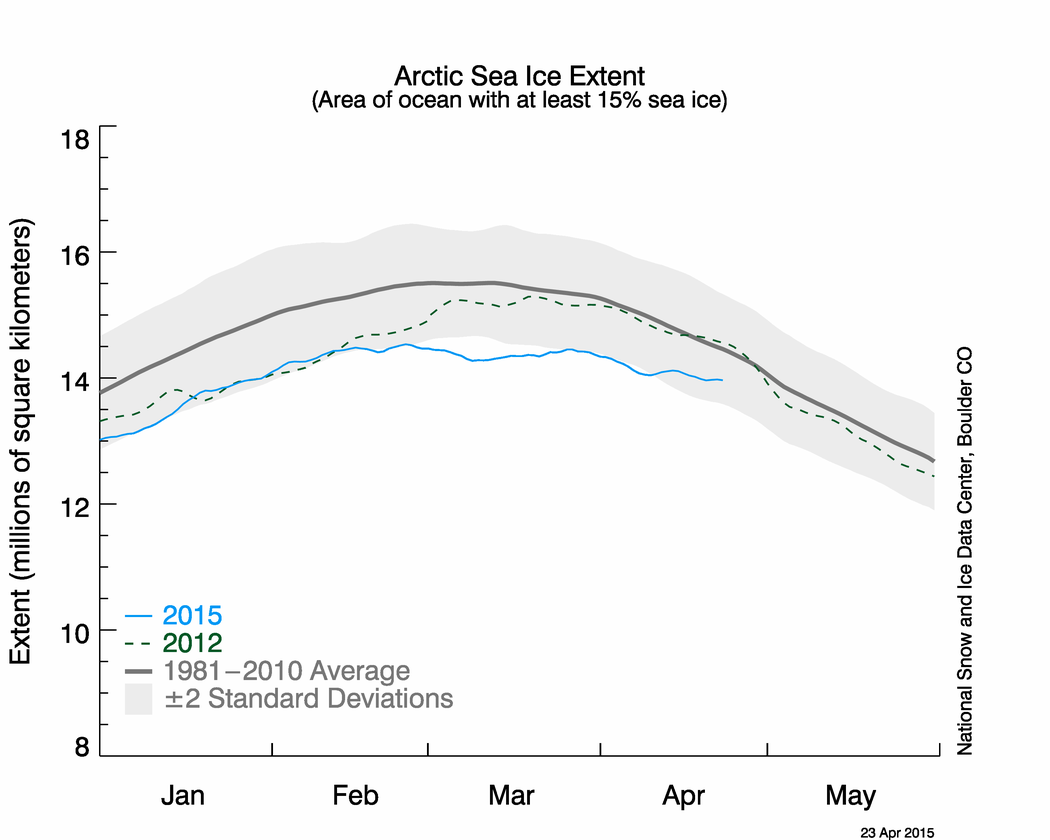
Arctic sea ice extent is normal. Just below the 1981-2010 mean.
Antarctic sea ice extent is at a record high

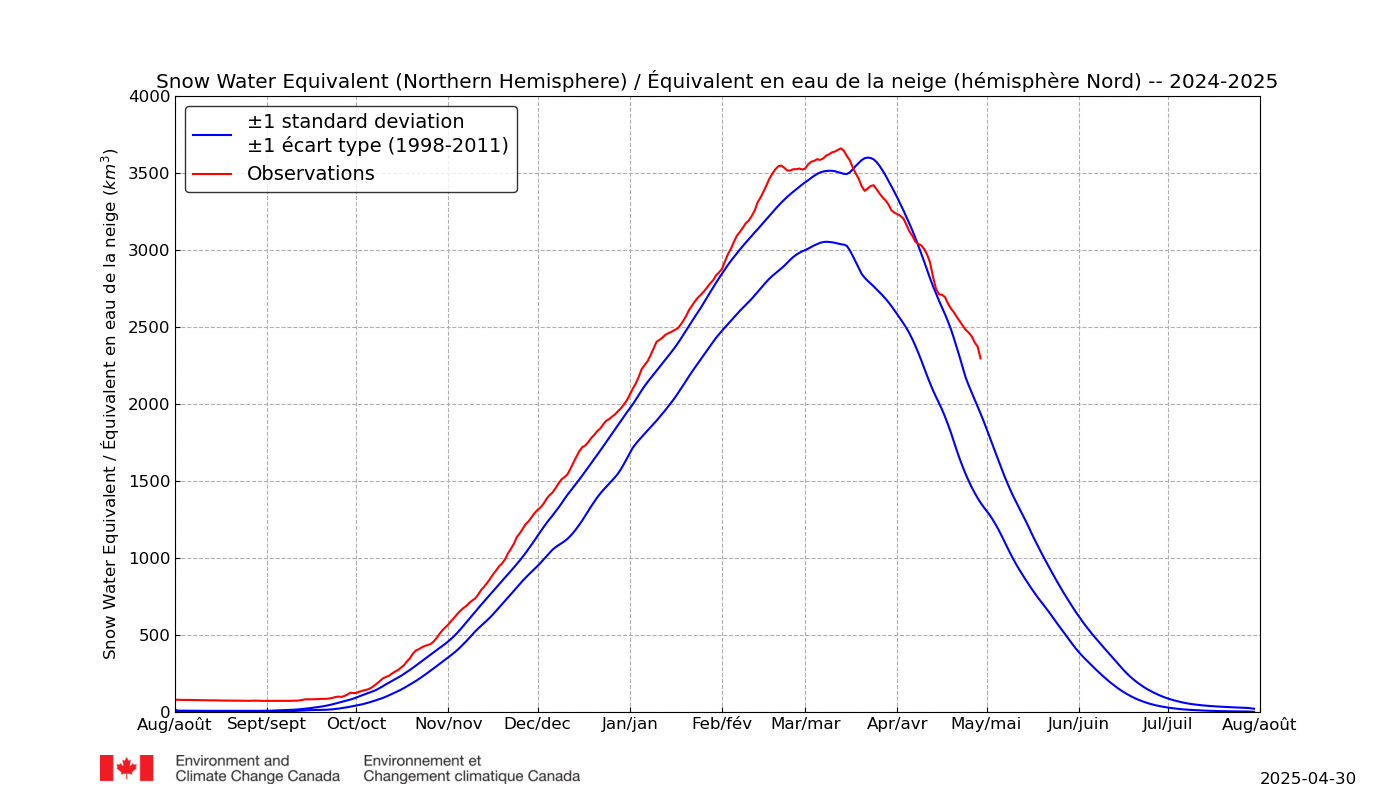
Northern Hemisphere snow water content is well above normal.

The good news is that John Kerry has already stopped bad weather and sea level rise.
Secretary of State John F. Kerry took the helm of the Arctic Council on Friday on behalf of the United States
Kerry promised to make the battle against climate change the first priority of the two-year U.S. stewardship of the council
Preventing catastrophic weather events and rising sea levels “is not a future challenge; this is happening right now,” Kerry told the gathering at Iqaluit on Canada’s Baffin Island.
U.S. takes helm of Arctic Council, aims to focus on climate change – LA Times
Kerry and Obama ended the bad weather, by having exactly zero impact on global CO2 emissions over the past six years.

Dam! This is awful news!
I thought I was going to buy Oceanfront property in Greenland soon.
Maybe better luck in Cuba…………….
I could’a had a birdie, but the greens just don’t run, and the fairways plug.
Since the mainstream media refuses to show pictures of Greenland today buried under ice and snow, few people know about this.
It is bitter cold here…and nearly May in New York and I imagine it is extremely cold in Greenland right now since the same cold blowing here is blowing there.
EMS, it is 10:30 in mid NC, partly cloudy and 53 °F. The norm is 75 °F with a max of 93 °F for this date. The weather this month has been all over the place.
I’m about 800-900 miles away, and it has been running well below average since January, usually by about 10-15 degrees.
We had snow accumulations twice this week in upstate NY
Sorry guys. Hot and toasty here in F L A.
Right now I got my rooftop passive solar pool heater warming up the spa to a sizzlin’ 108 or so. Pool got so hot I had to run the pump through the rooftop dealio at night to cool it off some…90 is not very refreshing for a pool on a hot day…but it does feel very nice for a bedtime swim at night.
Rainy season seemed to be getting an early start, but it may have been a false alarm, just some frontal boundaries washing out and lingering maybe.
Too hot in the hot tub…OOOOW…. GOOD GOD!
http://www.nbc.com/saturday-night-live/video/james-brown-celebrity-hot-tub-party/n9133
“Rainy season”
Don’t mention rain , please..
After the dramas, flooding and near cyclonic winds, of the last few days, …
this is what we have ahead of us… YUCK !
http://www.weatherzone.com.au/nsw/hunter/newcastle
Hmm. Temperature in Celsius I can handle, unlike most Americans.
But wind speed in kph?
That’s gonna take some getting used too!
Just divide by 1.6.. to get to mph… close enough. 🙂
Let’s face it. Until we live in small ferel groups of non pooping, non cooking, non killing humans, we will never be truly content.
A March 26 article in the journal Science detailed how arctic sea ice is melting 70 percent faster in some places than it was just one decade ago.
“Goofy claims require goofy evidence.”
-Gator
GATOR. Please do me a favor, it you see this, just indicate that you do see it.
I am getting awaiting moderation permanently on everything I post
Thanks!
You’re visible.
http://fc01.deviantart.net/fs50/i/2009/308/1/e/Snow_Cherries_Two_by_Spiesty.jpg
OT but when you think of it there can be no change in 100% matter (=1) on earth due to gravity including C02. Energy (heat) is the only thing that can be lost through space (I doubt the electrons could defy gravity though, so they also are retained). Therefore although atmospheric C02 appears to be rising, the equation will always be 1=1. This includes all the extra humans by the way (ie matter, so NOT extra) The only addition to Earth matter is through meteorites ect. My ramblings LOL
ERRRRRrrrr
Be careful with that one.
The earth is constantly losing atmosphere (especially at the polls IIRC.)
I wonder if anyone really knows the net atmosphere gain/loss balance.
I’ve been told it goes negative with low solar activity. But there are also those pesky mini-comet “snowballs” that no one seems mention or keep track of these days:
http://smallcomets.physics.uiowa.edu/lecture/
Also no idea on who is correct about how frequent they are. But in my skywatching days I personally have seen two of these go poof in the upper atmosphere.
I think we can all agree that CAGW is a myth and Obama and Kerry are both idiots. If not for the problem of stupidity and greenie fervor amongst the progressives, this would be a consensus view.
It’s not just stupidity and fervor. There is also the 5-6 billion available yearly for studies that support the meme, as well as megabucks donated to green groups by elite controlled foundations based on each group’s climate change focus.
http://age-of-treason.com/wp-content/uploads/2009/11/michelle_obama_ape_impression.jpg
Speaking of ugly, I was just explaining to someone what a hypocrite Skeeter is. His wife screeches about food deserts here in the US that look like this…
http://clatl.com/binary/85b9/1331652189-atlanta-food-deserts.jpg
… while 21,000 people per day actually die from starvation around the world. And yet what does Skeeter spend his time promoting? Spending trillions on Global Climate Warming Ruination.
I don’t know that I really believe in Hell, but I am hoping.
As an Agnostic I am certainly hoping that Dante’s Ninth Circle for traitors exists. There are a whole pile of US and world politicians that belong in Dante’s Ninth Circle. Dante’s Ninth Circle of Hell is reserved for the most evil of all sinners —Traitors.
This is the beginning of the major backdown from AGW from the climate science establishment http://www.natureworldnews.com/articles/14243/20150422/global-warming-progressing-slower-than-we-thought.htm
expect to see this for years to come from “Nature” until its “disappeared”
Of course it will not be admitted ever.
I doubt that is the beginning of the end. It’s more probably the end of the beginning. The Titanic that is the government-institutional head of the monster will take a quite some time to turn.
If that particular Titanic does hit an iceberg, expect that they have a replacement ready to go before it sinks under the waves.
I deplore scientific doublespeak…
The new findings, based on 1,000 years of temperature records, shows that natural variability in surface temperatures – caused by interactions between the ocean and atmosphere, and other natural factors – can account for observed changes in the recent rates of warming from decade to decade.
Scientists refer to this natural variability as “climate wiggles,” which can slow down or speed up the rate of global warming as time passes. They can even accentuate or offset the effects of increases in greenhouse gas concentrations – which saw a record high in 2013.
If natural variability can account for “decade to decade” changes, it can account for all changes. The second paragraph sounds like it was written by an excuse making toddler caught with his hand in the cookie jar.
Gail Gravity at Poles same as Equator. Its the same everywhere LOL
But the Ozone isn’t.
Gravity is NOT uniform at all.
Gravity is not evenly distributed on the Earth, and changes over time.
https://www.youtube.com/watch?v=APZN3HiUNq0
ACK!!! CALIFORNICATE is a gigantic pimple on the face of the earth!
(I can see whole vid)
Well, how would you like to live on America’s wang!
Having seen that video, I’m now even more sceptical that GRACE produces any remotely useful data.
They pretend that they can see changes in ice thickness at the poles with GRACE. Phoooey!
Agreed. Who knows what they are detecting aside from ice gain or loss. There are always uncertainties.
GRACE has had several papers noting reductions in their estimates of ice loss. At one point, a paper noted a 63% overestimate of Antarctic ice loss — which was reported with alarm in green news, and the paper disappeared.
The Greenland ice loss intrigues me, as their data show that this ice loss extends out to see to the southeast, where Greenland doesn’t actually have ice at all. With no ice, how can it have an accelerated rate of loss?
But the signal they seek is buried in massive amounts of noise. The accuracy of the readings is so bad that the differences from one pass to the next the same day are quite startling. They average it out over time, but have to use models to guess at the distinction between Earth mantle changes and the much smaller ice changes.
I do not have confidence in GRACE results. Those models are part of the same climate model panoply that have fallen so far short of observations.
And before the fall from GRACE: Radar altimeter ice measurements of Greenland from 1992-2003 (when GRACE replaced ERS-1 and -2) showed increasing ice sheets there, as well as Greenland’s isostatic rise out of the ocean at about a centimeter per year.
===|==============/ Keith DeHavelle
It is not gravity it is the Magnetic field.
I will see if I can dig out the paper.
The Earth’s crust is not uniform, and there are very small changes in gravity due to this, and ice gain and loss, etc..
The video illustrates both gravity and magnetic anomalies.
Correct.
The MOON also has differing gravity pools, too. Depending on where asteroids hit, for example, and ancient volcanic events.
Yes even sea level rises next to the masses of land.
https://www.youtube.com/watch?v=q65O3qA0-n4
Found it:
Is that Greenland outpost still inhabited? Looks like it has been abandoned to snow and ice
I commented on that Daily Orange article:
Sen. Cruz was correct. Moreover, the thermometer-based datasets have shown no temperature trend since 1998.
If you don’t believe me, please consult the WGI part of IPCC’s AR5 report, issued in 2013, which says the following: “Regardless, all global combined LSAT and SST data sets exhibit a statistically non-significant warming trend over 1998–2012 (0.042°C ± 0.093°C per decade (HadCRUT4); 0.037°C ± 0.085°C per decade (NCDC MLOST); 0.069°C ± 0.082°C per decade (GISS)).” Saying “statistically non-significant” trend is a coy way of saying “zero” trend.
http://ipcc.wikia.com/wiki/152.4.3_Global_Combined_Land_and_Sea_Surface_Temperature
They are going to have to move the club house again.
Yes. and that ticks me off. I will lose my good parking spot AGAIN. Sheeesh! ;^D
To Hawaii.
Gitmo.
Reblogged this on pappasven and commented:
If nature is handling things in a normal way WHY WORRY?
And Hayhoe is doing her part to convince everyone. She’s on an evangelical mission to spread the “gospel” to the disbelievers.
http://news.nationalpost.com/news/a-believer-among-the-skeptics-a-canadians-crusade-to-convert-christians-to-climate-change-belief#__federated=1
Hayhoe, 43, grew up in Toronto. Her father is an evangelical pastor, missionary and science teacher, as is her mother. She studied science at the University of Toronto.
That explains everything! It always puzzled me how a Texas evangelical could be such a fool for CAGW. But a dope raised by Canadian school teachers, who moved to Texas, would think that her world is getting hotter 😆
Just to be clear, Hayhoe doesn’t speak for all Torontonians/Canadians.
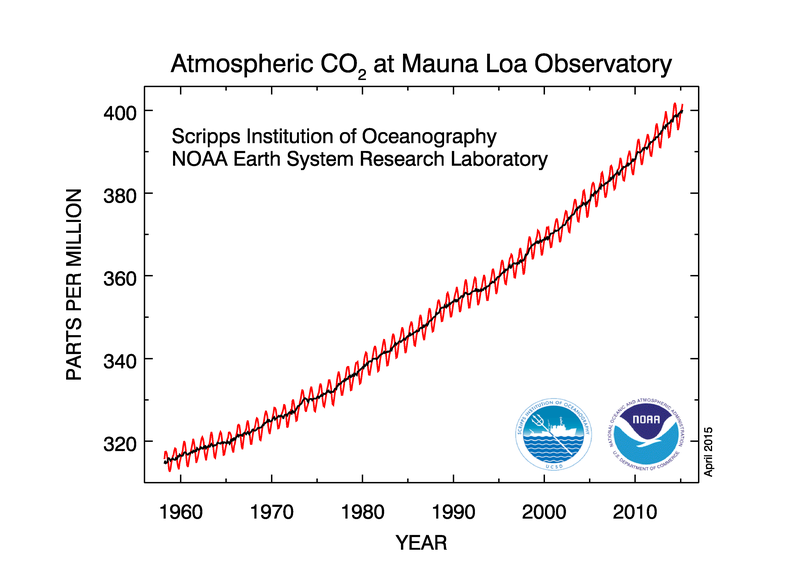
It’s probably been discussed to death already but….doesn’t this graph resemble what you might expect if after every seasonal growth period there is more CO2 generated by die back rotting down ?
The explanation for the seasonal oscillation is that the drop occurs from spring to autumn when growth of plants consumes CO2, but then die back after growth of fallen foliage releases CO2 again. Any imbalance in either of those systam could easily create a trend such as the one we see.
https://stevengoddard.files.wordpress.com/2015/04/co2_data_mlo2.png?w=505&h=369
Of course the southern hemisphere growth periods are out of synch but as the SH is mostly water that effect might be negligible when all is said and done.
It’s a chicken and egg situation I know…but can we have more CO2 released during dieback this year than last year ? If the trees grow a little bit every year then of course there will be more dieback to rot away.
97-98 was an El nino year and the CO2 level jumped up….it would be easy to assume the warmer ocean released extra CO2 but it absorbed it back when temps returned to normal, but still there is something else causing the rise…..did the warmer conditions result in either extra plany growth (likely) and more favourable conditions for better rotting ?
There’s just something about this seasonal variation that makes me wonder if it isn’t the biosphere just going about it’s business…..left to it’s own devices the biosphere tends towards growth…..we all know what happens if you don’t do any gardening for 2 years….here, we get trees sprouting up all over the place if you don’t pull them out as first year seedlings when they appear….at he end of each year they dump more leaf litter on the ground than the previous year….if they are a net contributor to CO2 levels then there’s the culprit, and it’s all normal
My problem with “seasonal growth” is with my lawn this time of year. Have to mow every 4-5 days or it will get out of hand. Mowed yesterday. I usually can just leave the clipping down but this time and had to use the lawn sweeper on a portion to pick up some of them because they were just too heavy despite the fact I had mowed just a week before. The clippings were dumped next to my neighbors garden where they will be spread between the rows to help retain moisture.
Been to windy and rainy to spray for weeds.
As for the trees? Had them trimmed and one taken out just a couple years ago so their good to go for another five years or so.
THE ACQUITTAL OF CARBON DIOXIDE
by Jeffrey A. Glassman, PhD
If you want to see our Beloved Gavin Schmidt of NOAA get his rear handed to him, Dr Jeffrey A. Glassman does a fine job.
GAVIN SCHMIDT’S RESPONSE TO THE ACQUITTAL OF CO2 SHOULD SOUND THE DEATH KNELL FOR AGW by Jeffrey A. Glassman, PhD
Dr Glassman’s third essay:
Perhaps a tangent, but it occurs to me that maybe it is not just a coincidence that “World CO2” just happens to be measured on an active volcano located on an island in the warmer part of the ocean
It is not at all a coincidence. Especially when they take the raw reading and ‘curve fit’ then toss the outliers. Then the rest of the world CO2 measurements are ‘fitted’ to the Mauna Loa data. (It is called calibrated to the Mauna Loa data)
Lots of duscussion on that topic over at WUWT a few years ago with F. Englebeen doing his best to protect the reputation of the Mauna Loa data.
You noticed that too?
http://www.warwickhughes.com/icecore/call2.jpg
Gator, I and Richard Courtney (A UK socialist) and a few others spent years on WUWT trying to counter Englebeen’s CO2 propaganda.
The whole edifice is constructed on NOTHING BUT LIES!
Just a sample:
http://www.igsoc.org/journal/21/85/igs_journal_vol21_issue085_pg291-300.pdf
CO2 in Natural Ice
Stauffer, B | Berner, W
Symposium on the Physics and Chemistry of Ice; Proceedings of the Third International Symposium, Cambridge (England) September 12-16, 1977. Journal of Glaciology, Vol. 21, No. 85, p 291-300, 1978. 3 fig, 5 tab, 18 ref.
Natural ice contains approximately 100 ppm (by weight) of enclosed air. This air is mainly located in bubbles. Carbon dioxide is an exception. The fraction of CO2 present in bubbles was estimated to be only about 20%. The remaining part is dissolved in the ice. Measurements of the CO2 content of ice samples from temperate and cold glacier ice as well as of freshly fallen snow and of a laboratory-grown single crystal were presented. It is probable that a local equilibrium is reached between the CO2 dissolved in the ice and the CO2 of the surroundings and of the air bubbles. The CO2 content of ancient air is directly preserved neither in the total CO2 concentration nor in the CO2 concentration in the bubbles. Possibly the CO2 content of ancient air may at least be estimated if the solubility and the diffusion constant of CO2 in ice are known as a function of temperature. (See also W79-09342) (Humphreys-ISWS)
……
Statement of Prof. Zbigniew Jaworowski
Chairman, Scientific Council of Central Laboratory for Radiological Protection
Warsaw, Poland
Figures 1A and 1B
The data from shallow ice cores, such as those from Siple, Antarctica[5, 6], are widely used as a proof of man-made increase of CO2 content in the global atmosphere, notably by IPCC[7]. These data show a clear inverse correlation between the decreasing CO2 concentrations, and the load-pressure increasing with depth (Figure 1 A). The problem with Siple data (and with other shallow cores) is that the CO2 concentration found in pre-industrial ice from a depth of 68 meters (i.e. above the depth of clathrate formation) was “too high”. This ice was deposited in 1890 AD, and the CO2 concentration was 328 ppmv, not about 290 ppmv, as needed by man-made warming hypothesis. The CO2 atmospheric concentration of about 328 ppmv was measured at Mauna Loa, Hawaii as later as in 1973[8], i.e. 83 years after the ice was deposited at Siple.
http://www.goldenageproject.org.uk/downloads/scientific_paper_on_global_warming.pdf
Trust me, one of the first things I did was bone up on ice core samples, knowing full well that ice is fluid. Glaciers are what started my fascination with geology. Ice “traps” CO2 about as well as CO2 “traps” heat.
The cherry picking and outright lies of alarmists never ends.
As a chemist the ‘ice traping CO2 in bubbles’ made me laugh. Think how flat a plastic bottle of soda tastes if you leave it in the pantry for a year by mistake. Anyone who has had courses on analytical chemistry is made aware molecules will migrate into the glass and contaminate the results.
Englebeen says he is a Chem Engineer so his refusal to accept reasoned arguments loudly shouts PAID TROLL!!!
Dr Glassman does a good tap dance all over Englebeen BTW.
I bring up Englebeen because he is one of the trolls on WUWT who shepards thought in the Politically Correct direction. He is in charge of CO2, Dr. L. S is in charge of no change in the sun, Zeke and the Mosh pup guard the temperature record and for a while R.Gates guarded the Arctic ice data. (I outed him with some quotes of nasty comments he made on Alarmist websites and he dissapeared after that.)
I still get a laugh out of the “Star Tech” girl…
http://blog.idnes.cz/blog/7317/144075/clanok_foto_980.jpg
http://motls.blogspot.com/2010/06/judithgate-ipcc-relied-on-one-solar.html
It ‘s pretty obvious which party has the sheep vote, again…
http://content.gallup.com/origin/gallupinc/GallupSpaces/Production/Cms/POLL/kap0ji_-iewk2lbcfrbe5w.png
Hottest year ever! 😆
Brain dead Huff ‘n Puff readers vs individuals with inquiring minds. No wonder the Progs hate the repugs and esp the Tea Party.
This is OT but no one has brought up that earth quake in Nepal. Actually, as is normal, it was just the strongest of a swarm. But check out how unusually large and powerful the swarm was. Enough to make one wonder if that 7.8 is really going to be the big one.
4.9 23km NNE of Nagarkot, Nepal 2015-04-25 12:27:21 UTC-04:00 10.0 km
4.6 14km E of Panaoti, Nepal 2015-04-25 10:10:02 UTC-04:00 10.0 km
4.6 23km SSW of Kodari, Nepal 2015-04-25 09:36:14 UTC-04:00 10.0 km
4.6 51km NNW of Kathmandu, Nepal 2015-04-25 09:30:28 UTC-04:00 10.0 km
5.2 29km ESE of Lamjung, Nepal 2015-04-25 08:44:04 UTC-04:00 10.0 km
4.5 32km N of Nagarkot, Nepal 2015-04-25 08:17:55 UTC-04:00 10.0 km
4.2 36km N of Nagarkot, Nepal 2015-04-25 08:01:13 UTC-04:00 10.0 km
4.4 21km SSW of Kodari, Nepal 2015-04-25 06:53:43 UTC-04:00 10.0 km
4.8 32km E of Panaoti, Nepal 2015-04-25 06:40:35 UTC-04:00 10.0 km
4.2 20km WSW of Kodari, Nepal 2015-04-25 06:23:19 UTC-04:00 10.0 km
5.0 31km NNW of Nagarkot, Nepal 2015-04-25 05:30:29 UTC-04:00 10.0 km
5.7 33km SE of Xegar, China 2015-04-25 05:17:02 UTC-04:00 10.0 km
4.9 19km N of Kathmandu, Nepal 2015-04-25 05:03:15 UTC-04:00 10.0 km
5.3 1km WNW of Banepa, Nepal 2015-04-25 04:55:55 UTC-04:00 10.0 km
5.0 41km SE of Lamjung, Nepal 2015-04-25 04:29:24 UTC-04:00 10.0 km
4.7 22km W of Kodari, Nepal 2015-04-25 04:20:11 UTC-04:00 10.0 km
4.9 17km ENE of Banepa, Nepal 2015-04-25 04:16:59 UTC-04:00 10.0 km
4.6 20km E of Nagarkot, Nepal 2015-04-25 04:05:37 UTC-04:00 10.0 km
5.0 15km NNE of Nagarkot, Nepal 2015-04-25 03:47:01 UTC-04:00 10.0 km
4.5 22km E of Banepa, Nepal 2015-04-25 03:39:33 UTC-04:00 10.0 km
4.8 33km N of Kathmandu, Nepal 2015-04-25 03:16:56 UTC-04:00 10.0 km
4.8 5km SE of Panaoti, Nepal 2015-04-25 03:13:44 UTC-04:00 10.0 km
5.0 25km S of Kodari, Nepal 2015-04-25 03:07:59 UTC-04:00 10.0 km
5.5 25km NNE of Nagarkot, Nepal 2015-04-25 02:56:34 UTC-04:00 10.0 km
6.6 49km E of Lamjung, Nepal 2015-04-25 02:45:21 UTC-04:00 14.6 km
5.1 28km SSW of Kodari, Nepal 2015-04-25 02:37:58 UTC-04:00 9.8 km
5.3 65km ESE of Hachijo-jima, Japan 2015-04-25 02:35:45 UTC-04:00 77.2 km
7.8 34km ESE of Lamjung, Nepal 2015-04-25 02:11:26 UTC-04:00 1
This is one of the first sites I check everyday, and a few times per day…
http://earthquake.usgs.gov/earthquakes/map
Old geologists never die, they just rock on…
Likewise, the USGS site is on my daily do-list. But when significant and/or deadly earthquakes happen and I want more info I tend to go here:
http://earthquake-report.com/2015/04/25/massive-earthquake-nepal-on-april-25-2015/
There was a 7.3 foreshock 2 days before the massive Tohoku quake.
http://en.wikipedia.org/wiki/List_of_foreshocks_and_aftershocks_of_the_2011_T%C5%8Dhoku_earthquake
At the time I thought it was fantastic that Japan could shrug off the effects of such a moderately large quake. Then the main shock happened. I cannot say if there are any similarities, aside from both quakes being on thrust faults.
Powerlineblog has an article on the latest study into the warming pause.
http://www.powerlineblog.com/archives/2015/04/global-warming-more-moderate-than-worst-case-models.php
I like the way Steven Hayward sums up the study conclusions.
Gail very interesting did not know just thought round ball “earth” gravity equal anyway fellow AGW denier I hope.
Rah::For me the sun is going through its normal cycles (ie Billions of years): Therefore expect massive earthquakes, glaciations ie =NORMAL (over billions of years) unfortunately we only live max 100 years its absolutely nothing that’s why we will NOT see climate change in our lifetime.
I bought one of these t-shirts years ago, and it gets more interest than you can imagine. It has allowed me to talk about the CAGW scam with complete strangers, and it has never failed to get positive results.
https://junksciencecom.files.wordpress.com/2011/03/demanddebatetee.jpg
Our lives are insignificant on a geologic scale, but they can be significant to others, if reason is firmly seated.
Fix reason firmly in her seat, and call to her tribunal every fact, every opinion. Question with boldness even the existence of a God; because, if there be one, he must more approve of the homage of reason, than that of blindfolded fear.
-Thomas Jefferson
Eliza. Though sun spot counts are the longest running data set in science I don’t think we even know what “normal” is when it comes to the suns long term (millions and billions of years) cycles or even if there really are “cycles” except the expected transitions towards brown dwarf status. The time scale is just too long. We can study other similar stars in their various stages but as for cycles? Same problem as with the sun. The time scale is just too long.
Actually if we saw climate change (glaciations) we would be all dead long time ago. Fortunately we only live 80-100 years these days hahahaha
The switch from the Wisconsin Ice Age to the Holocene occured in ONE YEAR!!! The switch to glaciation takes longer — a decade to decades. Of course we will not see the mile high glaciers but all it takes is short growing seasons to mess up human civilization.
Slides:
https%3A%2F%2Fweb.viu.ca%2Fearle%2Fgeol-412%2FDansgaard-Oeschger%2520cycles.pdf
Paper: (paywalled)
Ice-core evidence of abrupt climate changes
Richard B. Alley*
So there is zero guarrantee the climate will remain stable and reason to believe it can change ‘abruptly’ within years to decades.
This will probably occur in North America in then next 100 years so don’t worry LOL https://www.youtube.com/watch?v=P5jfHzKDDJ8 but your children may have a problem.
That’s why I live in the tropics (South America) neutral, no wars, neutral, reasonably warm even in an ice age, countries never involved in WW1 or WW2 or WW3 LOL
The tropics are nice if you don’t enjoy seasonal changes, but I do. I actually enjoy Winter, and I don’t have kids, so no worries!
This will occur in North America because the sun changes but it will take 100,s of years. https://www.youtube.com/watch?v=P5jfHzKDDJ8
I do love Americans very much. You remind me of the Romans especially Claudius and Augustus would be very proud of you but I don’t think humans should be living in cold climates (basically we are advanced monkeys which live in the tropics our blood temp is 37.4C ) hahahah BTW just joking
Actually I am not joking Humans should not be living in Cold climates it does not make sense even if you like cold. God my ex Swedish girlfriend HATED me for saying this LOL
Some 2.5 million years ago, our ancestors’ brains expanded from a mere 600 cubic centimetres to about a litre. Two new studies suggest it is no fluke that this brain boom coincided with the onset of an ice age. Cooler heads, it seems, allowed ancient human brains to let off steam and grow.
http://www.newscientist.com/article/mg20327194.000-did-an-ice-age-boost-human-brain-size.html
She was right! 😉
Actually, if you look at human history your wrong. Though we may have come out of Africa the greatest civilizations, the ones that have had the most influence on how we live today, have for the most part have advanced far from where monkeys and apes normally abide.
This is interesting but I don’t think it means much https://www.youtube.com/watch?v=V_BbpsPaSvk
Kerry’s Bike accident http://www.jpost.com/Not-Just-News/Iranian-news-sites-erupt-in-rumors-that-Kerry-hurt-in-ISIS-assassination-attempt-404900
I have been looking for some video or a photo of Kerry’s “accident”, and I finally found it…
https://www.youtube.com/watch?v=vJXU7EVXs2A