
In 1939, all of Greenland’s glaciers were melting, and faced “catastrophic collapse”
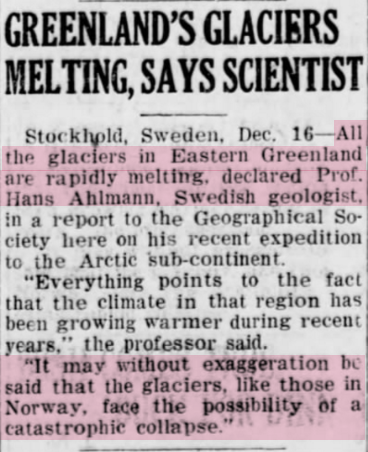
This is the identical wildly exaggerated rhetoric being used by scientists today. All nonsense, all the time.
In 1939, all of Greenland’s glaciers were melting, and faced “catastrophic collapse”
This is the identical wildly exaggerated rhetoric being used by scientists today. All nonsense, all the time.

All these stories are by scientists who go to Greenland in the summertime. I wonder why you don’t hear from scientists who go to Greenland in the wintertime.
Ha! yes, they all seem to go in the summer, and almost all seem to go to the coast. Not too many going to central Greenland in the winter… Odd that, huh?
We saw this earlier in October, but here is the original PR release. For decades “climate experts” have been saying the seas are doomed, and yet the foundation food source for all souther ocean creatures is going to double. They are not co-ordinating their doom-speak.
http://acecrc.org.au/news/southern-ocean-phytoplankton-growth-set-to-double-by-2100/
By the way, what is an astrophysicist from JPL doing in Tassie studying Antarctic ice, without a geological background. Maybe because NASA don’t do space anymore, and DC funding goes to climate scams these days. Its interesting. NASA should change their name to NAA! 🙂
http://acecrc.org.au/people/dr-tas-van-ommen/
NAISA — National Atmospheric and Islamic Studies Administration
Anyone who wants to live stream a lecture on what the Uni of Tassie ice scientists found in East Antarctica, Link is below
Date: Monday, 16 November 2015
Time: 5:30pm EDST Australia
Location: University of Tasmania Waterfront Building, 20 Castray Esplanade, Hobart
http://acecrc.org.au/news/a-soft-underbelly-in-east-antarctica/
Odd that Rintool talks of ocean warming in the Antarctic..
https://notalotofpeopleknowthat.files.wordpress.com/2015/05/14southernssta_thumb.png?w=504&h=333
100%. If you start any study with embedded biases, then you’ll account for evidence that supports your bias and discount that which does not. Human nature, but especially strong in ego driven academics.
Further interesting stuff on Antarctica Circumpolar Current from CSIRO in the 1990’s before they became a religious organisation.
http://www.parks.tas.gov.au/fahan_mi_shipwrecks/infohut/acc.htm
An another interesting one.
http://oceanworld.tamu.edu/resources/ocng_textbook/chapter13/chapter13_04.htm
In my view the mass of high salinity (heavy) & very cold water created each SH winter that sinks to the bottom and flows north into each ocean basin is significant. As the Antarctic sea ice volume ebbs and flows with the 11 yr solar cycle, this north flowing current will speed up and slow down periodically somewhat independent of the ACC which is at surface to intermediate depth. This ebb & flow will influence the El Nino cycle as this current hits the Galapagos and upwells when strong. And we know the solar cycle has the most influence of the Antarctic Sea Ice extent. Chris Beal’s work on matching ENSO with solar cycles is a smoking gun, but I suspect the ebb& flow of the north flowing deep sea cold, salty and dense current is the bullet. FWIW 🙂
Stephan or anyone else. Is there a temperature record for Greenland presented in a graph as has been presented here for the US so many times?
https://stevengoddard.wordpress.com/2014/11/06/greenland-temperatures-peaked-80-years-ago/