
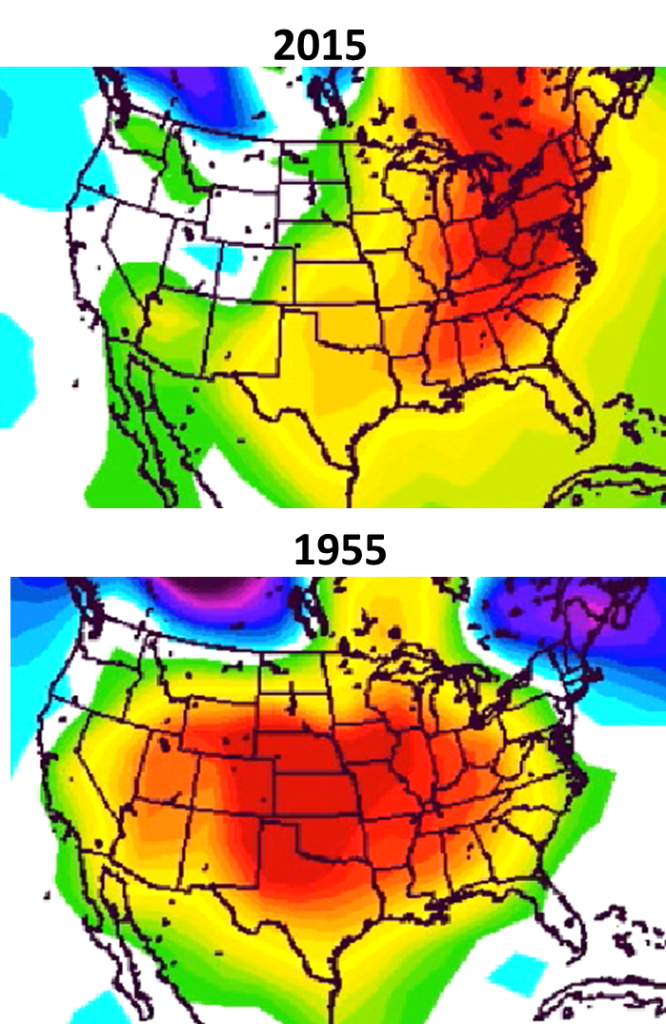
Christmas Eve 2015 was warm in half of the US, but 60 years earlier the entire US was warm on Christmas Eve. Kansas, Oklahoma and Texas all reported temperatures over 90 degrees on December 24, 1955.
Disrupting the Borg is expensive and time consuming!

Google Search
-
Recent Posts
- Fact Checking The New York Times
- New Visitech Features
- Ice-Free Arctic By 2014
- Debt-Free US Treasury Forecast
- Analyzing Big City Crime (Part 2)
- Analyzing Big City Crime
- UK Migration Caused By Global Warming
- Climate Attribution In Greece
- “Brown: ’50 days to save world'”
- The Catastrophic Influence of Bovine Methane Emissions on Extraterrestrial Climate Patterns
- Posting On X
- Seventeen Years Of Fun
- The Importance Of Good Tools
- Temperature Shifts At Blue Hill, MA
- CO2²
- Time Of Observation Bias
- Climate Scamming For Profit
- Climate Scamming For Profit
- Back To The Future
- “records going back to 1961”
- Analyzing Rainfall At Asheville
- Historical Weather Analysis With Visitech
- “American Summers Are Starting to Feel Like Winter”
- Joker And Midnight Toker
- Cheering Crowds
Recent Comments
- Bob G on Fact Checking The New York Times
- Bob G on Fact Checking The New York Times
- arn on Fact Checking The New York Times
- conrad ziefle on Fact Checking The New York Times
- arn on Fact Checking The New York Times
- Bob G on Fact Checking The New York Times
- conrad ziefle on Fact Checking The New York Times
- Bob G on Fact Checking The New York Times
- czechlist on Fact Checking The New York Times
- conrad ziefle on Fact Checking The New York Times
More bait for Marty “Wrong Graph” Smith.
http://media.myfotojournal.com/blogs/adventures/photos/2010/02/24/large_piranah0001.jpg
No wonder he wants to go to the lake so badly, he thinks he is catching fishermen.
I notice that M. Winston Smith on the other thread rolled out all the Alarmist talking points for Ted.
I am commenting here to respect Ted’s request that we do not interfere.
I already addressed the water vapor feedback and clouds a few weeks earlier and the fact the water vapor is just not going up as predicted. There is also the missing hot spot.
Dr Evans does the physics link Links to full series on new climate model HERE He also does a calculation of the CO2 climate sensitivity that is in line with the experimental data.
RACookPE1978 gets into the sea ice/no ice effects at the poles HERE and in several comments above and below. Martin has it backwards. Open water in the Arctic especially in the fall when it is the most open radiates lots of heat to space. Also it is Antarctic sea Ice that really affects the albedo since it is much closer to the equator. (about five times as effective)
Methane, I have not bothered to follow after a brief look and after seeing the Russian Scientists said it was a tempest in a tea cup. Seems just like with oil spills it is bacteria to the rescue!
Gail,
The alarmists are always going to be wrong because they have the basic physics wrong.
Besides that, they think the planet is warming but it is not and has not been warming since around 1997 or so. Honest temperature records would have us cooling a bit since 2004 or so. But even so, we know that historically warming comes first and then a rise in CO2 which tells anyone being honest that CO2 does not do the warming — something else does that.
The poor fool of a troll you mention is obviously very stupid or he/she is just having a spot of fun by playing an alarmist crazy. I vote for stupid, but I don’t really know for sure.
But if he should read this comment, he should have a ball with my next sentence. CO2, on net, cools the surface rather than warms it. So there. :-p
Happy Holidays to you and yours Gail.
And a very good New Year to you Mark.
Hey Gail! I am also grabbing the popcorn and letting the two have a go at it. For a moment I thought Marty was just going to chicken out again, and posted as much, apparently at the same time Marty was posting his latest attempt at building another strawman. I’m guessing that right Marty is busily scouring the talking points over at SkS, looking for some way to BS his way through this.
Ted is no fool. So I am not laying any bets.
If Marty has taken any science courses, they are the recent dumbed down courses.
The immense damage done to US education is a crime. Why anyone would deliberately want to hobble minds and poison them with drugs and lies is completely beyond me. As I said before we should be mining Mars by now not fighting wars with idiotic muslims.
Why would anyone would deliberately want to hobble minds? To control them. Control is at the root of virtually every leftist/progressive agenda.
Pierre, Steven (Tony) and Joe are my go-to guys; sites bookmarked and followed on Twitter for all three. Thanks to all of them for everything they do.
In the year 1055, it was WAY colder, so yes climate change is true. Lol. You’re an idiot, Steve.
No it wasn’t. The MWP was warmer than now. If you make another comment like that I will ban you.
OK OP-ED. So do have a crystal ball or do you remember those years?
Outside of the now debunked hockey stick, every measure, anecdotal and proxy, states otherwise, so please state upon what evidence you place your statement.
Ad Hominen attacks with no measure of how to validate a statement has become all too characteristic of the media. That is the media which comes close to middle schoolish — ‘well everybody knows it’ and that is how we know it is true.
Impossible to tell if someone picking the MWP would be a denser-than-smith alarmist or a false flag plant paid by Big Oil to make them all look stupid.
Most likely just trolling for clicks on his strange website.
He does have an oddly conspiratorial site, for someone who plainly thinks Tony is a conspiracy theorist. I don’t see how someone with so little faith in the word of the government on one subject can believe them so completely on another. When you get down to the basic measurements, everything in climate science is filtered through the American government, at some point.
I know. I remember looking at the odd assortment at his site when he posted something a while back.
I’m not even sure he thinks Tony is a conspiracy theorist even though that would be logical for an attacker to think. The world is full of strange people and I guess attempts to use logic to categorize them will sometimes lead to false conclusions. You have to use some odd, counter-logical criteria and I don’t know what they are.
I remember wondering if he was so far in the left field that he thought Tony was part of the establishment but I dismissed it as too far out. Maybe I shouldn’t have.
They were growing crops in Greenland during the MWP, which would be completely impossible with today’s climate. So if anything, it was WAY warmer!
My parents took us all to the zoo on that Christmas day…..
Meanwhile back in the reality based universe…..
http://presstelegraph.com/2015/12/29/historic-storm-dubbed-bomb-cyclone-to-slam-iceland-and-uk.html
Superstorm Sandy! World’s Largest Hog Spotosaurus Rex! Super Typhoon Nuri! World’s Biggest Woman! Bomb Cyclone! Yeti sighting reported in Maine!
Reality based universe. Larry’s got it covered.
No a Bomb Cyclone again! Not the Bomb!
https://www.youtube.com/watch?v=by5_k4lv-bA
Of course. I’m headed east.
Stay warm. Let’s have a cold one when you get back.
https://pbs.twimg.com/media/CXbnXY6WAAEoXRT.jpg:large
Aaaah!
http://www.yourfaceisa.com/wp-content/uploads/2013/06/megalodon_gobble.jpg
http://i.dailymail.co.uk/i/pix/2015/07/23/05/2AC4355500000578-3171640-image-a-24_1437627275210.jpg
Climate science deniers deny the demonstrably defensible facts of climate science.
global warming is polling rock bottom…..that was you that voted wasn’t it?
Bigfoot science deniers deny the demonstrably defensible facts of bigfoot science.
Lawrence Martin. Why don’t we do this the scientific way.
Choose a demonstrably defensible fact of climate science (or two) and put it on the table.
I never see anything from the alarmist pool other than something like well, —– we all know it is true
Darryl, you may have missed it but Lawrence posted several hard climate science facts in support of the AGW hypothesis:
He summarized his scientific findings by stating:
I wanted to make sure you have all the facts as posted.
I recently had a “debate” online on a gaming forum so there are some younger people there. It’s funny what they are teaching them. They believe CO2 to be a pollutant. They don’t know what happens when CO2 levels drop below 180ppm. They will avoid that topic like the plague. They believe that there was a “BALANCE”. Not sure what this balance is about. Something relating to CO2 produced by natural causes was absorbed by natural causes or some such thing. And that the little CO2 we produce, even though it is very little, is throwing the entire ecosystem out of whack and is no longer in balance. Never mind that the planet used to have much higher CO2. I personally don’t think they know the planet used to have much higher CO2. Not one of them responded directly to this claim. I kept telling them to go look at CO2 charts that span millions of years, but none of them would.
But yeah, “The balance” is what they believe in. And they don’t know about the pause. They’ve never heard of it and don’t believe it. I gave them a link to the RSS chart with a linear regression line across it and none of them can read charts or look at data. They kept asking for “credible sources” Ie. people who will tell them what they want to hear. In fact, they kept saying that I never gave any sources even though I linked to the data several times. They don’t see graphs or data as “credible sources”. They also know nothing about absorption bands. That part was apparently intentionally left out of their education.
It’s like every time a big lie is squashed in the public eye, they invent new lies to explain away the old lies.
SCARY! Those are the types that burned witches….
Very scary because these young people have the same problems in other areas of learning as well.
Because I was a science department chair, mostly by default, now in retirement I have the opportunity to go to various schools.
Sometimes I come as the chosen contrarian.
I am anxiously awaiting the ‘Climate Hustle’ which is now ready to be distributed
My conclusion to date is that very few science teachers understand even the basics of the hypothesized mechanics of CO2 induced warming.
I am flagrantly angry that an elixir of life is not called a pollutant. Pathetic.
Darryl, proof read you idiot.
The last line should have the word NOW instead of NOT!
Probably the warmest winter in Minnesota was 1877-1878, which has been described as the year without a winter. http://climate.umn.edu/doc/journal/winter_1877_1878.htm . The corresponding months were the warmest on record in Australia. You can find more on Jennifer Marohasy’s blog. And it was unusually hot in South America – http://www.academia.edu/7961294/The_1877_1878_El_Ni%C3%B1o_episode_associated_impacts_in_South_America
Tony
Do you remember these people?
http://forum.arctic-sea-ice.net/index.php/topic,1377.msg67427.html#msg67427
It is -42C at the North Pole today
I am impressed by your past fails at trolling that blog and the one at wapo.
I hope you leaned your lesson,
Mike Mann made me promise not to feed trolls, but he didn’t ,emtion feeding off trolls.
Bye
I have no idea what you are talking about. Anyone stupid enough to listen to Michael Mann ….
Buoy 300234062785480 located at 85.45N rose 25C in 9 hours (and is now above freezing). It was -24.3C at 0600 hours (day 363.25) and +1.0C at 1500 hours (day 363.626).
-48C at Eureka(Nunavut) at 3 am, wind has since kicked in and its a scorching -33C now
Ice nerds! Jim Hunt! How is the old chap doing? Êtes-vous Laurent?
I am not Jim Hunt,
I will have to look him up.
I am sure there must be another hilarious Tony fail to learn about
You and your friend are giving all Martins a bad name
Pas James, bouffon. Êtes-vous Laurent?
Thanks for the lead, CW
The Jim Hunt related fails by Tony Heller are even more hilarious.
Sans doute, Laurent, très intéressant.
As hilarious as this Tony fail?
https://14adebb0-a-62cb3a1a-s-sites.googlegroups.com/site/arctischepinguin/home/piomas/archive/piomas2011/piomas-trnd6.png?attachauth=ANoY7crUZseRoXSdpj4DFmei_K2KJeLxdCHxjFCpKwvq5n6Wqbcy3N32Z9a_PKs7IrJdlVqlHT2hs33GPuD8Xlkt4YyNShIzQ34IkClFaUTS0ujnJcRQqPIXH6wpfvkelU0o7a3z1J5VYxNkDFDeU-gUBWaXQ0v9PrliOwNPH3EFg9o2d0CQSdARL8jDPUayYDZ2jZ1Z-LZdfsbVj3KsFSRm6RFkKv_ODmpA1nWQA_Dz2ppgwjVZBsJtVg7mc98PPlqA8qbyK5NaOFYA5EBz8_5rGUIG7mhuXw%3D%3D&attredirects=0
Predicted about -1000 km^3 of sea ice for Sep 2015 with a maximum value at 95% confidence of ~2100 km^3. Actual value when that time rolls around? 5839 km^3. Are we to believe that it’s actually a 4-sigma effect? Horrible Tony! Oh wait, that wasn’t Tony saying that…
-Scott
“SHIPPING FORECAST at 05:20 on @BBCRadio4. It’s not often that we warn of Hurricane Force 12”
https://twitter.com/bbcweather/status/682060418735566849
No, it’s not often, which proves the climate in England at 50 N latitude is changing due to a weather event there which proves the whole earth’s climate is changing due to CO2 absorbing 0.6 more watts/m^2 at the equator in the summertime when Earth normally gets 1369 watts/m^2, even though all the rest of the world is not getting Hurricane Force 12 anywhere at all.
Yep, I’m a believer. Very convincing.
https://twitter.com/bbcweather/status/682020073498906624
Please show me an ACE chart for any hurricane basin showing an increase.
What is even funnier is EXTREME weather is the earmark of a coming ice age according to Paleoclimatologists. A glacial inception that is now due or over due. The Little Ice Age was right on time but a Solar Grand Maximum intervened ~ 1850, or may be not.
In more ‘sciency’ words as Marty would say..
Giant waves.. broke off and threw megaboulders onto and over 20 m-high cliffs. No wonder Hearty and Neumann called glacial inception a Climatic Madhouse!
Dr. Wallace S. Broecker, the father of modern paleoclimatology, says in his paper: The End of the Present Interglacial: How and When? Quaternary Science Reviews, Vol. 17
The IPCC actually said in the Science Report in TAR:
Dr. Robert Brown is a physicist at Duke University who did research on nonlinear dynamics, aka, chaos theory, for nearly twenty years. His mentor was Dr. Richard Palmer (ex associate director of the Santa Fe Center for Complex Systems ) He explains to the layman a bit about chaos theory and strange attractors.
First it is helpful to have a view of the temperature for the last five million years when the climate has been bistable.
The present continent configuration, with the closing of the Isthmus of Panama and the opening of Drake Passage had a major impact on the Earth’s climate causing the present Ice Age. The earth is now in an ice age, just within the brief warm spike called the Holocene. You can see in this graph of the last five million years the switches from one ‘Strange Attractor’ to another.
http://jonova.s3.amazonaws.com/graphs/lappi/Five_Myr_Climate_Change_Rev.jpg
If you look at the Wisconsin glaciation, between the last interglacial and this one you can also see these “abrupt swings” called Dansgaard–Oeschger events in this graph.
http://www.geo.arizona.edu/palynology/geos462/grip_doevents.gif
Both of these graphs support the idea of the climate as a “Complex nonlinear multivariate systems… exhibit[ing] “strange attractors”
Dr Brown in June of 2012 went on to explain:
Dr. Robert Brown, also makes this comment on climate, chaos theory and “strange attractors”
Dr. Brown is one of the consistently bright lights in real climate science. His various comments (especially at Watts’ blog) are always worth reading. His statements on chaotic systems are the best I seen online. If I wore a hat, I would tip it to him.
Jason,
That is why I have several pages of his comments saved. He really does make a lot of sense.
To back up what Dr Brown (and the IPCC) is saying about climate and chaos theory, here is a July, 2014 paper finding the climate is ‘highly nonlinear’
Synchronization of North Pacific and Greenland climates preceded abrupt deglacial warming
This is a good summation of the actual state of the science from Philip Stott, professor emeritus of biogeography, University of London who also edits the Journal of Biogeography.
Steven, for crying out loud. The link in your post goes to a page that just links back to your page, so we can’t fact check what you and Joe Bastardi have said. The two of you are simply repeating what each other has said. There is no scale on your maps, so there is no way to know what they mean, but you earlier posted a map showing locations where the temperature was over 60F, and you were comparing that to the map for this Christmas where the temperatures were much higher than 60F. You can’t compare those two things, but you did anyway, and your readers obviously didn’t fact check. Now we can’t fact check you on your latest repeat of that claim, because your links don’t work and your maps are not labeled at all.
Note that the anomalies computed in 1955 used a different mean baseline than the mean baseline used today. The period for the mean baseline used today didn’t begin until 1961. It runs from 1961 to 1990. The computation for 1955 used a different mean baseline, which was lower, so if you used anomalies computed in 1955, your two maps are NOT comparable. I’m betting you didn’t know that.
“Steven, for crying out loud. The link in your post goes to a page that just links back to your page, so we can’t fact check what you and Joe Bastardi have said. The two of you are simply repeating what each other has said. ”
That’s how trolls like trolls Heller and Bastardi roll.
https://pbs.twimg.com/media/CXfLrhmVAAAR7yq.jpg
https://www.youtube.com/watch?v=G8GwT7ZotCg
SO?
In the 1970s I watched a house float down the river and OVER the bridge I had just driven over (through water) an hour before. (WV) It also rained for 40 days plus in Indiana The rivers were so high we rescued some kayakers who had just gone over one of the Army Core of Engineer dams on the Blue River .
https://twitter.com/DrShepherd2013/status/682276298283184128