
Disrupting the Borg is expensive and time consuming!

Google Search
-
Recent Posts
- Fifty Years Ago Today
- Truth Or Consequences
- US Climate Trend Maps
- Declining Spring Snow Cover In Northern New Mexico
- You Can’t Fool Mother Nature
- Cattle And The Climate
- One Atomic Bomb Per Hour
- New Video : Analyzing Oil And Gas
- Is Antarctica Melting?
- High Speed Analysis And Visualization
- El Nino To The Rescue?
- Fake News Update
- Growth Of Antarctic Sea Ice
- 65 Years Of Progress!
- El Nino To The Rescue?
- Worst March Drought On Record
- ChartGL Process Control Demo
- The Biggest Money Laundering Scam
- Drought In The Headwaters Of Lake Powell
- Unrealistic Expectations Of Water Availability
- Did Bill Gates Do This?
- Worst March Drought On Record In The US
- The Real Hockey Stick Graph
- Analyzing The Western Water Crisis
- Gaslighting 1924
Recent Comments
- Bob G on Truth Or Consequences
- Weylan McAnally on One Atomic Bomb Per Hour
- conrad ziefle on Declining Spring Snow Cover In Northern New Mexico
- Bob G on You Can’t Fool Mother Nature
- Ivan G Wainwright on You Can’t Fool Mother Nature
- conrad ziefle on You Can’t Fool Mother Nature
- Bob G on You Can’t Fool Mother Nature
- Gordon Vigurs on You Can’t Fool Mother Nature
- arn on Cattle And The Climate
- Bob G on Cattle And The Climate
No global warming since Al Gore’s “Inconvenient Troll”
I prefer “Goodbye Norma Jean”
… back when we were entering the “Ice Age” (OhMiGosh – my finger slipped and I almost type Agw instead of Age)
Hasn’t been any global warming since I got my HotMail account either. (1996)
Or since I dumped my AOL account.
About your satellite data…
You really do have to stop saying it’s more accurate:
Rep. Lamar Smith,
Chairman House Committee on Science, Space, and Technology
2321 Rayburn House Office Building
Washington, DC 20515
RE: your Op-Ed 26 November in The Washington Times
Chairman Smith:
I read your op-ed with considerable interest. I’m a retired engineer whose work experience included several years in satellite design. As I read your article, my impression was that you do not understand the so-called “satellite temperature” data developed by Roy Spencer and John Christy of UAH. Allow me to provide some information.
The MSU series of instruments and the later AMSU measure microwave intensity from orbit, that is, from the top of the atmosphere. Theoretical work has been developed to support the claim that these measurements for each channel of the instrument correspond to a “bulk” temperature profile thru the atmosphere. When Spencer and Christy presented their first effort in 1990 (1), they worked with data from channel 2, which they still produce, (now labeled TMT for Temperature, Middle Troposphere).
However, in 1992 (2), they presented results which showed that the channel 2 data is distorted by emissions from the stratosphere, which has exhibited a well known cooling trend. For this reason, they proposed a modification of the channel 2 data, (now labeled TLT for Temperature, Lower Troposphere) which they claimed removed the distortion from the stratosphere in the MSU data.
The TLT computation begins with the 11 scan positions which the MSU produces for each swath across the ground track below. There are 11 positions, labeled 1 thru 11, with #6 being straight down (nadir). There are also 2 more positions at the ends of each swath, one viewing deep space and the other viewing a heated target which is monitored for temperature with two accurate resistance thermometers. The TLT algorithm actually includes only 4 of the 11 positions, throwing out 5, 6, and 7 and using 1, 2, 10 and 11 as a correction for the data from 3, 4, 8 and 9. Thus, the resulting TLT data can not be said to “ provide “complete global coverage”. Also, the data can only be provided between 82.5N and 82.5S, due to the inclination of the orbit. Spencer and Christy calculate a gridded data product including higher latitudes, which they calculate by interpolation, artificially extending beyond the range of available data.
The TLT algorithm is based on theoretical calculations, using a model of the microwave emission and adsorption at each pressure altitude added together from the surface to satellite altitude. Spencer and Christy have never publicly revealed the method they used to create their algorithm, which is rather curious, as the assumptions used may be critical. Some of the microwave energy in channel 2 comes from the Earth’s surface and the TLT computation adds more surface effects, thus the TLT is not a pure measure of temperature. As the MSU instruments are retired, newer AMSU instruments are replacing them and Spencer and Christy have created a different algorithm in order to include the AMSU data into the TLT. They claim that they are simulating the TLT from the MSU, again without specifying the method used to do so. They have continued this lack of transparency with the latest TLT (version 6), which Spencer briefly described on his blog, but which has not been published after peer review.
The important point to remember from all of this is that the TMT is not useful for measuring climate change and the TLT is highly theoretical. In spite of being aware of these limits, Spencer and Christy have presented the TMT in testimony to Congress, showing a comparison between the TMT and the results of computer simulations, both globally and over the tropics. What they don’t mention is that to produce their graphic, they have simulated the orbital altitude TMT measurements from the GCM results (3), using CMIP5 data from the KNMI Climate Explorer website (4). The model results from KNMI are monthly averages and include only temperatures at 3 pressure levels, the surface, 500mb and 200mb pressure height, as I understand it. The method to translate those monthly values into simulated TMT results remains an unpublished mystery.
Spencer and Christy’s claim (which you repeated ) that the satellite data does not exhibit as much warming as that from the surface is not surprising. The 13 satellites’ orbits take the instruments across each latitude at the same time of day with each orbit, the equator crossing times being nearly constant. The surface temperature record is usually an average of the temperature at a location, computed as an average of the daily low and high temperatures. This average will not be the same as the temperature measured at a fixed times of the day, say 10AM and 10PM, which the satellite might see over mid-latitudes. And, at the highest latitudes, each pass provides measurements half way between the equatorial crossing times, 3AM at one pole and 3PM at the opposite pole. At polar latitudes, the orbits overlap, giving multiple measurements during the day, which are summed into a grid box, while in mid latitudes, there are missed areas between the ground swaths, which exacerbates the lack of coverage in the TLT.
Twelve years ago, my curiosity led me to perform an analysis of the UAH TLT data, the results of which I published in a peer reviewed journal in 2003 (5). I found an apparent discrepancy at high latitudes of the Southern Hemisphere, which I suggested might be due to the effects of sea-ice. After my report, the group at Remote Sensing Systems (RSS) decided to exclude any coverage to the south of latitude 70S from their version of the TLT, their reasoning being that the high elevations over the Antarctic was distorting the measurements. RSS also excludes data from other regions with high elevations, such as the Andes and the Himalayas. I later performed an analysis using the TMT product, finding that these data did not exhibit the anomalous characteristic which I noticed in the TLT. These results have not been published, but can be made available on request. It would be of interest to see the result of a similar analysis using the latest version 6 of the TLT, though I am not likely to perform such an effort.
In conclusion, I think these facts provide very good reasons to discount the “satellite temperature” data when assessing the climate change resulting from mankind’s activities adding CO2 to the atmosphere.
Best Regards,
Richard Eric Swanson, AAAS, AGU
References:
1. Spencer, R. W., J. R. Christy, Precise monitoring of global temperature trends from satellites, Science 247, 1558 (1990).
2. Spencer, R.W., J. R. Christy, Precision and radiosonde validation of satellite gridpoint temperature anomalies, Part II: A Tropospheric retrieval and trends during 1979-90., J. Climate 5, 858 (1992b).
3. http://www.drroyspencer.com/2013/06/epic-fail-73-climate-models-vs-observations-for-tropical-t ropospheric-temperature/
4. http://climexp.knmi.nl/selectfield_cmip5.cgi?id=someone@somewhere
5. Swanson, R. E., Evidence of possible sea-ice influence on Microwave Sounding Unit tropospheric temperature trends in polar regions, Geophysical Research Let., doi:10.1029/2003GL017938, (2003)
These are the SAME satellites that also measure many other things warmists use for their claims such as ice and snow cover,hurricanes and tropical storms and more.
Martin prefers making massive adjustments to 10,000 instruments we know little or nothing about, and making up 50% completely fake data.. What a clown.
Yes he is grasping at straws here since the Satellite data is obviously superior to the wildly erratic ground based temperature data.
“Satellite data is obviously superior to the wildly erratic ground based temperature data”
As proven by the trend comparison to USCRN.
Martin just admitted we can’t measure temp at all…
Martin-
Tony usually quotes the RSS numbers, which your article clearly praises as being more reliable than UAH.
As to the rest, thank you for the informative comment.
The coverage of the satellites, while not complete, is still enormously greater than that of thermometers. Off the top of my head, I don’t know the angular width of the equatorial gaps in coverage, but I now it’s neither large, nor permanent. Today’s gaps do not align with tomorrow’s gaps. And at the highest latitudes, there’s basically zero coverage from any source. I believe Vostok is the only permanent weather station above 82.5 degrees north or south. There may be more, but certainly less than 10.
The reason for the 11 positions on the satellites is to cancel out the distortion caused by looking through the stratosphere. By measuring the signal through multiple angles, you get knowable differences in the lengths of stratospheric and tropospheric air columns. With those different measurements, you can calculate the relative strengths of the signals from each level of atmosphere, and eliminate the levels you’re not measuring. It’s not perfect, but it’s statistically valid with enough data points. I don’t know why angles 3-9 are thrown out, but I suspect it’s because they found that data to be redundant, and saw little or no change when it was included. Angles 1 and 11 should provide the overwhelming bulk of the difference.
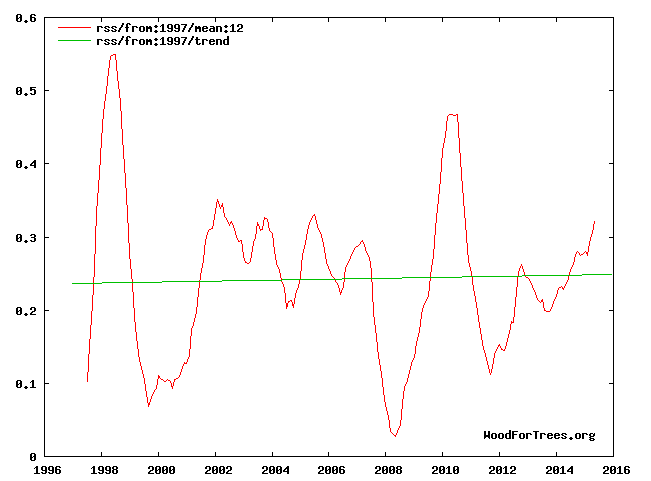
Yes, Ted, but even using Steven’s cherry-picked start year, the trend is increasing in the troposphere. Using the entire RSS record, the trend is quite steep. But the real here is you now have the knowledge you need to accept that satellite temperature measurement is not more accurate than the surface measurement systems.
“the real point here”
Martin, please think before you type…
“but even using Steven’s cherry-picked start year”
The way you figure out how long it’s been since something happened…
…is you start from now, and go backward
Steve’s start year is right now…..and from right now, you can go backward almost 2 decades and there is no global warming
Your point is totally repudiated by the trend comparison of the satellite data to the only untainted evenly spaced surface data.
Again , you have NOTHING except empty propaganda rhetoric.
And only a massive fool puts trend lines across major events like the El Nino and thinks it means anything.
Yes the 1998 El Nino, a TOTALLY NATURAL ocean cooling event at the end of a series of strong solar maximum, added some energy to the atmosphere, but since then..
Basically nothing.. the current EL Nino, again nothing to do with any human factors, has so far caused only a slight bump.
If you remove the effect of the 1998 El Nino event , that added about 0.26C to the atmosphere, there is basically no warming at all in the whole satellite data
That means that there is NO CO2 WARMING SIGNATURE..
End of story
NO CO2 warming signature in the non-accelerating sea level trend.
End of story
Arctic sea ice is pretty much where it should be for the phase of the AMO, so no warming signature there either.
End of another story.
The ONLY place that shows any warming is the massively corrupted and fabricated, agenda-driven crap coming from the Schmidt-Karl alarmista hive.
Lat.. The total lack of mathematical understanding from fools like Martin is there for all to see.
As soon as you see them state that the start year is cherry-picked.. you know they have ZERO COMPRHENSION about the maths involved.
In fact, that zero trend is statistically supportable at the 2sd level in RSS, going back some 26 years !!
It is only the step change of the El Nino that stops it going back further.
If you remove that step change , there has actually basically zero warming in the whole RSS satellite data. The slight warming before is cancelled by the slight cooling after.
http://s19.postimg.org/ojf5tbz1v/RSS_cancel.jpg
If Tony wanted to cherry pick, why didn’t he start with 1999?
The start date was chosen by calculating how far back the line can be drawn, without any meaningful slope. That’s exactly the method you’d expect from someone telling you how long the temperature has been stable. There’s no other mathematically correct way to determine that number. Incidentally, I’m sure Gail could link you to numerous studies showing that, if we’d had satellites that far back, a zero trend line could probably be drawn through to some time in the middle ages, and to some time around 10,000 years ago. Looking at the longer term record, we’re currently in a shockingly stable period. Some might even call the current stability “unprecedented.”
https://upload.wikimedia.org/wikipedia/commons/b/b8/Vostok_Petit_data.svg
Let me try that graph again.
http://www.w3.org/Graphics/SVG/1.1/DTD/svg11.dtd
Still didn’t work. One last try:
http://www.w3.org/2000/svg
But don’t take my inability to properly embed a graph as proof of ignorance in basic statistical analysis. You can see the point I’m making by clicking on the first link. The last 10,000 years are the most stable in the last 400,000. Very comfortably so, when compared to previous interglacials.
Ted, take a screen capture, use a graphics program to cut and trim, save as .jpg,
host to an image site then paste the url.. (make sure the .jpg remains.)
I use http://postimg.org/ at the moment, seems to work ok.
It is my understanding that the satellite temp record is in agreement with readings from radiosondes which would provide a means of validation.
The only evenly spaced, untainted surface data set is USCRN. UAH and RSS trend over the USA are a very close match to USCRN
This is called sample validation and validates the data extraction algorithms of the satellite temperature data.
Again, Martin runs from REAL DATA and real science.
Martin, your post contains two gross inaccuracies. First, UAH ws verified by radiosondes up the entire west coast of North America to insure no latitudinal biases. See Christy’s APS testimony to Koonin’s committee. Second, UAH has published their processing algorithm details. For v.6, Spencer did a description of the changes on his blog, and noted that a formal paper on them was in the peer review process.
Please research more before making or repeating easily verified falsehoods. Some of us fact check rather rigorously since so many climate untruths have been spread.
Let’s see: Only 30% coverage of the earth, where it is hopelessly biased by UHI effect, is preferable to nearly complete global coverage. And “RSS decided to exclude any coverage to the south of latitude 70S” – which just happens to be where temperature has actually been gradually decreasing and sea ice growing.
Boggles the mind.. or does it.
Mr. Smith,
UAH is cross-checked by RSS and both are crosschecked by balloon sondes, all of which agree, the surface sets, like GISS and NOAA, etc … their raw data shows cooling (non-warming), then when they are done mangling it, voila’ ever-increasing warming.
Your argument would be rational absent the triple cross-check and differing methods (RSS and UAH are not identical processes), but with these, it is fair to say, that the satellite and sonde data are much more accurate than the surface sets.
I smell a rat:
Spencer and Christy calculate a gridded data product including higher latitudes, which they calculate by interpolation, artificially extending beyond the range of available data.
Our correspondent, Swanson R E, seems unable to distinguish between ‘interpolation’ and ‘extrapolation’. Interpolation (filling in between measurements) is usually much more reliable than extrapolation (extending beyond a measurement). It is extrapolation that causes climate models to be such a joke.
Long letter, not much real information.
I found an apparent discrepancy at high latitudes of the Southern Hemisphere, which I suggested might be due to the effects of sea-ice.
The crux of the letter gets no explanation at all. You’d have thought with all that preamble we might be heading for an explanation but no, a bald assertion of ‘a possible influence’, totally unquantified.
That’s bound to convince everyone?
Who is Richard Eric Swanson? I can find zero info on this guy.
I came up with zero, as well.. Perhaps that’s what he is.
Interesting. The conclusion of his paper is not the same as the conclusion of his letter…
These observations question the validity of the TLT product for assessing climate change at latitudes greater than 60, until the cause of the day 105 reversal is fully investigated.
The alarmists are known for their embellishments of their “work”, after peer review.
Let’s look at the trends in the one place and period that has an UN-TAMPERED, EVENLY DISTRIBUTED surface record (All converted to Fº/year.)
USCRN — +0.0035 Fº/yr
ClimDiv — -0.0199 Fº/yr
UAH USA48 — +0.0038 Fº/yr
UAH USA49 — +0.0239 Fº/yr
It appears that UAH still has a very slight WARMING BIAS against reality.
Right – so you’re citing a LETTER to a politician to make what point? UAH data sucks? Really? The UAH measurements and processes have been through the peer review process, the letter … not so much. Plus there is that inconvenient fact that RSS data actually is pretty close to UAH data which is pretty close to the radiosonde data, unlike the tinkered-with “data” generated by gavin and co.
We’re doing the peer review right now.
Personally, I’m just happy to see something of actual substance from Martin. Not a LOT of substance, but certainly better than the usual, “Stop lying Steven.” I don’t know how to respond to, “Wrong graph.” But this one contained things that can be intelligently debated. I consider that a step in the right direction, and I hope it continues.
Actually Martin is an astonishingly good example of The Dunning-Kruger effect.
I have thrown tons of graphs and studies at him showing that the ground measurements are spotty and error prone over the course of weeks and he completely ignores them.
As I’ve mentioned many times before.. Martin is totally SCARED of real data.
He runs from it.. he runs from the numbers and the reality that it shows.
He must do so, because he knows it is all contrary to his moronically held brain-washing.
Again you forgot to mention the uncomfortable truths about ocean warming…of course if all observations are denied seas are not warming nor rising,,,LOL
GEE, you mean Observations like these PEER REVIEWED STUDIES?
TEN PEER-REVIEWED PAPERS PROVING SEA LEVEL IS NOT RISING
Notice the area where Roman sea ports are inland is tectonically stable according to NASA.
List of Roman Sea Ports found inland
(Has great pictures and maps.)
For the areas occupied by the Romans it was pretty close to zero or actually sinking! “..the pivot point is rather abrupt; Scotland is still rising due to the rebound effect which is correspondingly sinking England 2 millimetres into the North Sea each year.”
A NASA model of current surface elevation change due to post-glacial rebound and the reloading of sea basins with water. Canada, Northern Europe, and Antarctica are all currently rebounding at a rate of a few millimetres per year. More water in the oceans as a result of ice sheet melting is slowly depressing sea basins. Satellites are used to observe differences over time. http://basementgeographer.com/glacial-isostatic-adjustment/
https://i0.wp.com/basementgeographer.com/wp-content/uploads/2013/05/PGR_Paulson07_big.jpg
STUDY #1
Mid to late Holocene sea-level reconstruction of Southeast Vietnam using beachrock and beach-ridge deposits
Translation the sea level was up to 1.5 meters higher than today in a tectonically stable area ~5000 years ago to 2000 years ago. Tectonically stable area refers to areas devoid of deformation such as all processes which modify the external form of the crust. For example unidirectional vertical movements, plate tectonics and also the rise and fall of the solid earth surface, especially in coastal areas, caused by external factors such as climate change (gio-isotasy, hydro-isotasy)
STUDY #2
Sea-level highstand recorded in Holocene shoreline deposits on Oahu, Hawaii
This study shows a sea level highstand ~1.6 meter above the present level from ~5500 years ago to 2000 years ago.
STUDY #3
Late Quaternary highstand deposits of the southern Arabian Gulf: a record of sea-level and climate change
This study shows a sea level highstand ~1 to 2 meters above the present level about ~5500 years ago.
STUDY #4
The Quaternary Geological History of the Santa Catarina Southeastern Region (Brazil) 1999
The first part discusses drilling in several locations and analyzing samples. They mention dating prior to that was guesses. “…. A drilling campaign done in the domain permitted the sampling of material for 14C datings, and the obtained data confirmed some previously assumed ages. The sequence of events, that originated the Holocene deposits, has been also reconstructed through drilling and 14C dating of the collected peat and shell samples…”
In the body of the text is this:
This study shows a sea level highstand ~ 4 meters above the present level about ~5000 years ago. With sea level oscillating since then. Not only has the sea levels have dropped since the Holocene Optimum the evidence shows that “warmer paleotemperatures were favourable for great proliferation of mollusks in the area”
Santa Catarina Brazil is at latitude 27.2500°S and is tectonically stable.
STUDY #5
Holocene sea-level change and ice-sheet history in the Vestfold Hills, East Antarctica
The above is a RELATIVE sea level. The area is not tectonically stable because the area has isostatic uplift in response to deglaciation from the Wisconsin Ice Age. The same applies to the following study.
STUDY #6
A new Holocene relative sea level curve for the South Shetland Islands, Antarctica
VALIDATION BY ALTERNATE STUDIES
GLACIAL ADVANCE
STUDY #7
Ice free Arctic Ocean, an Early Holocene analogue
STUDY #8
Temperature and precipitation history of the Arctic
STUDY #9
A new approach for reconstructing glacier variability based on lake sediments recording input from more than one glacier January 2012
The highest glacier growth started 600 years ago prior to that most glaciers had melted away.
THIRD METHOD OF VALIDATION
STUDY #10
Sea Level Changes Past Records and Future Expectations
…………………
Have they corrected for the 18.6-yearly Luna Nodal cycle? Linear trend lines on sinusoidal curves are very time dependent.
The Dutch who are the most concerned about actual sea level rise have found the cycle.
The Effect of the 18.6-Year Lunar Nodal Cycle on Regional Sea-Level Rise Estimates
Fedor Baart†,‡, Pieter H. A. J. M. van Gelder†, John de Ronde†,‡, Mark van Koningsveld†,§, and Bert Wouters†
(wwwDOT)bioone.org/doi/abs/10.2112/JCOASTRES-D-11-00169.1
Linear trend lines on sinusoidal curves are very time dependent.
“Cooling…German Springs Arriving 20 Days Later Than 28 Years Ago!”
http://notrickszone.com/2015/05/31/cooling-german-springs-arriving-20-days-later-than-25-years-ago/
Darn good read for those interested in such matters. And another example of official government lies.
And yet another study:
The oceanic temperature record at best shows warming just in the South Atlantic and Indian Ocean basins, the remainder showing no significant increases. Furthermore, the amount of warming detected is at most of the order of a few hundredths of a degree and probably well within the overall margin of error.
Since 2001, The trend in the satellite ocean data is as close to zero as ZERO gets.
No warming since Constantine the Great ruled the Roman Empire.
Cooling since Plato and Socrates were head bangers
Although I support your overall position on the so-called Global Warming, it is not a convincing argument to other than us skeptics to show the satellite data as “the” data of global temperature changes. The warmists always use the GISS/NOAA data – and now more so with the new adjustments that (conveniently for COP21) get rid of the “pause”.
I don’t know how to get around the problem of skeptics and warmists using different data on the same subject. Sea level rise is another one: the warmists show it accelerating whereas the skeptics show same-old-same-old. Comparison to modeled temperature rise has the same disconnect between “us” and “them”. We show only 3 of 114 model runs are similar to observation, and, in fact, Hansen’s “C” Scenario of zero additional CO2 rise to be the closest model to observation, and they say, no, “B” if not closer to “A”, the complete disaster!
Satellite data, radiosondes and tidal guages get zero traction in the MSM landscape. Net global ice, net Antarctic ice gain, get no daylight either. Greenland sheds less ice now than in 1912 (hello, Titanic!) and has an internal ice gain, but is drowning the world in meltwater. Meanwhile, the small amount of water released by glaciers at source is considered enough to end the flow of the mighty Ganges (and others, including my hometown Bow Riverr in Calgary) downstream, where rate and volume ratios tell you most water comes from recycled rain and snow.
The public is not buying the hype exactly. But the hype still gets press, money and excitement. I suspect the only ending to this charade is through death and retirement, with the upcoming looking to create their own peer-value through individualized conclusions (rather than parrotting the statements of their mentors). With Strong gone, Hansen and Suzuki in retirement, we could be on the cusp of reasonableness, but it is probably another generation away. The Gore “disciples” would have to renounce him – look what happened to Jung when he disagreed with Freud. Not likely to happen.
The biggest or most basic question I have with the warmist camp is their continued use of the 114 model projections 27 years after they were first unveiled. In all this time, should not the more extreme of them have been discontinued? No one has ever explained to me how you go from “here” to “there” by 2100, when sealevels and temperatures have to accelerate their climb multiple times OUTSIDE of CO2 rise projections and proposed sensitivities. If ANY of the models are essentially correct, we have to get from where we are to where they fear we will be within the parameters of the models. But almost all of them don’t do it. So the only way to get to disaster in 2100 is to say that the models are inadequate.
I say again: the only way to get to disaster from today is to say the current IPCC models are inadequate. They have the basic science calibrated incorrectly. They have basic assumptions about how the world works, including what is the “natural variability” wrong. Sea-levels and temps will jump …. because there is a series of scientific relationships that are not configured into our models that will do it. But we can’t revise the projections, because we don’t know what those cause-and-effect relationships are.
Global Warming, Obama claims, COP21 are bizarre beyond comprehension. It’s lke a man who assures you he has $100 in his pocket when he isn’t wearing any pants.
It’s lke a man who assures you he has $100 in his pocket when he isn’t wearing any pants.
Ha ha ha ha ha ha ha ha ha ha ha!
“I don’t know how to get around the problem of skeptics and warmists using different data on the same subject.”
…………
At this point with the deaths of thousands in the UK and elsewhere DIRECTLY attributable to the FRAUD at NOAA, the MET and BOM, I favor trials for accessory to murder.
https://media2.stickersmalin.com/produit/100/stickers-devil-smile-R1-143760-2.png
I have had it with dishonesty and deliberate fraud that infects government and academia and I would love to have a real Nuremberg style trial with Hansen, Schmidt, Soros, Gore and the rest up on charges.
Barring that I will have to settle for the major decline in temperature and the severe weather that accompanies it looming on the horizon.
Actually, having no children or close relatives of a young age, I am rooting for a descent into glaciation at this point. It really is time to cleanse the human gene pool of the dead weight.
AMO:
https://i0.wp.com/climate.mr-int.ch/images/graphs/amo.png
AMO and NAO
http://www.vukcevic.talktalk.net/AMOandNAO.htm
Pacific Decadal Oscillation (PDO) Index – 1000 year reconstrution by NOAA
https://upload.wikimedia.org/wikipedia/commons/thumb/1/11/PDO1000yr.svg/800px-PDO1000yr.svg.png
AMO+PDO = Temperature Variation: One Graph Does Not Says It All
Chuckle.. If you look at the far right on the PDO graph…..
You can see the 1970’s global cooling scare in blue,
followed by the 1980-90 global warming scare in red. 🙂
I am surprised to see such a huge cold period during the MWP.
It is a NOAA reconstruction !
Greenland is back to losing mass, 2012 was the only on-balance year in the past decades:
http://polarportal.dk/fileadmin/polarportal/mass/Grace_curve_La_EN_20150800.png
[SG : who is this clown?]
You still haven’t understood a single thing , have you.
You remain totally ignorant.
Look at the AMO chart above. 2012 is right at the peak.
It is now heading down , and this year Greenland is adding ice quite quickly.
Going to be hilarious to watch you warmista clowns in a couple of years, as the AMO drops and the Greenland and Arctic ice levels continue to climb. 🙂
This year is largely covered in the graph and Greenland is losing mass again.
BTW the mass-loss started already in the early nineties and part of it is ocean-driven.
http://beta.dmi.dk/en/groenland/maalinger/greenland-ice-sheet-surface-mass-budget/
Grace has know issues. !
Yes the cycle is ocean driven..
That is EXACTLY what we are trying to get through your THICK ,BRAINLESS SKULL !!!
Look at the AMO. the low point is 1979, exactly where that alarmista like to start their Arctic sea ice graphs.
Now look where we are currently, just past the peak of the AMO, and already Arctic sea ice and Greenland are starting to show signs of gain.
FFS.. stop being an ignorant twerp, its tedious and its boring !!
What is the source of your chart? A link will do
Hover with mouse and you’ll see the link. Or open image only in another tab etc. etc.
Nope, I get nothing
It is some site called polarportal.dk that shows what is called a Grace curve.
Let’s not forget that Grace had the Antarctic losing mass
https://www.nasa.gov/mission_pages/Grace/news/grace20121129.html,
UNTIL….. 🙂
http://www.sciencedaily.com/releases/2015/10/151030220523.htm
http://wattsupwiththat.com/2015/11/05/yet-another-study-shows-antarctica-gaining-ice-mass-accumulation-highest-we-have-seen-in-the-last-300-years/
Altimetry, gravity and SAR all agree that Greenland is losing mass.
“Wibble…
Yeah if you ignore all the measurements, Greenland is NOT losing mass, Arctic sea ice is NOT on a rapidly declining trend and the oceans are NOT rising. Fantastic!
The measurements show that Arctic sea ice has turned the corner, and is climbing again. ..exactly as one would predict from the position of the AMO.
It is still WAY ABOVE the zero summer ice from most of the first 3/4 of the Holocene.
There is NO ACCELERATION in sea level change. Once adjusted for the sinking of its reference point (which the alarmista fraudsters neglect to do even though they know about it), even the satellite data shows a constant, 1.4mm/year.
And as shown. This year Greenland has gained mass at a rate faster than the 1990-2013 average.
So….. cfdope is wrong on ALL counts.
http://beta.dmi.dk/en/groenland/maalinger/greenland-ice-sheet-surface-mass-budget/
So far this year, Greenland has gained surface mass this year at a rate far above the 1990-2013 average.
This is very unusual considering the current position of the AMO. (see chart below where 1990-2013 period is highlighted.
It should NOT be re-freezing this quickly.
http://s19.postimg.org/6l19p7ycz/amodmiaveg.jpg
Since Europe has been unseasonably warm for months I postulate that the jet-stream is acting up again…might explain what is going on in Greenland.
postulate whatever you like. .we know where it comes from .. starts with poster….
“… Europe has been unseasonably warm ….” ????
………….
You Just aren’t reading the real news which never makes it into the Propaganda Rags.
Record December snowfall in Iceland- Not just for the day, but the entire month!
Residents of Reykjavik woke up to 42 cm (16.5 inches) of snow this morning – the highest depth of snow in December since records began. According to the Icelandic Met Office, the previous record of 33 cm (13 inches) was set on 29 Decemberin 2011, when snow lay 33 cm (13 inches) deep in Reykjavik on 29 December that year. http://icelandmonitor.mbl.is/news/nature_and_travel/2015/12/02/record_december_snowfall_for_reykjavik/
Heavy Snow just fell In Armenia
http://ban.jo/Enterprise/Weather/20151203/Heavy-Snowfall-In-Armenia-Erevan/
And also in Turkey.
Britain faces longest winter in 50 years after earliest ever arrival of Siberian swan
The arrival of winter, traditionally heralded by the migration of Siberian swans, has come early as 300 birds flock to Britain
http://www.telegraph.co.uk/news/weather/11926752/Britain-faces-longest-winter-in-50-years-after-earliest-ever-arrival-of-Siberian-swan.html
Almost 300 “snow patches” remained in the Highland mountains in 2014
(wwwDOT)bbc.com/news/uk-scotland-33581400
Glacier-like hazards found on Ben Nevis in 2014
(wwwDOT)bbc.com/news/uk-scotland-highlands-islands-28885119
August 27, 2015 saw a massive Increase in Scottish Snow Patches
https://weatheraction.files.wordpress.com/2015/08/wpid-scottish_snow_patches_20150827t140213.jpg?w=700
30 September 2015 BBCNews Snow patch clings on in Glen Coe
…………………………………
ELSEWHERE
…………………………………
We won’t even talk about Russia which has been getting plastered.
Sioux Falls sets snowfall record for 2nd time in the month of November. By the end of November snowfall was already more than half entire 2014-15 season total.
https://twitter.com/NWSSiouxFalls/status/671672098033688576/photo/1
Yesterday, the South Korean Meteorological Administration on Thursday issued a heavy snow warning for Seoul and some other cities, where temperatures dropped below freezing. — (wwwDOT)sandiegouniontribune.com/news/2015/dec/03/image-of-asia-taking-a-photo-in-snow-covered-seoul/
Last Wednesday there was 44cm of fresh powder snow on the ground – the deepest snow to cover Sapporo Japan since 1953. The ski resort of Niseko just south of Sapporo received 24cm on Tuesday. Significantly more is expected in the next two or three days. — (wwwDOT)aljazeera.com/news/2015/11/japan-sapporo-surprised-sudden-snow-151126094756184.html
Heavy snowfall also hit Heilongjiang Province on Wednesday.
http://www.globaltimes.cn/content/956306.shtml
http://en.gmw.cn/2015-12/03/content_17949530.htm
Italy captured the world’s one day snow fall record twice this last winter in March TWICE.
240cm (7.84 ft) in Pescocostanzo
256cm (8.34 ft) of snow Capracotta
A total of 10 feet (3 meters) of snow fell on Passolanciano, Majella burying the chairlifts (6 Mar 2015 )
Not far away, the Greek islands in the Mediterranean were buried under 6½ ft (2 m) of snow in January.
In Norway they were forced to remove excessive snow from ski slopes – “During the last two days we’ve got more snow than we had in the last two years together,” said Vegar Sårheim. “I had never believed we would experience this.”
FROM 2014:
(1) 2014 had the greatest snow cover in the Northern Hemisphere since data collection began in 1968 — (Rutgers University Global Snow Lab).
.
The Great Lakes obliterated all records for springtime ice last year, and this year.
On March 1, 2014 the Great Lakes were approaching 100% Ice Cover – For The First Time On Record, only Lake Ontario was the only major holdout
https://stevengoddard.files.wordpress.com/2014/03/lice-00-1.gif?w=640&h=480
By March 26, 2014 the Great Lakes broke all records.
https://stevengoddard.files.wordpress.com/2014/03/20140324180000_cvchdctgl_0007583110.gif?w=640&h=494
March 3, 2015: Great Lakes ice cover over 88%, more than last year
And on 14th October 2014, Water temperature of the Great Lakes is over 6 degrees colder than normal
This letter to US Senator Ted Cruz explains how we know, beyond reasonable doubt, the AGW story is based on DOGMA, rather than DATA !
https://dl.dropboxusercontent.com/u/10640850/Manuel_Letter_to_Senator_Cruz.pdf
The links work better in this unsigned copy of the letter:
https://dl.dropboxusercontent.com/u/10640850/Letter_to_Senator_Cruz.pdf
The Arctic Sea Ice “recovery” has stalled. Perhaps AMO will save the ice in the future but so far that has not happened.
It has not stalled. It was just doing better than it should have for the position of the AMO.
Do try to learn a bit and keep up, child-mind.
I can’t keep trying to explain things to you if you really don’t want to be bothered even trying
Just for fun , I took the following graph
http://nsidc.org/data/seaice_index/images/n_plot_hires.png
Flipped it ,and overlaid it on the relevant section of the AMO graph (light green for visibility)
http://s19.postimg.org/4crolmgmr/amo_vs_NHice.jpg
You can clearly see the NH ice levelling off as the AMO peaks, and why the whole NH ice scare is such a load of put-up propaganda BS. !!
…….good job Andy!!
NICE! It even has the flatting of the sine cure on the top of both.
It is VERY obvuois m isn’t it. ! 🙂
As I’ve said before.
Arctic sea ice, Greenland, and the NH ice in general, are all behaving almost EXACTLY as the AMO would dictate.
(Maybe a bit more ice than there should actually be in a mythical smooth curve world)
correct reply to Martin ShXX should have been radiosonde baloons and RSS satellite confirms UAH satellite. You missed it
Andy or someone else has already told Martin the Gorbot that several times.
As I said Martin is a classic case of The Dunning-Kruger effect.
Anything that does not fit into his PC universe he completely ignores.
Let’s look at the trends in the one place and period that has an UN-TAMPERED, EVENLY DISTRIBUTED surface record (All converted to Fº/year.)
USCRN — +0.0035 Fº/yr
ClimDiv — -0.0199 Fº/yr
UAH USA48 — +0.0038 Fº/yr
UAH USA49 — +0.0239 Fº/yr
It appears that UAH still has a very slight WARMING BIAS against reality.
USA is about 4% of Earth area so who cares?
OMG, you obviously have zero idea about sampling validation.
Do you want me to explain it to you ??????
We can start with some junior high prep maths and science if you like.
Nah.. Keep being ignorant.. it suits you… Its all you have.
cfgjd-
Can you link us to a similarly pristine temperature record in different part of the world, against which the satellite data could be compared? Specifically, the data collection methods need to be rigorous enough for all parties to agree that adjustments are not needed. To my knowledge, the USCRN data set is currently the only one to meet that standard. But if you know of another, we’d all be interested.
cfgi says “USA is about 4% of Earth area so who cares?”
Geography books say: “The area north of the Arctic Circle is about 20,000,000 km2 (7,700,000 sq mi) and covers 4% of the Earth.”
https://books.google.com/books?id=uF3aJSC20yMC&pg=PA24&hl=en#v=onepage&q&f=false
Ouch….
“The Arctic” is larger than just the area above the Arctic Circle. Area above 65N would at least cover all of Greenland which sounds more reasonable.
Yeah, that extra degree and a half down to 65N makes all the difference.
Sorry meant 60N to include Greenland.
and now a pop quiz …
That’s the same size as the antarctic…
Why does the antarctic have more ice?
You have to be an idiot. By definition “The Arctic” is the area DEFINED by the arctic circle.
Also, that’s like saying “supersonic” is not defined by the speed of sound.
Wizzum, you must remember that you are conversing with one of those who believes that all data and definitions are open to wild interpretation, as long as and especially when that interpretation supports “the cause”.
You’re right Gator, definitions mean nothing, after all having an x and y chromosome no longer means you are male.
Got a reference for your “definition”?
The Arctic Circle is the northernmost latitude in the Northern Hemisphere at which the sun can remain continuously above or below the horizon for 24 hours.
Anything South of that line is Sub Arctic
Ooops forgot to add: Any Dictionary or Encyclopedia.
Do some of your own homework, you ignorant cfool.
No wonder you remain so steadfastedly DUMB !!
Here.. this is about your level
http://www.ngkids.co.uk/places/ten-facts-about-the-arctic
the very first point.. because I’m prettys ure you won’t even bother to follow the link..
1. The Arctic is located at the northernmost part of our planet. Scientists usually define the Arctic as the area above the ‘Arctic Circle’ — an imaginary line that circles around the top of the globe.
Urgent COP21 Update!
Watch as Gore’s BS melts reporter’s brain…
https://www.youtube.com/watch?v=_5JSRf3Bkpg
Who wants to wager that the dampness in her shorts is surpassed only by the dampness between her ears?
Dampness, no doubt, caused by catastrophic man made global warming.
I see no real difference here. Do you?
http://www.youtube.com/watch?v=Iwqgdr7maW4
I need one of those sick bags. Yuck !!