
North Pole to melt today! Earth to drown! Models are reality!
The Terrifying Storm That Will Melt the North Pole This Week – The Atlantic
The closest buoy to the North Pole is showing -10C at 1800 GMT
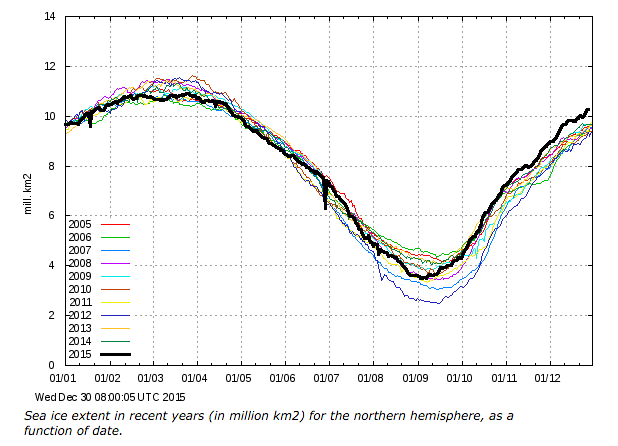
Just like Patricia last month. The most powerful hurricane ever – which did almost no damage. Meanwhile, here in the real world, Arctic ice is screaming back towards 1990’s levels.
At 1900 GMT the temperature is still -10C
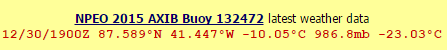
At 2000 GMT the temperature is still -10C
There was a spike, but nowhere near the freezing mark

The current temp is apparently 42F?
However, this is nothing abnormal at all, according to this history going back to 1968:
http://weather-warehouse.com/WeatherHistory/PastWeatherData_NorthPole_NorthPole_AK_December.html
December has been this warm, in fact warmer, in the past, eg. 1965, ’68, ’82, ’85. It 1982, it reached 47F in December. In January 1981 the warmest was 50F, and in 2009 55F.
Between the Medieval warming period and the Little Ice age, the Earth cooled 6-10C. Since the LIA, only warmed 2-3C. What are these alarmists whining about?
Democrats and Greenies have for sure lost my vote for pretty much ever. I hope the rest of the country wakes up to their apparent communist agenda. Listening to Bernie Sanders makes me almost wish for Joseph McCarthy! “Have you ever been a member of the Communist party?” And we’re worried about Muslim infiltrators?
In other good news, the price of energy stocks has come down dramatically. I’m pretty sure coal and oil aren’t going away any time soon. The investment savvy might make a killing. Some coal companies are going bankrupt, however.
The Greens love it watching people lose their jobs? While they sit in their cozy coal-fired or natural gas warmed homes or burn carbon producing wood from their fireplaces.
Err North Pole, Alaska is a different place.
And today’s temps are weather, no climate.
I think they’re talking about THE North Pole, not North Pole AK, North Pole is not even in the Arctic Circle, it’s about 1700 miles south of the pole.
And I bet that THE North Pole wont get within 20 degrees of that forecast next week.
Well it did, but why do we keep talking about weather?
There are several sites reporting the predicted North Pole warming. One of them: http://time.com/4164104/north-pole-temperature-heat/ Time Magazine Science Section originally ran the piece with a link to temperatures for the “North Pole” and mistakenly linked to North Pole, Alaska. My guess is that Organic Fool read the Times version. Times has corrected their link now.
OK, that seems fair, maybe 1700 miles south of the pole it might.
Yes, Penthouse Sidebar (@drfessel) posted the link to the Time piece here and said:
I saw it but I had to step away before I could save it. By the time I got back they removed it and covered their tracks.
Ha! I think somebody confused the two places. I simply wanted a historical temperature record. I didn’t even notice it was Alaska! I see similar comments on other sites regarding this confusion.
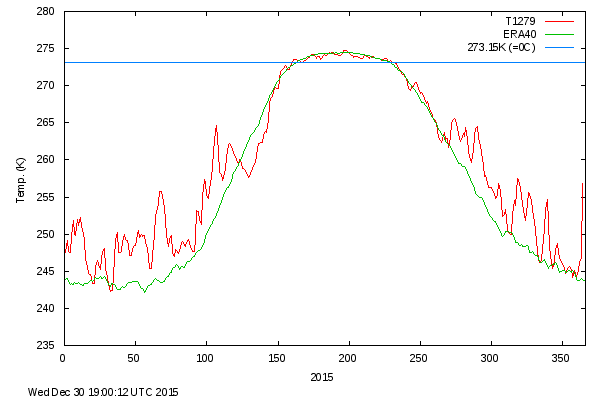
So the question is, is this warmth actually expected to occur at the real North Pole? As Tony’s link shows, it is currently well below freezing.
People here smarter than the average polar bear! 🙂 Good job.
Who predicted this last Saturday?
HINT: not Tony Heller aka Steven Goddard
[SG : Martin continues babbling incoherently. Is he off his meds?]
Who? Who else predicted that Wednesday will see the usual BS from climate alarmists?
COLORADO WELLINGTON says:
“Who else predicted that Wednesday will see the usual BS from climate alarmists?”
Was it Steve Goddard, the second dumbest man on the internet?
I have to thank Colorado Wellington for the lead to this hilarious Goddard fail from 2013
Don’t worry Tony, I won’t tell anyone here about that dirty little secret
Lawrence, stop the evasions.
Who else predicted the North Pole would unfreeze and melt away in this storm?
This is your chance to finally publish some hard, verifiable data. Spill the beans and give us the list! Who are they? If you have the goods, talk. You’ll be famous and Tony may give you a special section in the header.
Who predicted this last Saturday?….
Predicted what? That it wouldn’t get above freezing at the north pole?
Ring centerbet in Australia and ask them what odds for above freezing at 90 degrees north on Wednesday. You might be able to retire if you can sneak up with a zippo and hold it under the thermometer for a while.
Tony has been calling the ClimAstrologist liars and fools for years.
Tony Heller JUST HIT THE BIG TIME!
The IDIOTS CAN NOT TELL THE DIFFERENCE between the North Pole 90N and the TOWN North Pole ALASKA.
http://pics2.city-data.com/city/maps4/frs3515.png
http://www.city-data.com/city/North-Pole-Alaska.html
http://4.bp.blogspot.com/-v4833RhLE_E/Tw22kabjfSI/AAAAAAAACSE/BuGRpVFctFQ/s1600/ROTFLMAO%255B1%255D.jpg
You are the lamest troll at the hate blog
GEE Thanks, I really do try hard.
Of course when you keep playing straight man giving me so many great opportunities to show what idiots warmist are it is not very hard.
You are a sexist pig. Can’t stand a woman that is exponentially smarter than you?
Gail is anything but a troll and has plenty of very good ammo to blow away any and all alarmist stooges that would dare to take her on.
I don’t know what you guys are talking about…there’s no 50 degree increase in temps going on……
Did anyone bother to actually check?
It’s -30 with a light breeze right now.
Don’t know when this high temperature was supposed to hit..
….but it ain’t happening
Temps are predicted to fall like a rock for the rest of the week.
http://www.yr.no/place/North_Pole/Other/North_Pole/
and the long term…. http://www.yr.no/place/North_Pole/Other/North_Pole/long.html
What they are talking about is an idiot reporter. Robinson Meyer, didn’t check his facts and confused the town North Pole Alaska, outside of Fairbanks with the real North Pole at 90N. The town is going to have a temperature above freezing. Not all that surprizing in an El Nino year.
Since Lawrence Martin is incapable of following the thread and actually READING and COMPREHENDING what has been said he is calling Tony a liar and other things.The rest of us are laughing at his idiocy.
http://www.theatlantic.com/science/archive/2015/12/iceland-storm-melt-north-pole-climate-change/422166/
That is not true….why am I not surprised that the hateful troll tells another big lie?
Gail, this is no time to laugh.
These terrifying storms that melt the North Pole cause psychotic periods in believers. There were cases of entire families committing suicide because of climate change they saw right outside of their windows. People call hotlines and line up at ERs when they hear about the North Pole melting. They beat their cars with a stick and ban them from their driveways out to the street. They refuse to buy gasoline for days on end. They report their neighbors’ Christmas lights to the police. They tweet Bernie for help and make donations to Greenpeace. Most of them end up in expensive long term therapy but they will never be the same.
You must be careful about these trigger points.
ROTFL….thanks Gail!!
I got here late….
I do not think he made a mistake. Really, I think it is just another alarmist trying to float a story which emtiocommies get a flushed feeling conviction about, and this emotion overrules any and all later facts.
Look how cold it is in Miami!
http://www.theweathernetwork.com/ca/weather/manitoba/miami
Winterpeg humour … bless their frozen little keisters 😉
Alert, Canada high for the next 10 days is -10F
We call that BBQ weather here up north, break out the swimsuits and bring your own beer.
if there were any honesty in the press there would be front page, above the fold rebuke of Robinson Meyer and of all the idiots he cites in Sunday’s newspapers. My prediction for the Sunday papers; no mention of this trash article and another trash article with another outrageous claim that will become more new ‘truth’.
As Colorado Wellington said @ December 30, 2015 at 9:00 pm above
So it was a gaff but instead of admitting it they are covering it up.
I guess it serves their interests to publish a frightening prediction. When it doesn’t come to pass, nothing further will be said about it, and people will remember the prediction even if nobody knows that it never happened. But if it does come to pass, then we will never hear the end of it.
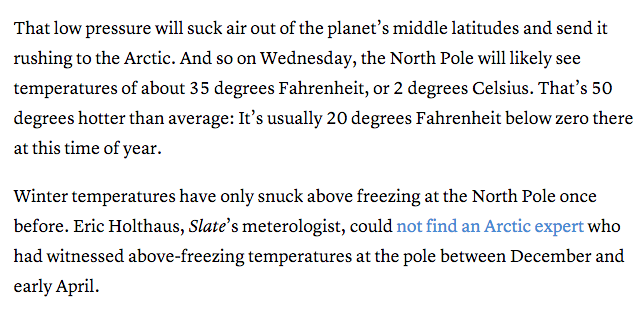
I find it rich that the fact that Eric Holthaus “could not find an Arctic expert who had witnessed above-freezing temperatures at the pole between December and early April” implies that just because one person could not find another person that witnessed such, means that it has never happened before! But I guess these sorts of thing are what pass for proof if you are an alarmist.
It would not surprise me if someone is being dispatched with a small heat source to visit a buoy or two to ‘help out’ natural variability and ensure that there is an official record that will match the prediction. Of course, the record may be set in pretty much the same way as the warmest year record is set. (Adjustments after the fact and from afar off …)
The hiatus is over – so did the Sun do it or what? I thought Sun was gettng more quiet already for some years? Explain please.
IT is a Town in ALASKA called North Pole. Alaska was Ice free during the Wisconsin glaciation so was Siberia.
http://www.cosmographicresearch.org/Images/glacial_maximum_map2.jpg
Sea level was also about 500 feet lower, which they forgot to show on this ice age glacier map. They also forgot to show lots of huge glaciers in the Rockies and Sierra Nevada.
I often use this map but it is harder to visualize for the layman.
http://www.esd.ornl.gov/projects/qen/NEW_MAPS/northam.gif
or this which is a bit better.
http://www.esd.ornl.gov/projects/qen/NAL2215.gif
If you think about it, just the change in sealevel causes a big part of the temperature change going from glacial to interglacial conditions. The 500 foot drop in sea level is an effective rise in altitude for the landmasses. Thanks to the dry lapse rate, the surface cools ~1.5C.
A very strong low pressure system developed over the past couple of days in the N Atlantic. It deepened to a very intense central pressure of 928 mb at 0600 UTC 12/30/15, and is one of the strongest systems to have impacted the Atlantic in recorded history. The system rapidly intensified as it strengthened to a hurricane force low pressure system en route to the NE Atlantic producing very high winds and seas. This video of the enhanced infrared Meteosat-10 imagery and the SEVIRI RGB air mass product shows the entire development of this extremely powerful system. The associated OPC Atlantic surface analyses are also included at the end of the video.
https://www.youtube.com/watch?v=xY6mbyN-aRQ&feature=youtu.be
https://www.youtube.com/watch?v=ZCBIAmtaKuA
Here’s the offer. I’ll fund the trip to the pole. You have to buy a million dollar life insurance policy and name me the beneficiary and you have to stand outside at the pole in just a bathing suit for 1 hour.
Deal?
In -10F weather? An hour?
I stood on top of the highest lift at Soldier Mountain ID (Bruce & Demi’s place) for 2 hours in -25F weather and 20 mph wind wearing nothing but a downhill speed suit about 10 years ago and only suffered a case of trench foot. I was wearing ski boots, a helmet and gloves though. -10 F is nothing! OK, I did stand behind the lift wheelhouse too 🙂
So what’s in it for me?
Yeah, I used to X-country ski in a silk shirt all the time in the mountains in NH. It would get -10 or -20F or even -30F. If it was windy I used a wind breaker tied loosely in front with long ties I sewed on. I still had to be careful not to over heat.
The warming “event” is already over. There was an hours long warming near the N Pole. to 1c. It’s now moving west and is currently under 0 C. And this is very small area surrounded by very cold air like -29C. Alarmists like marty and cf get all worked up over “weather”.
.nullschool.net/#current/wind/surface/level/overlay=temp/orthographic=-102.67,86.42,819/loc=-119.047,89.628
Let’s try this
http://earth.nullschool.net/#current/wind/surface/level/overlay=temp/orthographic=-102.67,86.42,819/loc=-119.047,89.628
Nice graphic. I would have never guessed that anthropogenic CO2 could cause all that weather motion. But never fear, after it’s homogenized and adjusted it will all be one uniform temperature all over the Arctic, because as you know, CO2 is a well mixed ghg. (/sarc)
Nukkschool is a nice website to watch the jet stream.
Go here and click on the ‘globe’ and turn it to see the surface winds in different areas.
http://earth.nullschool.net/
and you get the north pole view surface level winds
http://earth.nullschool.net/#current/wind/surface/level/orthographic=-88.19,71.18,346
Click bottom left on ‘earth’ to show menu.
Here is your jet stream (500hPa) over the north pole
http://earth.nullschool.net/#current/wind/isobaric/500hPa/orthographic=152.04,90.00,360
What’s even funnier is that the atlantic, salon and others picked this up from a blogger who’s a novelist with NO background in climate, climate science, or science for that matter. He thinks the El Nino is going to melt the ice cap! “Looks like we may be setting up for another go at it during the next two summers. The heat pulse from this El Niño is already starting to transition poleward. And it’s still early”. They must be even rolling their eyes even a NASA etc…….
Meanwhile in other news, Ciudad Juarez Mexico got buried under six to ten inches of snow
http://iceagenow.info/wp-content/uploads/2015/12/Ciudad-Juárez-27Dec15.png
And so did Huancavelica, Peru south of the equator. It got 10 cm,(4 inches) in summer.
And China got a record 45 cm (18 inches) of snow in Urumqi
Poor Japan got plastered again. After the last couple winters the Japanese are going to have a hard time believing in Gore Bull Warbling.
http://iceagenow.info/wp-content/uploads/2015/12/Niseko-27Dec15-672×372.png
But the real story is SNOW DRIFTS FROM 7 to 10 FEET along the Texas/New Mexico border.
Winter storm dumps record snow on South Plains
https://t.co/PL9HKwyuUp
Weather is not climate, son.
Wow marty! So from avg -24F to 1F for a few hours and back down to -24F is gonna melt the ice cap? If the power goes out on your refrigerator for an hour or two does all the food spoil?
Hey, droneboy.. did you even read the headline.. It says “Freak Storm”
//platform.twitter.com/widgets.js
Impressive. Can you get me tomorrow’s lottery numbers from your source?
Thanks.
From Larry’s link: “Although there are no permanent weather stations at the North Pole (or really anywhere in the Arctic Ocean), we can use weather forecast models, which ingest data from satellites and surrounding surface observations, to estimate conditions at Earth’s most northern location”.
Models all the way down!!
Martin, this was found to be caused by a polar bear clinging to the buoy!
There is NO MAP showing an Arctic Buoy AT THE NORTH POLE!
This is an example from 2014.
This is the daily location for the buoys of the International Arctic Buoy Programme.
http://iabp.apl.washington.edu/DAILYMAPS/dailyiceconc.jpg
However the current map is conspicuous by its absence. HMMMmm very convenient. The table with locations is also absent.) The archived maps only go back to 2014May31
http://iabp.apl.washington.edu/maps_daily_map.html
Clicking on the interactive words on that page gives
File not found.
Error 404
So the best you are going to get is the 60 day on January 1 2014
ftp://iabp.apl.washington.edu/pub/IABP/DailyMaps/OLDMAPSTABLES/2014Jan01.dailyiceconc.track.jpg
And the 2013 January first.
ftp://iabp.apl.washington.edu/pub/IABP/DailyMaps/OLDMAPSTABLES/2013Jan01.dailymap.60day.jpg
Look at the ocean currents ( Woods Hole Oceanographic Institution)
http://www.whoi.edu/cms/images/arcticocean_circulation_main_206633.jpeg
And then look at the surface winds for the current time period.
http://earth.nullschool.net/#current/wind/surface/level/orthographic=-88.54,88.89,346
Jet stream for the last week
http://squall.sfsu.edu/scripts/nhemjetstream_model.html
So maybe if a buoy was positioned ‘Just right’ it could have ended up near the North pole but I really doubt it.
Kinda fun, seeing all the posts on this thread.—PLEASE READ
I was in a cold weather unit in the military. North Pole AK was just outside of Fort Wainright,
which was just outside of Fairbanks.
We did most of our winter training about 20 miles (about 35 clicks) SW of Wainright, at Fort Greeley or a little base near there at Black Rapids.
Been there until Christmas several times.
Can be so cold, that your urine, oh well never mind.
The first time I got off my snowshoes I got a big surprise, sunk up to my hips in the powder.
Hard to get out of it. especially when everyone was laughing and would not help.
However, one time in the middle of 1980’s, at some air strip near there, in the middle of the boring Jack Pine it did get consistently above freezing which ruined the training. The Jack Pine were the only trees which grew there, max at about 20ft high. That was because of the permafrost.
Boring, boring, boring.
In the summer time, one could see Moose Nuggets everywhere. Because of the weather they did not decay. Did not have to worry about stepping on the nuggets because it never got too dark. Brought home a pair of Moose nugget earrings for my wife. Somehow she lost them.
I got to do something I doubt any readers here have done. I was with a company size unit one time, and no military transportation was available. We all boarded a Commercial 747 carrying our weapons. M16’s some with grenade launchers, M60’s and the like. All we had to do when were getting aboard was to say ‘No brass or AMMO Sir’ with a smile.
Bottom line, weather happens. Unseasonably warm sometimes, Unseasonably cold sometimes.
Riddle me this.
HOW do they know the temperature at the actual north pole?
The ocean going buoys are frozen in place for the winter and I thought there was no coverage of the actual North pole.
http://www.rap.ucar.edu/~djohnson/satellite/coverage.html
UAH covers up to 85 North.
Dr John Christy** says
The surface based temperature set does not measure the actual north pole either.
http://jonova.s3.amazonaws.com/graphs/stations/great-dying-of-thermometers.gif
The Global Historic Climate Network(GHCN) actually DROPPED the far northern surface stations.
CANADA (black triangle is stations in use by GHCN)
https://diggingintheclay.files.wordpress.com/2010/04/canada-bypopulation.png
Note how the ClimAstrologists shifted to using a much larger proportion of stations on the Pacific Coast that will catch the warm water from the El Ninos.
1975 map
https://diggingintheclay.files.wordpress.com/2010/04/canadastations1975.png
ASIA also had a station drop out
https://i0.wp.com/www.climateapplications.com/GHCN/images/Raw_Asia_Unstacked.png
gees. with all this massive Asian area no longer reporting …
looks like we will have to rely on the satellite data 😉
Or we could just ask NOAA/NCDC to just MAKE UP some numbers !!!
“Or we could just ask NOAA/NCDC to just MAKE UP some numbers !!!”
I’m sure Tom and Gavin will manage something, and feed it to GISS, HadCrut, Jaxa etc
Global warming has been almost completely FABRICATED WARMING.
Make up the numbers? Never say so.
From someone who is NOT Steven Goddard and not an American:
What is interesting in missing data and in-filling become MORE prevalent AFTER 1970!
https://3.bp.blogspot.com/_vYBt7hixAMU/S4b1j1_L00I/AAAAAAAAASs/Lwxu5-_sRC4/s400/WMO+Missing+months.png
WTF?!? This is AFTER the 1974 CIA report saying climate was a security problem. It is also AFTER the 1972 First Earth Summit warning of Global Warming so what gives?
Of Missing Temperatures and Filled-in Data (Part 2)
http://3.bp.blogspot.com/_vYBt7hixAMU/S4mYG1RMJfI/AAAAAAAAAS0/dmCFnD3wXJM/s1600-h/Andrew's+Missing+Months.bmp
Figure 1. Quantification of missing months in annual station data (analysis and graph: Andrew Chantrill).
https://diggingintheclay.files.wordpress.com/2010/03/pix2.jpg
Figure 2. Distribution of missing months by month and year (analysis and graph: Andrew Chantrill).
Why Gail! What is your point? Sure, the data was adjusted. We all agree that the data was adjusted! And some of it was so adjusted that it adjusted all the way to nothing — so of course we had to take NEW data, data that started from nothing, and adjust it all the way to SOMETHING so that we would have enough good data! Science!
(Well, maybe not REAL science, but “climate science”.)
sarc-off 🙂
Gail, I know that you have raised a lot of animals, and I assume that you have had to housebreak puppies at some point. Do you ever get that feeling that showing facts and logic to CAGW proponents is rather like taking a puppy and rubbing their nose into the mess that they just made on the carpet? Do you ever get the feeling that some puppies are not quite as bright as other puppies?
Jason,
Puppies? Heck I sometime think they couldn’t pass the Field intelligence testing for Guide Horse Candidates (All the guide horses are housebroke)
http://www.guidehorse.com/images/erik/c2.jpg
“The worlds first horse to fly in the passenger cabin”
This is my favorite test.
We had one dumb blonde (palomino) who never did figure out she had to go to the gate to go through the fence to get to her stall. Even with all her herd mates running to and through the gate she would stand there and scream.
Heck my goats and even my sheep are trained to run mazes. I was selling to a petting farm and the guy (Jason) stood there with his mouth open stuttering but they turn corners! (I was bring them in to a catch pen.)
http://www.guidehorse.com/images/cudd7.jpg
Quick Plug for the Foundation
If you have a friend who needs a guide animal consider one of these minis. The working life of a dog is about ten years. Ponies easily life into their thirties. We buried one pony last year at age 44.
Application
A guide horse? I am flummoxed. I never knew there was such a thing. I am curious though — other than a longer life span, are there other benefits? The thing that I am wondering about, is that dogs have such a long time of living closely with humans (and I would think, more closely than horses though I may be wrong), and innate dog social structure is much closer to that of humans. I can understand that a horse would be much better than no guide animal at all, but do they really adapt well enough to regular modern human conditions? I am just a little puzzled.
And Jason, we had a tiny goat broken to a ‘cat litterbox’
Ha! Good job! Now THAT is a good goat. If you could only train a goat to milk itself and put the milk into the fridge…. 🙂