
Disrupting the Borg is expensive and time consuming!

Google Search
-
Recent Posts
- “Why Do You Resist?”
- Climate Attribution Model
- Fact Checking NASA
- Fact Checking Grok
- Fact Checking The New York Times
- New Visitech Features
- Ice-Free Arctic By 2014
- Debt-Free US Treasury Forecast
- Analyzing Big City Crime (Part 2)
- Analyzing Big City Crime
- UK Migration Caused By Global Warming
- Climate Attribution In Greece
- “Brown: ’50 days to save world'”
- The Catastrophic Influence of Bovine Methane Emissions on Extraterrestrial Climate Patterns
- Posting On X
- Seventeen Years Of Fun
- The Importance Of Good Tools
- Temperature Shifts At Blue Hill, MA
- CO2²
- Time Of Observation Bias
- Climate Scamming For Profit
- Climate Scamming For Profit
- Back To The Future
- “records going back to 1961”
- Analyzing Rainfall At Asheville
Recent Comments
- Bob G on “Why Do You Resist?”
- conrad ziefle on “Why Do You Resist?”
- conrad ziefle on Climate Attribution Model
- Bob G on “Why Do You Resist?”
- Bob G on Fact Checking NASA
- Bob G on Fact Checking NASA
- Ohio Cyclist on Fact Checking NASA
- Bob G on Fact Checking NASA
- Bob G on Fact Checking NASA
- Bob G on Fact Checking NASA
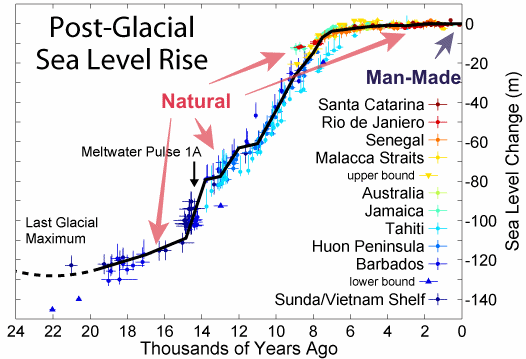
Natural is so catastrophic!
Yep, I’ll take a man-made natural disaster over a natural disaster any day.
Reblogged this on Climate Collections.
http://i67.tinypic.com/ojdn6h.jpg
Actual raw data shows that the sea level in Auckland has been falling from 2011 to 2016, unlike the NZ government graphs that stop at the year 2000. From 1903 to 2009 the sea has risen by 1.4mm per year.
http://i63.tinypic.com/211sbus.jpg
The sea level at an actual tide gauge has been dropping for the last five years. Before that it was rising at 1.4mm per year for over 100 years.
http://i63.tinypic.com/211sbus.jpg
Twenty to eight thousand years ago there was a lot of temperate zone ice to melt. That’s not true today.
Once they stop the seas from rising how do they plan to prevent the next ice age? I’m sure the IPCC already has a plan ready that involves sending money half way around the globe and self-flagellation for those who use energy for unimportant things like heating, transportation, manufacturing etc.
That is why the Regressives and ClimAstrologists switched from Gore Bull Warbling to Climate Hopey dopey Changey
Austerity for the incorrigible deniers is the only answer. Good for the (someone’s/whatever) economy and, to paraphrase the words of Hannibal Lecter: Best thing for them really, their therapy was going nowhere.
What makes you think the rapid rise around 12,000 years ago wasn’t due to man? We already had fire by then, and the slash and burn system of land clearing obviously put CO2 in the air. Let’s all have a pity party of self loathing now.
Sarcasm tags please.
But only straight, white males were guilty and no one else!
India is not at risk.
http://www.cato.org/blog/bright-side-deceleration-sea-level-rise-along-indian-coastline
If You trust the gauges.
You don’t seem to understand. It is George Bush’s fault.
Monitoring El Niño with CMEMS L4 products: http://marine.copernicus.eu/web/16-news-events.php?item=2651
News – January 13, 2016
Satellite altimetry, which measures sea surface height (which rises with higher temperatures during El Niño or falls with colder temperatures during La Niña), is vital for the early detection, analysis and close monitoring of these phenomena.
Altimetry contributes to their forecasts. It is also an important asset to be able to better understand them, and thus better forecast them, including their intensity. With the continuity of altimetry since 1992, an unprecedented time series has been collected. Next satellites will help by ensuring continuity of observations, and improving data quality.
An El Niño was announced early in May 2015. At this time, maps of Sea Level Anomalies showed large areas across the equatorial Pacific with above average. Sea Surface Temperatures were also above-average on May 2015 and strengthens across the east-central Pacific during summer. Those conditions were as high as observed during 1997 El-Niño, and thus forecasts are close to that episode. By keeping in mind, the last years when El Niño aborted, the 2015 event is examined in detail and particularly the atmospheric features. During July easterly winds were weaker than normal. The ocean-atmosphere coupling was in place: El Niño conditions are present. On August, anomalies of sea surface temperatures in the equatorial Pacific Ocean are above average of +2°C. This anomaly of sea surface temperatures in the equatorial Pacific Ocean was still above average up to November 2015. This 2015 event is a strong event. If this anomaly persisted during next months, a very strong event would be reached.
January 17, 2016 Once Again El Nino Didn’t Do What Was Forecast. Why?
A long explanation follows.