
Climate fraudsters frequently claim that the 1990 IPCC temperature graph below showing the Medieval Warm Period (MWP) was only a representation of Central England Temperatures (CET) and was not global.
This is nonsense. The graph was derived from James Hansen’s 1981 study, which was taken from temperatures in England, California and Greenland.
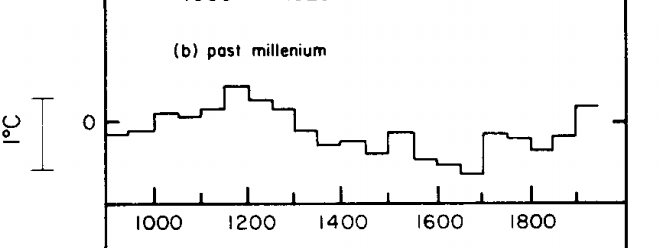
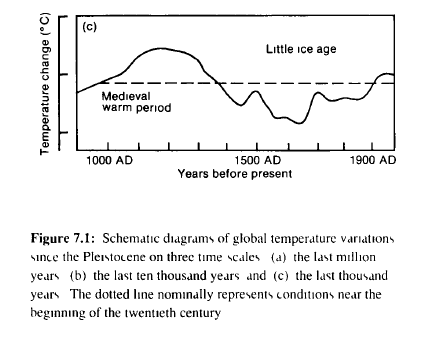
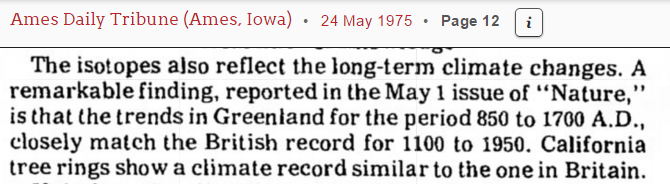
Global temperature trend for …. (b) is based on temperatures in central England, the tree limit in the White Mountains of California, and oxygen isotope measurements in the Greenland ice (W. Dansgaard of the Geophysical Isotope Laboratory, University of Copenhagen, pers. comm.), with the temperature scale set by the variations in the last 100 years
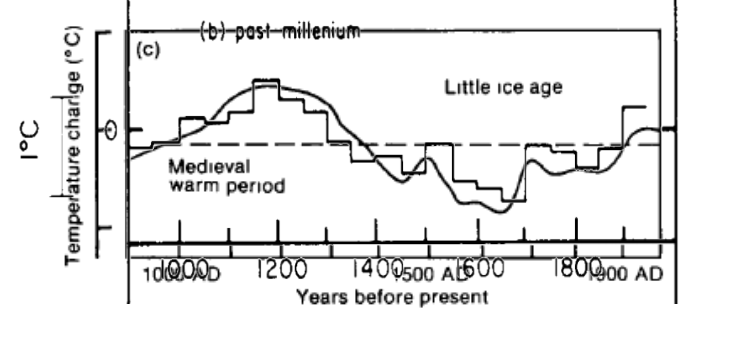
The overlay below shows that the 1990 IPCC graph is essentially the same graph as Hansen 1981.
Hansen’s paper was based on study in Nature from 1975.
The MWP was real, and no matter how many different ways climate criminals find to lie about it, they can’t make it disappear.

Excellent work I say. Excellent work. Keep it up. Before long, the jails will be full of global warmers.
That is a pleasant dream (that AGW liars would be in jail), but sadly I doubt that will ever happen no matter how richly it might be deserved.
When war criminals get Nobel Peace Prizes, other lesser criminals supporting the various control frauds are unlikely to be punished.
Yep, that chart is only for CET, in spite of the fact that it is specifically labeled as showing “global temperature variations”. Actually, I could be easily convinced that The World’s Greatest Climatologist does not know the difference between central England and the entire globe.
Of course we will hear that England, California and Greenland are not the globe. And yet one tree is…
Although McIntyre’s exposure of the “hockey stick” was upheld in 2006 by two expert panels commissioned by the US Congress, the small group of scientists at the top of the IPCC brushed this aside by pointing at a hugely influential series of graphs originating from the CRU, from Jones and Briffa. These appeared to confirm the rewriting of climate history in the “hockey stick”, by using quite different tree ring data from Siberia. Briffa was put in charge of the key chapter of the IPCC’s fourth report, in 2007, which dismissed all McIntyre’s criticisms.
At the forefront of those who found suspicious the graphs based on tree rings from the Yamal peninsula in Siberia was McIntyre himself, not least because for years the CRU refused to disclose the data used to construct them. This breached a basic rule of scientific procedure. But last summer the Royal Society insisted on the rule being obeyed, and two months ago Briffa accordingly published on his website some of the data McIntyre had been after.
This was startling enough, as McIntyre demonstrated in an explosive series of posts on his Climate Audit blog, because it showed that the CRU studies were based on cherry-picking hundreds of Siberian samples only to leave those that showed the picture that was wanted. Other studies based on similar data had clearly shown the Medieval Warm Period as hotter than today. Indeed only the evidence from one tree, YADO61, seemed to show a “hockey stick” pattern, and it was this, in light of the extraordinary reverence given to the CRU’s studies, which led McIntyre to dub it “the most influential tree in the world”.
http://www.telegraph.co.uk/comment/columnists/christopherbooker/6738111/Climategate-reveals-the-most-influential-tree-in-the-world.html
One Tree in Yamal to rule them all
Three Trees for the Bankster**-kings under the crimson sky,
Seven for the Corporate-Lords in their halls of stone,
Nine for Congressmen doomed to die,
One for the UN Lord on his New York throne
In Agenda 21 where Serfdom lies.
One Tree to rule them all, One Tree to find them,
One Tree to bring them all and into slavery bind them
In Agenda 21 where Serfdom lies.
—The Lord of Tree Rings, ClimAstrology
** International Banking Cartel
LOL! That must be quite a tree, huh?
http://www.photofurl.com/wp-content/uploads/2008/12/gold_tree_wallpaper.jpg
Mikey Mann has it sitting on his desk….
I so wanted to do a similar poem going on ten years ago when SM was putting this out live, blow by blow.
Is that yours Gail?
Yes, Stolen from Tolken of course:
Three Rings for the Elven-kings under the sky,
Seven for the Dwarf-lords in their halls of stone,
Nine for Mortal Men doomed to die,
One for the Dark Lord on his dark throne,
In the Land of Mordor where the Shadows lie,
One ring to rule them all, one ring to find them,
One ring to bring them all and in the darkness bind them
In the Land of Mordor where the Shadows lie.
It just fit too well to pas up.
I do like your version Gail….though i might suggest that the UN Lord is a puppet of the bankster kings. The Dark Lord that rules them has many names, Satan and Lucifer being the most common.
Snowleopard, I would hazard a guess that the house of Rothschild rules the Bankster kings although they could be just another front.
It is well established that CO2 affects tree rings, so why have the suthors ignored this?
Good point. Tree rings getting bigger in the 20th century might be entirely due to the CO2 stimulating plant growth, making the tree ring studies worthless even before the fraud.
Actually, Mann’s Hide the Decline was because they had to substitute thermometer readings for the last part of the graph. The trees would not cooperate.
New Comprehensive Map By Scientists Confirms Medieval Warm Period Was Real And Global, Climate Models FaultyBy P Gosselin on 23. December 2015 – See more at: http://notrickszone.com/2015/12/23/new-comprehensive-map-by-scientists-confirms-medieval-warm-period-was-real-and-global-climate-models-faulty/#sthash.KYunhWtt.yIpqbzpl.dpuf
http://kaltesonne.de/wp-content/uploads/2016/01/mwp-globe-1024×638.jpg
From – http://www.climatedepot.com/2016/01/12/study-globally-99-of-all-paleoclimatic-temperature-studies-compiled-show-a-prominent-warming-during-medieval-warm-period-mwp/
Red is hotter then vs now – Blue is colder then vs now.
DD More • a day ago
Europe seems to show few markers. Want to fill in some blank space, see 45 Level 1 quantitative comparison studies.
http://www.co2science.org/data…
Try Lamb 1965, p 26, fig 3, A – top graph.
IPCC seems to have extended the ‘smoothing’ in the early part of the plot. It’s a better fit with temps in the last few decades than Hansen.
Why is it assumed that earlier papers have it right? That seems ass backwards to me.
To be clear Lamb’s plot matches the last few decades in the IPCC 1990 plot better than Hansen.
The 1990 IPCC report matches Hansen, which covered England, California and Greenland. The 1990 IPCC report is marked “global” not England. If England happened to match the rest of the world, that is not surprising.
Hansen’s graph matches the 1990 IPCC report very closely.
The ‘global’ in the IPCC 1990 caption is belied by mention in pages 200 to 2003 of doubt that the MWP was global and synchronous. Obviously, there were no ‘global’ reconstructions in 1990, so the caption is misjudged. You can’t put those labeling pieces together (Hansen: Calif, Eng, Greenland – Lamb: England – IPCC: ‘global’), so the best way forward to to find plots that match, as you have attempted. Lamb fits better.
The worst way forward is to categorically announce that you have the correct source when there is no actual reference to verify.
Hansen’s plot is extremely sparse geographically, and cannot be considered representative of Northern Hemispheric, let alone ‘global.’ It’s still ass backwards to presume that earlier papers have it right on the MWP.
The 1990 IPCC report matched Hansen 1981 which shows England California and Greenland. If you think Hansen is lying, take it up with him and stop wasting my time.
Lamb matches closer – do an overlay. You’ll see. Why are you talking about Hansen lying? You categorically announced his plot is the IPCC 1990 source, based on an overlay, not on anything Hansen said. Buck stops with you, not him.
I get it. The IPCC was lying about it being global, and Hansen was lying about it being global. And you know the truth.
There’s an overlay here – the fit between Lamb 1985 (based on Lamb 1965) and IPCC 1990 is very good.
http://www.joabbess.com/2010/07/26/note-to-steve-mcintyre/
Hansen never said it was global – you located his plot correctly in the OP. The IPCC caption can’t be right – there were no global reconstructions. In any event the IPCC label does not say “California, England and Greenland,” so arguing about labels isn’t going to be very useful. Comparing plots is a better way forward.
You can’t possibly be as illiterate as you pretend to be.
They both match closely which indicates that both Hansen and the IPCC believed that England temperatures tracked global. That is why Hansen and the IPCC both said it was global.
At the end of the caption for Hansen’s graph (incl (b) ), this:
“Thus, the shapes of curves (b) and (c) are based on only Northern Hemisphere data.”
Not global.
IPCC does not specify data geographically, so the best you can do is match curves. Lamb matches better. That doesn’t mean that Lamb is the source, just that the fit is better (particularly the shape of the curve in the first few hundred years, already smoothed in Lamb’s papers, and the relative temps of the last few decades, where Hansen diverges more).
Whatever the actual provenance, you have no justification to claim with absolute authority that IPCC 1990 millennial reconstruction is based on Hansen ’81. Saying “possibly” would have been more truthful, if less titillating for your audience.
Let’s not waste either of our time by pointing at the word “global.” We have more information than that and no rational reason to ignore it.
STILL trying to re-write history I see.
Both graphs are labeled GLOBAL but Lambs is not.
Get over it!
Steve has helpfully linked the Hansen doc, so you can see for yourself. Steve forgot to mention the rest of the caption, which clearly states the data is from Northern Hemisphere only.
If this post and the argument behind it rests on pointing like a drooling idiot at the word global and ignoring where the data have actually been gathered then there’s not much more I can say. Good luck.
Barry, it was also clearly pointed out what the basis of the chart was. As it turns out numerous more recent reconstructions using SH data as well, support this far better then the flatlined Mann reconstructions, necessary for CAGW alarmism.
Judging a paper on when it was written is anything but scientific.
“Barry, it was also clearly pointed out what the basis of the chart was”
Indeed, which I mentioned to begin with. But I commented on that critically instead of lining up with the cheer squad, and then suddenly everything was ‘global.’ Because words.
“Judging a paper on when it was written is anything but scientific.”
Oh, I agree. Which I why I argued it’s daft to presume earlier papers had it right, and noxious to then accuse researchers of sophistry when later research has different results.
They will not be at all pleased to see you dragging up all their past “sins” Steve. To any normal ethical person this would be very embarrassing, but as Climatologists, they will just press ahead towards the next funding deadline.
” To any normal ethical person this would be very embarrassing”
Ah yes, because science is Real Science when nothing new is learned.
Barry knows better what the IPCC was thinking in 1990, than the IPCC did, and he also knows better what Hansen was thinking in 1981 than Hansen did. I’m surprised he didn’t win the Powerball with all that clairvoyance.
Another No Nothing making a complete fool of himself.
“Barry knows better what the IPCC was thinking in 1990, than the IPCC did, and he also knows better what Hansen was thinking in 1981 than Hansen did.”
I make no such claim. But you claim to know what I think. Classic projection here, and fine irony.
Hansen called it global. The IPCC called it global. Hansen’s graph closely matched the IPCC graph.
Barry has concluded from this that they were thinking it wasn’t global.
ntesdorf you have to forgive Barry. It seems he has gotten a ID# 10t input controller error on the computer keyboard.
But did you do know that when Gruber said
http://www.cnn.com/2014/11/14/politics/obamacare-voters-stupid-explainer/
he was talking about someone you now know?
We had a little of that there warming here today. After getting down to 5 deg F on Tuesday night and having about 6″ of snow on the ground, it warmed today up to 43 with bright sunshine and I now can see patches of green grass in my yard. I was thinking I might have to break out the beach balls and suntan lotion. But never fear come Sunday and Monday old man winter is going to reassert his dominance with another arctic blast and we’re forecast to hit -1 deg. F Sunday night. Glad I plugged the big trucks block heater in when I parked it Tuesday night.
As for the MWP. It happened and was wide spread and it doesn’t take proxy studies to confirm it. Recorded human history as revealed by archeology and research of records from China to N. Europe supports the fact there was a warm period that effected the use of water resources, agriculture, and spurred human migration.
https://sites.google.com/site/medievalwarmperiod/
http://www2.sunysuffolk.edu/mandias/lia/vikings_during_mwp.html
http://www.academia.edu/1243074/Effects_of_Medieval_Warm_Period_and_Little_Ice_Age_on_the_hydrology_of_Mediterranean_region
http://ruby.fgcu.edu/courses/twimberley/EnviroPhilo/WarmPeriod.pdf
And so on and so forth.
Always enjoy reading your posts Steve. I came across the following quote by Jon Rappoport today and thought of you. “Government science exists because it is a fine weapon to use, in order to force an agenda of control over the population. We aren’t talking about knowledge here. Knowledge is irrelevant. What counts is: ‘How can we fabricate something that looks like the truth?’ I keep pointing this out: we’re dealing with reality builders. In this case, they make their roads and fences out of data, and they massage and invent the data out of thin air to suit their purposes. After all, they also invent money out of thin air.” (The Underground, Jon Rappoport)
I knew about the Little Ice Age and the Medieval Warm Period when I was in high school in the ’60s
there’s been an uptic lately in the number of people trying to use Real Science to promote their own blogs…
Must mean Real Science is getting a lot of traffic!
Congratulations!!!
It isn’t as if the Medieval Warm Period was an questionable anomaly. It was preceded by the Roman Warm Period and the Minoan Warm Period each spaced roughly 1000 years apart. Following it at a similar interval we have the “Modern Warm Period” if you will.
There is clearly a quasi-millineal cycle here, as can be determined by historical crop records, ice cores, glacial extent, and in many other ways. The current warm period is the forth in a series that can be historically documented. This warm period now seems to be fading sooner and at lower temperatures that the previous warm period. Each one previous did likewise, continuing the cyclical cooling trend toward neo-glaciation.
How can anyone call themselves a climatologist and yet (pretend to?) be unaware of recent climate history/
““Modern Warm Period””
NO.. its should be called the Modern SLIGHTLY Warm Period”
Hansen Confirmed The MWP In 1981
Yes, yes. But give the man a break; he confirmed the MWP way before the word came that the MWP had to be erased. The
con-artists“scientists” had not yet realized that the past warmer times would harm their big, scary, tall tales.And mothers used to tell children that liars never prosper!
So DMI it seems has effectively dumped the 30% ice extent graph http://ocean.dmi.dk/arctic/old_icecover.uk.php
Looks like it pretty much ended as of the end of last year.
It was too embarrassing for the ClimAstrologists. Besides the 15% unmasked has a lot more uncertainty in measurement and is therefore much more easy to fudge. The 15% is also a lot more subject to wind and ocean current. The 30% gives a better idea of the core ice that remains year after year so it really did have to go.
In the end the ice will win no matter what they say, or try to hide or obfuscate and DMI by stopping the plot are providing less information on ice and thus not fulfilling their states mission a completely as they could be.
RAH,
I think they just have to keep up the lies for a little while longer until Hitlery or Bernie is in the White House then it is a completely done deal.
As we all know once a law is in place you can not remove it with an atom bomb no matter how much damage it does. And so we Progress towards a pure totalitarian state.
Steve McIntyre thinks IPCC 1990 MWP schematic is based on Lamb 1965.
http://climateaudit.org/2008/05/09/where-did-ipcc-1990-figure-7c-come-from-httpwwwclimateauditorgp3072previewtrue/
Though, I’d like to see Lamb’s 1988 document, as it is referenced in the IPCC caption for that MWP graph.
“The period since the end of the last glaciation has been characterized by small changes in global average temperature with a range of probably less than 2°C (Figure 7.1), though it is still not clear whether all the fluctuations indicated were truly global….
The late tenth to early thirteenth centuries (about AD 950-1250) appear to have been exceptionally warm in western Europe, Iceland and Greenland (Alexandre 1987, Lamb, 1988) This period is known as the Medieval Climatic Optimum China was, however, cold at this time (mainly in winter) but South Japan was warm (Yoshino, 1978)
(Note the reservations about the schematic being a global representation)
Couldn’t find Lamb ’88 on the web. Maybe someone else will have better search skillz.
Lamb 1988 is entitled: Climate and life during the Middle Ages, studied especially in the mountains of Europe
… if anyone wants to try and find an electronic version.