
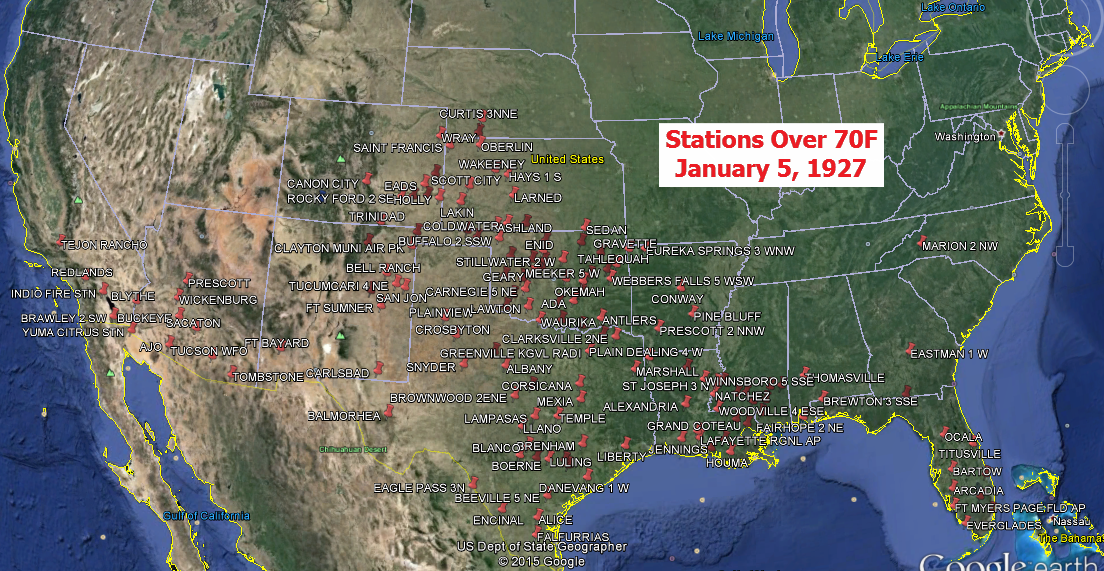
January 5, 1927 was a remarkable day. Much of the Great Plains were over 70 degrees, and Liberal, Kansas reached 85 degrees. Temperatures in Texas reached 89 degrees. Liberal is forecast to reach 47F today, and a major cold blast by the weekend.
CO2 was 305 PPM at the time.

https://coloradowellington.files.wordpress.com/2016/01/city-of-liberal.png
[fourth try]
Only Americans have permitted religious conservatives to distort the meaning. In England, Canada and Australia, liberal still means closer to laissez-faire than teetotalitarian. The American Liberal Party put relegalization of beer on its 1931 platform, so the Dems had to follow suit or lose in 1932.
Progressives soil their ‘brand’ and then have to steal another ‘brand’ with a good reputation
Thus Fascism (which Bill Clinton whole heartily supports) becomes The Third Way. Socialism/Communism becomes Progressivism and then liberalism.
Now they are stealing the good name of NASA build up by a generation of real scientists and engineers to hide their latest grab for power and wealth.
Unfortunately they are very good at hiding the wolf under their latest sheepskin.
Hi Gail, Just popping by to update you with the latest data, so you can correct your files:
Latest data shows cooling Sun, warming Earth
http://www.skepticalscience.com/Solar_temp_update.html
Gail, our little needy troll demands your attention …
https://coloradowellington.files.wordpress.com/2016/01/troll-pay-attention-to-me.jpg
I would urge all readers to visit the link to Skeptical Science that is posted above. One of the better things to read is the small pop-up window defining “heat”. It says, “Heat — The energy transferred by an action of heat transfer.” Great circular definition! It also speaks about “the heat output of the Sun” conflating radiation (photons) and heat (kinetic energy). Most importantly it seems to think that total radiated energy received by the Earth is the only variable. It seems oblivious to the fact that when the Sun’s radiation changes how it is distributed over the spectrum, there are changes in how and where it is absorbed. “UV? IR? Visible? It’s all the same!” I am continually amazed at how narrow their understanding is.
Latest data shows cooling Sun, warming Earth
====
they erased the pause
“they erased the pause”
Yes, they have the known-bad chart that mixes bad data with better data. “Look! The pause is gone! All we had to do was corrupt the data!” On the other hand, the Sceptical Science crowd will never notice. They are not sceptical, and they darn sure are not scientific.
Jason, SkS write their propaganda to match the low-intellect of their main viewers.
There is very little actual science there and what there is, ia so overpowered by their rabid propaganda beliefs as to make separating the small amount of actual science, (which is mostly low-end child-like understanding and very error prone), from the BS basically impossible.
Its designed for people like Martin.. the child-minded, brain-dead zombie followers.
Most importantly it seems to think that total radiated energy received by the Earth is the only variable.
“Most importantly it seems to think that total radiated energy received by the Earth is the only variable.”
They forget chemistry completely.
Solar Radiation: Sources of Energy for the Earth’s Atmosphere
(wwwDOT)nasa.gov/mission_pages/sdo/science/Solar%20Irradiance.html
***************************
Solar Radiation – – Energy Flux – Solar Cycle Change – Deposited
TSI mostly Vis & IR – 1366 W/m2 – 1.2 W/m2 – 0.1% – Surface
MUV (200-300 nm).- – 15.4 W/m2 – 0.17 W/m2 – 1% – 15-50 km
FUV (126-200 nm) – – 50 mW/m2 – 15 mW/m2 – 30% – 30-120 km
EUV (0-125 nm) – – -10 mW/m2 – 10 mW/m2 – 100% – 80-250 km
***************************
Ultraviolet light creates and destroys the ozone layer depending on the wavelength so the changes listed in that chart matter. A shift in the ratio will shift the amount of ozone created vs that destroyed. Ozone production is driven by UV radiation of wavelengths less than 240 nm. Ozone is a highly unstable molecule so when it absorbs low energy UV (240–310 nm) it splits into an ordinary oxygen molecule and a free oxygen atom.
http://www.oxidationsystems.com/products/ozone_formation.GIF
http://www.oxidationsystems.com/products/ozone_wavelength.GIF
In the three decades prior to the 2009 solar minimum and the switch to a ‘quiet sun’ (1979 to 2009) the amount of ultraviolet (UV) radiation reaching Earth’s surface increased markedly. This energy would be absorbed by the oceans at depths up to 100 meters.
I had a link to a paper on the absorption of different frequencies of UV into sea water… darned if I can find it, :-(.
But I vaguely remember that there were big differences even in the 320-350nm range.
What that would imply would be that the spectrum changes in UV reaching the Earth can make a significant difference to ocean warming.
Which is basically what Gail is saying.
Hi Gail,
You really shouldn’t post stuff with scientific notation, numbers & colored bits, poor Martin will be getting very confused & may get a nose bleed & it will be ALL YOU FAULT.
You must remember he’s only used to the cartoons from the SKS Cook shop.
Dang it saveenergy, now I have to clean my keyboard and screen again.
Martin-
Why do you believe your cartoonist over the IPCC? Their latest report lists solar irradiance as increasing:
http://1.bp.blogspot.com/-akM6XUKZ7SY/UlgbW7pQeoI/AAAAAAAADts/nMXzPe7feCs/s1600/FigTS-7.gif
Small, but definitely positive. And it’s about the only directly measurable variables in the whole climate discussion, so accuracy is exceptionally high.
Martin Smith …
when I first started reading on this subject about 2 years ago, Sks was the first site I read
and couldn’t believe how incredibly dumb and intellectually dishonest it was.
Sks turned me into a denier.
No fossil fuel Koch brother propaganda was required.
It’s really cold here today.
I could really use some of that 3 gazillion atomic bombs of heat right about now.
.
Rebel, do you think Big Oil paid SkS to turn visitors into deniers and after they showed good results to send missionaries like Martin Smith to other sites?
Ted, you have to provide a reference to your source, including a link to the graph, or at least something that allows me to check what you have posted. In this case, it certainly looks like the quantities in the graph don’t mean what you think they mean. No one is saying the sun has stopped warming the earth. It looks like your graph is showing the relative magnitudes of the forcings in watts per square meter.
rebel, I don’t know what to say but: You completely misjudged the quality of SKS. Because I have to choose between your opinion of SKS and the opinions of well respected climate scientists, like Stefan Rahmstorf and Gavin Schmidt, and statisticians like Grant Foster. Why would anyone choose to believe your opinion over theirs, especially when a quick perusal of the SKS resources proves you don’t know your ass from 3rd base?
… well respected climate scientists, like Stefan Rahmstorf and Gavin Schmidt…
You mean this Gavin Schmidt? The squirming, sweating, stuttering worm that refused to debate Dr Roy Spencer? The weasel that could not stand up to a “denier” and save the planet? 😆
https://www.youtube.com/watch?v=V96k4BO2sBw
Poor Marty.. it is your moronic dependence on climate fraud and comedy site that is SkS that makes you come across as such a moronic, ignorant, brain-washed little twit.
And you are so, so dumb that you don’t realise it.
“like Stefan Rahmstorf and Gavin Schmidt, and statisticians like Grant Foster.”
Looks like Marty has been cleaning out a birdcage again.
Martin-
“Ted, you have to provide a reference to your source, including a link to the graph, or at least something that allows me to check what you have posted. In this case, it certainly looks like the quantities in the graph don’t mean what you think they mean. No one is saying the sun has stopped warming the earth. It looks like your graph is showing the relative magnitudes of the forcings in watts per square meter.”
I’m sorry. I forgot there are children here, who need their hands held constantly. Everyone here but you recognizes that chart from IPCC AR5, WG1. It’s figure TS-07, on page 54. Of course, it helps that the rest of us have actually read the IPCC reports, instead of having the Cliff Notes read to us a cartoonist. Of course, the oval and flashing red arrow were added to get your attention, because you’ve demonstrated ad nauseam that you’re incapable of reading a basic chart.
Do you really believe that the total energy provided by the sun is in the 0.05W/m2 range? Do you really believe that CO2 warms the earth 33 times as much as THE SUN? Is that really what you’re trying to tell us, you blithering idiot? The chart is showing the CHANGE in the amounts of each forcing, from 1750 to 2011. Note that, while small, the number for solar irradiance is positive. For those of you too stupid to understand three syllable words, positive means “bigger.”
You’re making a fool out of yourself. Either read SOMETHING, or shut the fuck up.
>Do you really believe that the total energy provided by the sun is in the 0.05W/m2 range?
No, Ted, I don’t. That;’s why I asked you to provide a proper reference for your graph. I can’t determine what the graph represents. You simply can’t expect me to take your word for anything after your ad hominem attacks in your replies to me. Until you provide a proper source reference for your graph, it remains meaningless.
This graph proves your claim is wrong: http://www.skepticalscience.com/Solar_temp_update.html
It provides proper link references to its data sources, so you can fact check it yourself. Do you see the difference? My source can be validated, you don’t even provide a source.
Martin-
So my claim stands. You’ve just explicitly rejected the IPCC as a reference source. I even told you the page the chart is on. I’m not aware of any way to link to it directly, as it’s in a PDF. You can download the PDF here:
http://www.ipcc.ch/report/ar5/wg1/
It’s in the technical summary, 18.1MB.
Calling you a blithering idiot is not an ad hominem attack, when you’re STILL blithering.
READ THE FUCKING MATERIAL BEFORE YOU LIE ABOUT WHAT IT SAYS.
I’m by no means the biggest fan of the IPCC, but I still trust their reports more than I trust your SKS cartoonist. Where, exactly, is HE getting his information? Are you telling us he’s calling the IPCC liars too? Or are you just completely lost regarding what your cartoonist actually says, AGAIN? Can you at least try to get your own story straight?
It was progressives who called themselves liberal, that started this mess. Just look up the Fabian coat of arms, and you will see what I mean. It was the religious of this country that created our Constitution and Bill of Rights.
control the language
Thats why I posted the Fabian coat of arms below gator. It certainly should give anyone with a thinking brain pause. Unfortunately that leaves out about 80% of the population…
https://infrakshun.files.wordpress.com/2014/05/fabian-socialist-wolf-in-sheep-clothing.jpg
Change is not necessarily progress and that simple concept is one which apparently lost on many.
Here is a nice speech concerning the recent goings on in Oregon from Tiffany Taylor, a Constitutional Lawyer. If the so called “liberals” and “progressives” were truly about empowering the people they would agree with every word this woman says but in fact they are opposed to about every concept she lays out here.
https://www.facebook.com/tiffany.house.96/videos/1070795146273987/?theater
Huh? Gail and Gator beat me to it, oiltranslator.
Yours is a novel view that I haven’t heard before and I’m afraid you will not find many self-identified libertarians among the commenters here who share it.
The Progressives, Socialists, Commies and other assorted pinkos stole the term “liberal’ when their original names became detested by too many Americans. They similarly subverted the English language with the corruption of dozens of other key terms.
Their opponents, including religious conservatives, can be at most blamed losing the battle of language but certainly not for this assault on language, reason and common sense.
Many years ago a Denver paper printed this headline:
“Colorado Senate Liberals Oppose Liberalized Gun Law”
Unless there was a provocateur at the paper that used the headline to highlight the lie of Leftists calling themselves “Liberals” it was a typical “liberal” MSM writer who didn’t even get the irony and certainly didn’t use the term to please religious conservatives.
Here is what I wrote about last year:
https://stevengoddard.wordpress.com/2015/02/12/learning-to-be-a-wind-farm-promoter/#comment-490734
——————————
Edits:
… can be at most blamed for losing the battle of language
… what I wrote about it last year
I normally call them Progressives or Fabians.
No matter what you call them. They are wolves hiding under the sheepskin of ‘kindly motives’
https://infrakshun.files.wordpress.com/2014/05/fabian-socialist-wolf-in-sheep-clothing.jpg
From this window
https://infrakshun.files.wordpress.com/2014/05/fabianwindow_large.jpg
It was installed at the London School of Economics with great fanfare, British Prime Minister Tony Blair officiating and Bill Clinton in attendance.
It was designed by Fabian Society co-founder George Bernard Shaw. It shows Sidney Webb and Shaw striking the Earth with hammers smashing it to “REMOULD IT NEARER TO THE HEART’S DESIRE,” a quote from Omar Khayyam. The wolf in a sheepskin can be seen as the Fabian crest hovering above the globe
Is that Martin Smith third from the right on his knees on the bottom of the window?
Why don’t we just call them WTF they really are? SOCIALISTS! And there are a considerable number of so called Republicans that are exactly that also. I’m so tired of them using BS tags like “Liberal” or “Progressive” when they are NEITHER.
They are SOCIALISTS plain and simple and anyone that would take the trouble to actually look the terms up in a dictionary would see that.
They are neither tolerant nor accepting of other views and so are most certainly not liberal. They do not support individual freedom unless it has to do with sexual subjects or abortion. They in fact do everything they can to instituted policies which give more power to the government over the individual in almost every realm and will ethically debase every institution that stands in the way. For example a true progressive would be a staunch backer of the scientific method. A true progressive would fight to prevent a level of debt that is damaging to the nation and it’s citizens. A true progressive would actually define political progress as that which allows the individual the greatest freedom to meet their potential to better themselves and contribute to the advancement and success of their society and demand that individuals given that opportunity strive to contribute and not just appease the masses by throwing the occasional loaf of bread as these people do.
A good friend of mine was once fooled by the progressives, and he said to me, “I’m for progress”. Then I explained they do not call themselves progressives because they want progress, they call themselves progressive because they are progressing towards a goal of socialism. Progressives brought us Prohibition, they have been around since the Civil War, and their ideas are anything but new.
Here is Fabian Socialism aka Progressivism straight from the pen of one of the co-founders. This is what the Socialists/Progressives/Democrats are ‘progressing towards’ — a completely enslaved world population.
This the Wolf hiding under the sheepskin that Martin Smith is so busy defending. — You reading this Marty? Is this the world you really really crave?
Sure sounds like slavery to me with no hope of being a free person.
Here is Shaw praising Hitler.
https://www.youtube.com/watch?v=hQvsf2MUKRQ
And don’t forget the Eugenics part that is also embraced with enthusiasm by the Webbs, the other co-founders of the Fabian Society.
From the Groniad no less: Eugenics: the skeleton that rattles loudest in the left’s closet, Socialism’s one-time interest in eugenics is dismissed as an accident of history. But the truth is far more unpalatable
Again from Shaw
And yes Eugenics is still the goal. (Hillary Clinton’s heroine, Margaret Sanger was all for exterminating blacks and the unfit.)
UK Doctor Admits To Starving Babies To Death, Using ‘End-Of-Life’ Care
And if you think the Liverpool Care Pathway is just in the UK think again.
Jane M. Orient, M.D.
Withhold food and water, sound familiar?
Now think of Obamacare with its panels who will decide what medical treatment you are ALLOWED. Yes ALLOWED. Our doctor wanted to have certain tests done on my husband but the directive from on high said NO! A directive from someone who never met or even knows my husband’s name and isn’t even a doctor. It is called the Independent Payment Advisory Board.
Welcome to the Socialist Utopia where the slogan is:
Kittens. Puppies, Babies? Whats the difference. We Kill them all!
{liberal (adj.) “generous,” also, late 14c., “selfless; noble, nobly born; abundant,” and, early 15c., in a bad sense “extravagant, unrestrained,” from Old French liberal “befitting free men, noble, generous, willing, zealous” (12c.), from Latin liberalis “noble, gracious, munificent, generous,” literally “of freedom, pertaining to or befitting a free man”} + {re·tard
verb, ri?tärd/ 1. delay or hold back in terms of progress, development, or accomplishment.
“his progress was retarded by his limp”} = “Libtard” 😉
Jason Calley writes
So you are basically saying that TSI on its own cannot explain climate fluctuations on earth which is interesting because most of the solarphiles claim there is a correlation between TSI (or TSI proxies) and various cool/warm periods in earth’s history. I don’t think there is one. I think the solar/climate link is bunkum. You also appear sceptical.
Variation in solar wavelength matters along with other variables. Constant TSI is just a red herring tossed out to divert the lazy brain dead couch potatoes from thinking about the sun as a climate driver. SEE: A History of Solar Activity over Millennia
Changes in UV/EUV which turns out to be highly variable, effects the chemistry of the Atmosphere causing changes in NOx and Ox.
http://www.oxidationsystems.com/products/ozone_formation.GIF
Ozone changes the temperature of the stratosphere
http://www2.sunysuffolk.edu/mandias/global_warming/images/stratospheric_cooling.jpg
So more UV hit the surface which is 70% water and heated the oceans at dept.
http://www.john-daly.com/sverdrup.gif
If the Solar Wind drops the cosmic rays increase ===> increase clouds?
As Dr. Joan Feynman et al said
Hey John Finn! “So you are basically saying that TSI on its own cannot explain climate fluctuations on earth which is interesting because most of the solarphiles claim there is a correlation between TSI (or TSI proxies) and various cool/warm periods in earth’s history.”
I am probably guilty of being a bit too brief on my comment above; I was referring specifically to the linked article and how it was pointing out a relatively constant TSI without even mentioning that there are variations in how that radiation is proportioned among the various wavelengths. But to answer your question, no, I do not think that TSI on its own can explain climate fluctuations. TSI is part of the reason but not all of it. I do see a correlation between TSI and climate, but there is nuance involved. It is really easy for any of us to fall into the habit of false dichotomies; “the cause is X or the cause is Y.” The truth (as near as I can tell!) is much more complicated. Climate is influenced by TSI, and by solar radiation distribution, and by CO2, and by H2O, and by solar magnetic field, and by cosmic rays, and by tidal forces (both solar and lunar), and by solar wind changes associated with sunspots, and by axial precession, and by precession of Earth’s perihelion, and by plate tectonics, and by ocean salinity, and by biological effects of plankton and land plants, and by ocean current changes, and by volcanic eruptions, and thermal inertia of the oceans, and cloud variations, and overall albedo changes, and, and… The list can go on and on.
The climate of Earth is perhaps the most complex system that we poor humans have ever tried to figure out. To make matters even more difficult, we are dealing with a system which we know is chaotic — so long term changes are simply not predictable, even if they are deterministic. We know that there are some climate states that are more stable and more common than others, but there is no way to be certain what is going to happen. There are, no doubt, some causes that are much, much more important than others. TSI (and spectral changes) and solar magnetic fields seem like a big ones. I think that lunar influences and tidal effects are really important as well. The big question is “what about CO2?” In my opinion, probably not so big. If our planet did not have such a huge amount of water in the atmosphere, then CO2 would be much more important. As it is, the amount of H2O in the atmosphere is about 2 orders of magnitude greater than the CO2 and there is a large overlap in their respective absorption lines — meaning the while CO2 may be important once you get above the troposphere, down here on the surface, it is pretty well overwhelmed by H2O and convection.
Well, those are my thoughts on it. I hope that clarifies what it looks like to me, anyway.
Gail Combs
You’ve linked to 2 studies – one of which is nearly 18 years – both of which rely on obsolete solar data. Leif Svalgaard and colleagues have provided compelling evidence using multiple lines of evidence that the sunspot count in previous centuries (including the early 20th century) was significantly under-estimated. Basically the mid-20th century solar activity was not appreciably different to that in the mid-19th and mid-18th centuries.
Even leaving those issues aside, We’ve had the best part of 20 years since Jane Feynman’s statement about the decline in solar activity helping to disentangle the solar effects from ghg effects. The solar effect appears to be very little.
Incidentally could you link the cosmic ray count (Oulu). We’ve seen some increase in CRs but no reduction in global temperature. To the contrary, there is a fair chance both UAH and RSS will measure record highs in the coming year.
Gail, congratulations you’ve managed to include every crackpot solar theory into a single comment. .
Speaking of Crackpots Finn….
WOW, What a GREAT Argument from Intimidation!
(Notice that he can not actually refute what I have said or more importantly what Ilya G. Usoskin of the Geophysical Observatory Oulu unit says BACKED by verification from different data sets.)
As far as Svaalgaard goes, he is from the same University of that crackpot Paul Ehrlich known for his 100% record of being wrong. However Ehrlich and Svaalgaard have nothing to do with science or being right. It is ALL about supporting the Cause™
The solar data set was the only outstanding data set that had not been tampered with.
The Revisionists diddled with the ice core and historic CO2 measurements to get rid of pre-industrial ice core measurements from whole crushed ice that indicated that CO2 concentrations were up to 2450 ppm and wet chemistry historic measurements had values up to 550 ppm. link
The Revisionists diddled with the temperature record to lower the past temperatures and increase the present temperatures as Tony Heller, E.M. Smith, Verity Jones, Frank Lanser, Jo Nova and many many others have shown.
The Revisionists diddled with the sea level data as I and Steve case and many peer-reviewed papers show.
And now L.S. and his buddies have finally gotten around to diddling with the solar record to squash it flat.
Seems the Revisionists know darn well IT’S THE SUN STUPID! and are doing their darndest to hide the fact.
A History of Solar Activity over Millennia. Does a nice job of refuting the solar revisionists.
As does the New paper confirm[ing] the Sun was particularly active during the latter 20th century “The authors (M. Lockwood, L. Barnard, H. Nevanlinna, M. J. Owens, R. G. Harrison, A. P. Rouillard, and C. J. Davis) strongly object to the solar activity reconstruction of Svalgaard and Cliver, as well as Svalgaard’s criticisms of their paper as a reviewer” (2013) Looks like I am in good company.
And even funnier in August 9, 2014 Svalgaard has revised his reconstruction of sunspot observations over the past 400 years from 1611-2013. and shows the sun, along with the oceans, controls the temperature. (Snicker)
http://2.bp.blogspot.com/-wLCEUB9Aw28/U-cGLCEaBPI/AAAAAAAAGMQ/NAl4KtFKmog/s1600/sunspot+integral+2.jpg
Climate Modeling: Ocean Oscillations + Solar Activity R²=.96
” However Ehrlich and Svaalgaard have nothing to do with science or being right. It is ALL about supporting the Cause™ ” .
I can’t speak for Ehrlich who I believe is generally wrong but, I do know for a fact that Svalgaard DOES NOT SUPPORT THE PROPOSED GHG MECHANISM for global warming.
The problem with you people is you think that anyone who doesn’t support your disproven, outdated notions on a solar/climate link must, by default, be a proponent of CAGW. In fact, you’ll get a lot of support from warmers for a strong solar effect since they rely on it to explain the pre-1940 warming. The old solar reconstructions offer more support to their side of the argument than they do for the sceptics.
The solar link is a busted flush. Solar activity peaked in the mid-20th century and has been in decline since at least 1991 (25 years). Temperatures have not declined since 1991. No doubt you’ll bring up the lag. That’ll be the lag that started off at 3 years but now appears to extend to anything up to 50 years.
Several years ago James Annan (a warmer) bet 2 Russian solar scientists $10000 that the mean temperature for 2012-2017 would be warmer than for 1998-2003. The Russians predicted 2012-2017 would be colder. They are going to be badly wrong. It’ll be that ‘lag’ again. The “lag” that didn’t show up when the “clear” correlations between solar activity and climate were being analysed.
Airy-fairy nonsense.
Annan made a bet in 2011 with Doctor David Whitehouse that the Met Office temperature would set a new annual record by the end of the year. Annan was declared to have lost on January 13, 2012.
https://en.wikipedia.org/wiki/Scientific_wager
And of course it all boils down to who does the “measuring”.
It is difficult to look at comparisons of raw data versus adjusted data without remembering the famous quote usually attributed to Stalin: “Those who vote decide nothing. Those who count the vote decide everything.”
It is much, much more than a safe bet that the grantologists will make it appear that the globe is continuing to warm. It’s like betting that Baptists will still be Christians in five years. That anyone would take these bets seriously is actually quite amusing.
Betting on an annual average global temperature (a statistic about a statistic about a statistic about…) is a dangerous thing to do if you are relying on something like GISS (especially GISS) for an answer. How about this, gator? Let’s bet $20 a toss on a series of coin tosses. Oh, and by the way, you can toss the coin, but I am the only one who gets to look at it and report the results. What could be more fair? 🙂
Or you could take another page from the alarmist handbook, and wait until after the flip to claim that whatever side came up was what you had predicted all along. Heads you win, tails I lose.
Finn, you believe what a grantologist like Svaalgard says??
The New York Times: The Conversion of a Climate-Change Skeptic
“I was never a skeptic” – Richard Muller, 2011
“If Al Gore reaches more people and convinces the world that global warming is real, even if he does it through exaggeration and distortion – which he does, but he’s very effective at it – then let him fly any plane he wants.” – Richard Muller, 2008
“There is a consensus that global warming is real. …it’s going to get much, much worse.” – Richard Muller, 2006
“Let me be clear. My own reading of the literature and study of paleoclimate suggests strongly that carbon dioxide from burning of fossil fuels will prove to be the greatest pollutant of human history. It is likely to have severe and detrimental effects on global climate.” – Richard Muller, 2003?
So there is Richard Muller, lying and SAYING he is a skeptic.
SO explain to me again WHY I should believe that Svalgaard, who ONLY shows up at WUWT to bash anyone who says the sun influences climate, is not a grantologist, guarding that aspect of the CAGW fairy tale. Just as Englebeen ONLY shows up at WUWT to defend the CO2 record and Zeke Hausfather shows up at WUWT to defend the temperature record.
Svalgaard just not as stupid as the others who leave foot prints all over the internet.
What a ridiculously idiotic rant which seems to involve a gripe against Richard Muller who has far as I can recall hasn’t been mentioned before in this thread.
I believe whatever the evidence tells me to believe. Svalgaard’s evidence for a relatively invariant sun is compelling. He cites several lines of evidence which are impossible to argue against.
Similarly, Ferdinand Engelbeen’s position on CO2 levels is faultless. I believe there are still some people who think the higgledy piggledy Beck reconstruction which uses CO2 readings from all sorts of divers locations is valid. It’s quite laughable really.
I’m not familiar with everything that ZekeH has done but I’ve no reason to doubt his reconstruction of the temperature record. Do you? and if so could tell us what it is and produce your own reconstruction.
Your freely toss around the term “fraud” when you’ve actually no idea what you’re on about. Apparently, anyone who disagrees with your world view is guilty of fraud.
I’ve been looking at the subject of climate change for more than 10 years and I can only think of 2 cases which I would describe as deliberately misleading, i.e.
1. The Hockey-Stick. In 2004 on the Realclimate blog I challenged Michael Mann about the use of the thermometer record readings for the last few decades of the reconstruction. In other words I was probably the first person to raise the issue of the “hide the decline”
2. Don Easterbrook’s nonsensical projections of future temperature change due to a cool PDO since 1999. As far as I can tell, Easterbrook grafted the satellite anomalies on to the surface temperature anomalies to support his PDO driven cooling projections.
I am what you might call a true sceptic – unlike most others who comment on these blogs.
Wow! A whole ten years, you must know everything.
Some of us actually studied climatology at major universities 30+ years ago, and have been studying ice ages for 40+ years.
No wonder you buy Zeke’s garbage.
Gator, it is pretty obvious that Finn has never heard of ‘Controlled Opposition’ and has a real big appetite for porcine, bovine and caprine feces. It is also obvious he didn’t look at the links or realize Muller, who conned Anthony Watts, is just another example of the lying conmen that surround and infest WUWT.
If he has ‘studied’ CAGW for 10 years it has been at the feet of such people as Mikey Mann and done with blinders. However I think he is just another Muller. A Propagandist masquerading as a sort of skeptic. The Good Lord knows the internet is littered with them.
” Ferdinand Engelbeen’s position on CO2 levels is faultless. I believe there are still some people who think the higgledy piggledy Beck reconstruction which uses CO2 readings from all sorts of divers locations is valid. It’s quite laughable really.
I’m not familiar with everything that ZekeH has done but I’ve no reason to doubt his reconstruction of the temperature record. Do you?”
My goodness you are unbelievable!
Ferdinand Engelbeen’s position is NOT faultless. I have poked holes in his position, Richard Courtney has poked holes in it, Lucy Skywalker, David Middleton, Anna V, to name a few lay people not to mention Dr Glassman who calls Engelbeen ‘a gadfly’ Dr. Segalstad, Dr Jaworowski, and Dr. Hartmut Frank among others have shown Engelbeen to be chuck full of B.S. What Engelbeen is good at is twisting words not communication of actual science.
As Far as Zeke Hausfather goes, I have torn his reasons for ‘adjustments’ to shreds here at Steven Goddard’s a number of times as has Steven. So yes, do have SEVERAL reasons to doubt BEST and I did not take Steven’s word for it I did my own digging and uncovered so much muck I needed hip boots.
Gail! You’re falling behind! This isn’t like you. Did you run out of graphs?
Let’s go! chop chop!
“To the contrary, there is a fair chance both UAH and RSS will measure record highs in the coming year. ”
Sorry little Finn,
But the El Nino looks like it is subsiding…..
So there is very high probability that your comment will make you look like a fool.
Do you post on SkS and get your comments passed without “adjustments”?
That would explain things.
“Gail! You’re falling behind! This isn’t like you. Did you run out of graphs? ”
Yet another SERIOUSLY MORONIC post from the goreboy.
Marty, I had something much more important to do that try to stuff information in your head — shovel sheep shit.
http://cdn.modernfarmer.com/wp-content/uploads/2015/05/Manure.jpg
And horse.
Thanks for this reminder of the natural variability of weather in the great plains.
It is 19 degrees in New York, which is 20 degrees below average.
Where is Betty Midler to complain about global warming
And according to accu weather it is projected to be 15 to 20 below normal all of January
I really really did not want to hear that. The first of my lamb crop was born a couple days ago. At least lambs do better in the cold than goat kids do. The goats are VERY unhappy with this switch from the 60s to below freezing. I worry about pneumonia with a major temp switch like that.
http://herb.linkrealms.com/packgoats/uinta_rain/rain_05.jpg
UNHAPPY
http://www.capricorngoatscheese.co.uk/userfiles/image/capricorn/British_saanen_breed.png
HAPPY
Gail C, the above goats plus the stained glass window prove that you are much more erudite than I had assumed. Highest regards, despite your previous erroneous rant against me personally. Forgiven, as you had obviously not read my 3 ebooks.
My milk cows get similarly unhappy when Wisconsin winters turn bad. Which is why we have built huge cow sheds over the last decade as we expanded, with roll down drapes if it gets really bad. Which it always does, sometimes. Milking 150, maintaining twice that ( given lactic rotation), plus another 100-150 steers depending on price/age. Right now we are selling steer calves at 2 days old, $450 each, to rebuild depleted Nebraska beef herds. You want a dairy hefer for Texas, fugettaboutit.
The South Dakota blizzard of October 2013 that wiped out 75,000 head certainly didn’t help the livestock industry any. The article said at least 5 percent of the roughly 1.2 million cattle in the western third of South Dakota likely perished. It started with heavy rain soaking the animals and then switched to snow. Some areas recorded almost 5 feet. For livestock that is a real killer. Even for woolly sheep.
We have sheds for all our animals even though we are in mid North Carolina and rarely get snow. It is the 32F with rain/sleet and a high wind that I worry about. Also the switch from 60F down to 20F (the temp now.) At least it is not raining.
If I was abrupt and sarcastic it is because I am very worried that the criminal in DC are going to wipe out the USA as a country and so many only look at the goodies being handed out or the fear being whipped up and never see past the current.
By the by did you ever read:
Shielding the Giant: U.S. Department of Agriculture’s `Don’t Look, Don’t Know” Policy
History, HACCP and the Food Safety Con Job
And E.M. Smith’s
“Evil Socialism” vs “Evil Capitalism”
Those three changed my opinion of the US government and our representatives especially when my Senator, Bob Burr, deliberately lied saying he did not support the Food Safety Modernization Act to get my vote and then turned around and co-sponsored the bill that hands control of US agriculture to the World Trade Organization.
OT, but the number of fools opting to pay extra from “green energy” in Australia is dropping sharply.
Green Energy really is a waste of time, and a detriment to society and the environment.
http://joannenova.com.au/2016/01/australians-dont-want-to-pay-more-for-green-power-what-was-a-pitiful-1-of-the-grid-shrank-by-half/#comment-1776097
The rank and file in the USA are not about to haul out their wallets either. (Only 26% are willing to pay $300/year or more and only 6% ready to spend $1,000 and up.) But it does look like the constant bath of propaganda is having an effect.
June 04, 2015 Are Voters Willing To Pay to Combat Global Warming?
This is the typical YOU have to change not me mentality seen in progressives.
April 22, 2015 Americans Still Unwilling To Save Environment With Their Wallets
August 13, 2015 …voters still put job creation ahead of the fight against global warming and don’t blame their fellow Americans for worrying about the economy first.
Looks like the switch in propaganda tactic is working…
May 09, 2014 Fifty percent (50%) of Likely U.S. Voters believe global warming is causing more extreme weather events in this country,Thirty-five percent (35%) disagree
On the good news side, US voters think banning free speech is a no-no and that Obama should not go around Congress.
July 09, 2014 Only 20% Think Debate About Global Warming Is Over
I like Rasmussen Reports because they use to make the questions available and I never saw any shading of the questions to get the ‘right answers’. Now you have to be a Platinum Member, ( $20/mo or $200/yr) but in a tightening economy I can’t blame them.
Massive cold waters in the southern waters and a large blob of cold water south of the el nino?
http://weather.unisys.com/surface/sfc_daily.php?plot=ssa&inv=0&t=cur
Interesting the Antarctic Circumpolar Current is 2 to 4 C below normal.
The Antarctic Circumpolar Current is the current that I think is a main driver of weather. In this map you can see how it influences all the ocean basins.
http://oceanmotion.org/images/surface_current_map.jpg
The amazing Antarctic Circumpolar Current “…The world’s oceans all converge into one circular channel which drives the meridional overturning circulation mixing oceanic global water….”
http://clivebest.com/blog/wp-content/uploads/2012/10/Circulation.png
Interesting charts of El Niño going back to 1867 (Click on charts for expanded view.
Come to think of it that 2015-16 El Niño is looking rather anemic considering all that cold water surrounding it.
January 2016
http://weather.unisys.com/surface/sst_anom.gif
Here is the 1997-98 El Niño
World Meteorological Organization
http://www.wmo.int/pages/prog/wcp/wcasp/images/El-Nino-1997.jpg
NOAA
http://ww2010.atmos.uiuc.edu/guides/mtr/eln/gifs/rcnt1.gif
UAH Global for December is now in, +0.44, up a bit as expected from the El Nino
2015 ends up in THIRD place below 1998 and 2010.
What 2016 does will depend totally on how long the El Nino lasts, and how much effect it has.
Some are predicting the “spike” in Jan, Feb, Mar, then a decrease,
others are suggesting it will be longer but flatter El Nino
Whatever happens, by the end of 2016, the following La Nina should be starting to bite.
Next winter could be quite chilly for you northerners. !!
I hope your electricity supply systems can cope
(especially UK, which I think could be in real trouble.)
But probably still warmer than the 1987 El Nino year.
Depends upon whether the oceans have had a chance to recharge the heat released by the El Nino. An El Nino is the manifestation of heat from the ocean headed for space.
NASA SIM suggests that ultraviolet irradiance fell far more than expected between 2004 and 2007 — by ten times as much as the total irradiance did… . Measurements (red) from another ultraviolet radiation-sensing instrument called SOLSTICE compare well with those from SIM.
https://web.archive.org/web/20130506055716/http://lasp.colorado.edu/sorce/images/instruments/sim/fig01.gif
http://www.john-daly.com/sverdrup.gif
Time will tell.
There is a lot of energy being released by this El Nino, and as the solar cycle dips down there may not be much recharge.
Lets hope it doesn’t drop down too far. 🙂
SNOW BALL EARTH!
http://image.shutterstock.com/display_pic_with_logo/1998197/195437621/stock-photo-i-am-so-scared-shocked-young-woman-staring-at-camera-while-holding-fingers-in-mouth-while-standing-195437621.jpg
http://i.space.com/images/i/000/032/063/i02/snowball-earth-mit.jpg
There was no El Nino in 1987. If you want to throw out one liners, at least try to make them factually correct.
There was a moderate El Nino in 1986/87 and 1987/88.
http://ggweather.com/enso/oni.htm
Manifesting as RAIN here !! And more to come… YUCK !!
http://www.abc.net.au/news/2016-01-05/flooding-in-parts-of-nsw-hunter-as-deluge-continues/7069356
Our reservoir is so full the islands have disappeared and all you see is water with trees sticking out.
Are the lapse rates different in this El Niño? Seems like we are getting a lot of snow at higher elevations unlike other El Niño years.
It does seem to be pumping a lot of moisture into the atmosphere, that is for certain.
Despite the claims of WARMEST EVAH! The snow cover is up compared to the 1980s – 90s and similar to the last few winters. People forget it is snowy winters and cool summers that cause glaciation and it does not snow much if it gets too cold. Think Antarctica, the driest continent on earth.
Those meridional (loopy) jets really help generate that snow cover by mixing warm moist air from the tropics with cold air from the pole generating the blizzards that dump 5, 6, 7 feet of snow in one storm.
For example Italy captured the world’s one day snow fall record twice this last winter in March TWICE.
240cm (7.84 ft) in Pescocostanzo
256cm (8.34 ft) of snow Capracotta
During that storm, 10 feet (3 meters) of snow fell on Passolanciano, Majella Italy burying the chairlifts .
Not far away, the Greek islands in the Mediterranean were buried under 6½ ft (2 m) of snow in January. In Norway they were forced to remove excessive snow from ski slopes –
“During the last two days we’ve got more snow than we had in the last two years together,” said Vegar Sårheim. “I had never believed we would experience this.”
Last fall Buffalo NY also had record snow of over 7 feet from one storm. Almost as much as they get in an entire winter and like Boston still had snow hanging around eight months later
OCTOBER 2015
http://www.ncdc.noaa.gov/sotc/service/global/snowcover-nhland/201510.gif
NOVEMBER 2015
http://www.ncdc.noaa.gov/sotc/service/global/snowcover-nhland/201511.gif
December is not available yet.
AndyG55 says: …I had a link to a paper on the absorption of different frequencies of UV into sea water… darned if I can find it,…
>>>>>>>>>
This?
http://www.klimaatfraude.info/oceaanopwarming-of-zeespiegelstijging-door-co2-is-niet-mogelijk_193094.html
in wayback Machine
https://web.archive.org/web/20150328135430/http://www.klimaatfraude.info/oceaanopwarming-of-zeespiegelstijging-door-co2-is-niet-mogelijk_193094.html
It mentions Wieliczka, Weng & Querry (Appl. Opt. 28, 1714-1719, 1989)
Name doesn’t ring a bell. And it was in English.
Check it out (google translate) since that is where I got the sunlight vs ocean depth map.
Also
http://www.john-daly.com/deepsea.htm
Where I got the name Sverdrup
Sverdrup’s Critical Depth Revisited
Sverdrup critical depth and the role of water clarity in Norwegian Coastal Water
has a lot of pointers to other studies.
Wow, this is an interesting one..
http://icelandmag.visir.is/article/2015-was-coldest-year-century-iceland
Goes along with Icelandic glaciers to expand for the first time in over 20 years?
“the temperature in 2015 was above the average of the years 1961-1990.”
You wonder why they would use 1961 – 1990 average temperature.
https://www.google.nl/search?q=world+average+temperatures&biw=1104&bih=673&source=lnms&tbm=isch&sa=X&ved=0ahUKEwir3LiHgpXKAhUKPxQKHRkIBVwQ_AUIBigB&dpr=1#tbm=isch&q=giss+reykiavik&imgrc=5qg1TQbgT–b6M%3A
From the much mangled data set published by, the National Center for Atmospheric Research | University Corporation for Atmospheric Research.
https://www2.ucar.edu/sites/default/files/news/2014/201301-201312.png
BOY did they squash that 1940s blip FLAT!
” So, if we could reduce the ocean blip by, say, 0.15 degC, then this would be significant for the global mean — It would be good to remove at least part of the 1940s blip, but we are still left with “why the blip”. — Tom Wigley 28/09/2009
That quote is one of the smoking guns of fraud. Not incompetence…fraud! Of course the CAGW faithful will literally not see anything wrong with it, because they are already so imbued with certainty that they just see it as correcting bad data to conform with what they KNOW is the Truth.
When the average person accepts that kind of data manipulation, I just pass it off as common error, or gullibility. It is different for anyone claiming to be a scientist. Scientists have a higher standard and a presumption of expertise in their field. They have no excuse for doing that sort of alteration.
The grantologists had to fake new data in order to keep the funding and hysteria alive. By their own metrics, CAGW has been falsified.
According to the NOAA State of the Climate 2008 report, climate computer model simulations show that if observations find that the globe has not warmed for periods of 15 years or more, the climate models predicting man-made warming from CO2 will be falsified at a confidence level of 95%:
“Near-zero and even negative trends are common for intervals of a decade or less in the simulations, due to the model’s internal climate variability. The simulations rule out (at the 95% level) zero trends for intervals of 15 yr or more, suggesting that an observed absence of warming of this duration is needed to create a discrepancy with the expected present-day warming rate.”
http://www1.ncdc.noaa.gov/pub/data/cmb/bams-sotc/climate-assessment-2008-lo-rez.pdf
Page 24, Middle column
According to Phil Jones, there has been no statistically significant warming since 1995. Ergo, the climate models have already been falsified at the 95% confidence level and it’s time to revert to the null hypothesis that man made CO2 is not causing global warming.
He further admitted that in the last 15 years there had been no ‘statistically significant’ warming, although he argued this was a blip rather than the long-term trend.
http://www.dailymail.co.uk/news/article-1250872/Climategate-U-turn-Astonishment-scientist-centre-global-warming-email-row-admits-data-organised.html
We are now past 18 years and counting.
“BOY did they squash that 1940s blip FLAT!”
And notice the HUGE DISCREPANCY in slope in the 1980-2000 period compare to this graph from IPCC 2001.
https://i1.wp.com/realclimatescience.com/wp-content/uploads/2016/01/2016-01-04-17-05-54.png
Someone is FUDGING the past BIG TIME !!!
Can Iran be far behind?
https://www.youtube.com/watch?v=oMBIH44PVIU
And we have a bunch of fools in DC — Wonderful.
Maybe now NK can stop the “oh poor us” bleating and drop the ultra-far-left victimology and become part of the real world !!
Don’t forget that Billy Clinton GAVE China the technology to develop reliable missiles.
Clinton arranged direct talks between Bernard Schwartz and a Chinese general to improve China’s rocket technology. Michael Armstrong was made head of the Export Advisory Council. Both companies were allowed to upgrade the launching and guidance of China’s missiles. Clinton even involved the Department of Energy, caretaker of our nuclear weapons… Shortly afterward the DOE relaxed security at US weapons labs. Wen Ho Lee, an ethnic Chinese physicist assigned to Los Alamos, illegally transferred data on nuclear warheads to his private computer files…
This ‘dismay’ on the part of China could be a head fake, especially given the popularity of Chinese Chess. Straight forward is not a good description of China with its deep hatred of the west. I certainly would not put it past China to use a buffoon like Kim Jong-un as a stalking horse. Chernobyl and Japan have shown China a strike on N. Korea would not be all bad especially if it wipes out a major portion of the N Korean population. China is not interested in a N Korean refugee influx across their border so they ship N Korea most of its food. I am sure China would like to rid itself of that load too.
Hackers Linked to China’s Army Seen From EU to D.C. They are after advanced technology.
Lessons of history: China’s century of humiliation: The repercussions of British opportunism in China during the Opium Wars can be felt in geopolitics even today
China Picks at the Scab to Keep the Wound Fresh
“Australian defense analyst Paul Monk is very telling on the subject of what President Xi intends for Asia’s near future:”
“To erase the shame of its century of national humiliation, China will need to have an unequivocal victory over somebody. “
It must be warm in the USA as all the cold air is in the Arctic judging by the ice extent
http://ocean.dmi.dk/arctic/old_icecover.uk.php
Our plucky DMI graph is on the rise again after a small detour of 365 days at the same value, lol
Andy
WARM!?
It is 16.1 °F (minus 7C) right now in sunny mid North Carolina. (Normal/avg low is 28 °F and the temp has a couple more hours to drop before bottoming out.)
I like a lady who uses modern scientific C and not old fashioned F !! 🙂
Andy
Gail! Quickly! Post more graphs to overwhelm your detractors with irrelevant data! It works every time and you just look smarter and smarter.
OOOoooh
Poor Marty, he can’t read a graph and his head is exploding from information overload.
Why don’t you run along back to the SkS sandbox now that you have hauled a Big Dog over here to defend you. After all you aren’t needed anymore.
Gail, Marty lies to protect his “precious”, “the cause”. Of course your info is relevant, I mean you are not posting baseball stats or poetry. You are posting real science, and it drives the CAGW faithful nuts.
https://www.youtube.com/watch?v=Iz-8CSa9xj8
Martin! Quickly! Actually read a study BEFORE proclaiming it irrelevant. Most of what you link to, relevant or not, simply doesn’t say what you claim it says. I don’t know about looking smarter, but reading your own source material might at least make you look informed.
Why are you so anti-science?
Martin! Quickly! Post some more SkS and wikipedia articles to overwhelm your detractors with irrelevant data! It works every time and you just look smarter and smarter, lol!
“graphs to overwhelm”
They certainly overwhelm little Marty goreboy !!
He has no idea how to cope with REAL DATA.
Brilliant. When all else fails cherry pick an obsolete plot. This particular plot with the coastal regions masked out is due to disappear soon. You might want to check out the updated plot
http://ocean.dmi.dk/arctic/icecover.uk.php
Arctic sea ice is currently close to its lowest extent on record.
How do you know it’s going to disappear soon ? It’s been saying that for a long time now. Meanwhile it gives me endless entertainment as it goes more and more wacky.
I notice that this plot has not been on the front of this website since it looped back, hee hee.
Andy
I have tried every time to get them to use the standard plot, but they prefer the obsolete one.
Because it’s a lot higher in extent that’s why, even though out of kilter with all the other graphs. I believe the expression ” bias confirmation” can be used here. Sadly, as I have said all along, this graph is borked.
It was ok till mid way last year and then has gone awol. It’s an outdated product so not looked after.
Andy
I get a kick out of alarmists pretending that 1979-2000 is a meaningful “mean”. Very funny stuff! No confirmation bias or cherry picking there.
I am still waiting for an explanation of what is wrong with the 30 percent ice, costal zone masked chart.
If the methodology is consistent, then they are accurate, or precise to previous 30 percent sea ice costsl zone masked out graphics.
If so MARTIN, what makes them wrong or obsolete???
David, why are you still waiting for an explanation that is posted AT THE WEBSITE. If you go to the page showing the standard 15% plot, the explanation is posted there. Here is the explanation that is posted there: ”
The plot above replaces an earlier sea ice extent plot, that was based on data with the coastal zones masked out. This coastal mask implied that the previous sea ice extent estimates were underestimated. The new plot displays absolute sea ice extent estimates. The old plot can still be viewed here for a while.”
THE COASTAL MASK IMPLIED THAT THE PREVIOUS SEA ICE EXTENT ESTIMATE#S WERE UNDERESTIMATED.
“Absolute estimates”. Very funny.
The graph is NOT obsolete.
It is up to date. and uses a consistent metric and is the same graph that SG has used all along
It is you that wants to use the wrong graph.
Did you know that Iceland has just had its COLDEST year this century.!
dumb reply, andy.
Yes , the 30% DMI graph does UNDER-estimate..
but it is consistent longer term, up to date graph.
All that the differences imply is that different parts of the Arctic are freezing.
The bulk main area is well up, but the fiddly inaccurate coastal areas are down.
Get over it.
There is nothing obsolete about the graph.. you just don’t like the REAL DATA that it is portraying.
Iceland has just had their coldest year this century.
“Yes , the 30% DMI graph does UNDER-estimate..”
That is why it is wrong to use it.
No its not..
It gives a consistent measure that is not confused by coastal inconsistencies and irregularities.
It would be inconsistent to change to the other graph.
No it doesn’t.
Again reduced to an empty answer.. poor marty.
SG uses a graph that is CONSISTENT back to 2005
The other one only goes back to 2011
End of story
“This coastal mask implied that the previous sea ice extent estimates were underestimated.”
Again, A LIE bought about by IGNORANCE and a total lack of any scientific understanding.
It does NOT imply that sea ice levels under that measurement metric were under-estimated.
They are two different metrics…
One which is CONSISTENT back to at least 2005.
and a new methodology that only goes back to 2011.
If you wanted to show changes in sea ice back as far as you could, .. which would you use ?
Both graphs are valid, but the one SG uses is more consistent and longer term, and the one he has been using all the time.
All that the difference shows is that for some reason the 30% sea ice has increased markedly, while the thinner, more sparse coastal sea ice is not doing very well.
““Yes , the 30% DMI graph does UNDER-estimate..””
Seems like little gorefool is saying that the real value for Arctic sea ice is A LOT MORE than the graph SG uses.
Nice connection Andy.
http://4.bp.blogspot.com/-v4833RhLE_E/Tw22kabjfSI/AAAAAAAACSE/BuGRpVFctFQ/s1600/ROTFLMAO%255B1%255D.jpg
Its nice to have puppet to play with sometimes. 😉
Let’s just keep pulling his strings.
He is ours to play with now.. he cannot escape. 😉
Notice how he has run away on the most recent thread.
where did he go, I wonder 😉
But he will be back.. avoiding answering the points…
remaining in his IGNORANCE.
Well the non masked DMI plot is now in 2016 and says so, the masked outdated one that DMI doesn’t care about – as nobody should be using – is currently being drawn by an out of control robot with an etch a sketch ….. snigger
It’ll be on 20 million Km2 soon and they will have to start masking off the coast of Spain ..ha ha
Andy
How can you have a mean from 1979 to 2000 when YOUR data set STARTS in 2012? You can’t just use someone else’s data set mean and standard deviation. That is dirty pool.
http://ocean.dmi.dk/arctic/plots/icecover/icecover_current_new.png
They even say.
Even DMI is now acknowledging the the new record maximum for the 30% and above ice extent plot (with the horizontal line in the plot below). Maybe it’ll reach 12 million km^2 in March? Very interesting…
http://ocean.dmi.dk/arctic/old_icecover.uk.php
http://ocean.dmi.dk/arctic/plots/icecover/icecover_current.png
Hmmm…my previous plot didn’t appear correctly…maybe this one.
http://ocean.dmi.dk/arctic/plots/icecover/icecover_current.png
Drat…just check out the link:
http://ocean.dmi.dk/arctic/old_icecover.uk.php
Frank K, The DMI url always posts an older graph.
By making case changes in the first portion of the URL which is case insensitive, you can fool the caching mechanism
http://oCean.dMi.dk/arctic/plots/icecover/icecover_current.png
Here I used oCean.dMi.dk
Nice find Neal.. I’ve been making a whole new jpg.. pita
Now I don’t need to. 🙂
Thanks Neal S. ! 🙂
Frank K said “Even DMI is now acknowledging the the new record maximum for the 30% and above ice extent plot (with the horizontal line in the plot below).”
That line is not a line put in to show some record by DMI Frank, it’s just the graph has hit the last day of the year, gone back to the start, still black, and then started again. That’s because it is not being monitored by DMI.
They never put a horizontal line in for any max or min record !
Just wishful thinking. This graph is screwy and only people who want it to show some massive amount of ice believe in it.
Andy
No, he’s using the same plot he’s used for several years. Cherry picking would be switch plots to whatever matches your position, at the moment. Using the same one from the start is called consistency.
Which we have been telling Marty for weeks.
http://gelbspanfiles.com/wp-content/uploads/2015/05/La-la-la-300×274.jpg
He? Who is “he” ?
Have you understood how the Milankovitch cycles initiate the glacials and interglacials and then are overtaken by the feedbacks yet? If not, I am happy to answer your remaining questions. At least now you know you were wrong about there being a contradiction.
Then what stops the feedbacks?
“Then what stops the feedbacks?”
Are you asking about what happens to the feedbacks when the system switches from increasing interglacial to increasing glacial? I have assumed that is obvious. It actually is obvious. I have also explained it several times.
First, the amount of energy reaching earth from the sun begins to decrease from its. But that maximum energy level is supporting the feedbacks at their maximum equilibrium level. When the energy input decreases, the feedbacks also begin to decrease.
Think about the albedo feedback. At the point of maximum natural warming, Arctic sea ice reaches its minimum. This is the time when the albedo is at its minimum, meaning the least amount of light is reflected back to space. Now the energy from the sun begins to decrease. Winter gets a bit colder and a bit longer. Arctic sea ice begins to increase in area and in how long it lasts in the summer. The albedo increases, reflecting more light back to space. That is a positive cooling feedback.
There is also the CO2 feedback. As winters get a bit colder and longer, more vegetation remains frozen all year instead of rotting, so more CO2 is taken out of the atmosphere. There is less greenhouse effect. This is another positive cooling feedback.
They all work that way.
Questions?
Here is another. As the lower atmosphere begins to cool, the air can hold less water vapor.Water vapor is a greenhouse gas at low altitudes. Less water in the air means less greenhouse effect. This is another positive cooling feedback.
Then that blows a hole in the run away global humidity/CO2 theory…..
Correct, Lat, but the runaway warming claim came from your side, not ours. Runaway warming can’t occur here: http://www.skepticalscience.com/positive-feedback-runaway-warming-advanced.htm
I didn’t know Hansen was on our side??
So, we have nothing to worry about then.
“I didn’t know Hansen was on our side??”
“So, we have nothing to worry about then.”
It is physically possible, but we can’t make it happen. It will eventually happen when the sun expands.
“A re-evaluation in 2013 of the effect of water vapour in the climate models showed that James Hansen’s outcome might be possible, but requires ten times the amount of CO2 we could release from burning all the oil, coal, and natural gas in Earth’s crust.”
https://en.wikipedia.org/wiki/Runaway_greenhouse_effect#Earth
But we do have to worry, Lat, just not about runaway warming. Just the warming we are causing will be bad for the human race.
McPherson is not on “our” side either….and neither is the IPCC
Lat, no one is predicting runaway global warming. I explained how reversing the Milankovitch cycles reverses the feedbacks. I trust you understand that process now. Your introduction of the runaway warming head fake was disingenuous, but expected. It has nothing to do with explaining how the feedbacks reverse.
Correct, Lat, but the runaway warming claim came from your side…
===
You know better….even the IPCC references it…and so does Woodwell
Lat, for christ sake. Look up “reference.” Now look up “predict.” Note that reference does not mean predict. Nobody is predicting a runaway greenhouse effect. You asked what happens to the feedbacks? I explained what happens to the feedbacks. But you actually believe the feedbacks can’t be stopped, that there is no explanation for how they stop. But I explained it to you in words of one syllable, so now you can’t claim you don’t know. But you certainly must have been embarrassed to have been caught believing a really stupid idea, so what do you do? You double down with the runaway warming claim. It is you anti -AGW guys who claim that positive feedbacks must lead to runaway warming. We don’t. Not Hansen. Not the IPCC. There is not enough fossil fuels on the planet to enable them. But your side claims positive feedbacks must lead to runaway warming. Your claim is false.
Martin…..tipping point and climate irreversibility are in reference to runaway global warming…..”our side” didn’t believe any of it from the get go
“Martin…..tipping point and climate irreversibility are in reference to runaway global warming”
No, the aren’t.
“Just the warming we are causing will be bad for the human race.”
“BULLSHIT “
James Hansen is a famous climate scientist, right?
Don’t make me have to pull a Gail and reference all the times Hansen has said a tipping point would lead to runaway global warming…
…you know better
“At the point of maximum natural warming, Arctic sea ice reaches its minimum.”
That is why it is such a childish cherry-pick to start Arctic sea ice graphs in 1979.
The NATURAL CYCLE of the AMO was at its very lowest.
The AMO is now pretty much at its highest. So Arctic sea ice is low for that pin-prick short period, which just happens to be also only just after the COLDEST period in the last 10,000 years.
You can ignore the AMO, you can ignore the zero summer sea ice for most of the 3/4 of the Holocene.
But “ignore” is just part of IGNORANCE.
And Marty.. you have IGNORANCE in spades..
and so long as you use SkS as a reference, that will not change.
Martin-
Have you figured out WHAT the Milankovitch cycles are, yet? Do you want to tell us some more about how obliquity changes cause the earth to receive more energy from the sun? Or how about elaborating on this new absurdity you just pulled out of your ass, about CO2 causing a runaway greenhouse effect ONCE THE SUN EXPANDS. Or maybe you can just lie to us some more about the contents of some studies YOU NEVER BOTHERED TO READ.
The sad part is, you don’t know enough about any of the bullshit you spew to even realize how stupid you sound. I’m starting to think SKS sent you here because you were embarrassing them over there.
It is NOT an obsolete plot..
It is up to date..
and that It is the only DMI plot that is consistent continuous back to 2005
It is the same plot that SG has used for a long time.
It would be wrong and inconsistent of him to change to a different measurement type
And that record.. reasonably accurate only back to 1976 (which was lower, btw)
such a piddling length of time , and only representing the upward leg of the AMO….
meaningless.
Especially when proxies show that during the first 3/4 of the Holocene the Arctic was often ICE FREE in summer. Which makes your “lowest on record” comment one based purely and absolutely on ignorance.
That was a dumb reply, andy.
You mean you didn’t understand it and can’t let it passed you idiot brain-washing.
Poor little Marty.
Go back to junior high.. try again.. idiot.
That was even dumber, Andy.
Poor child-mind Marty.. is that the best you can do now?
PATHETIC.
You make yourself look dumb, Andy.
Poor Marty..
Refuses to understand even the most basic facts about Arctic sea ice, because that would destroy his brain-washed ignorance.
Why didn’t anyone discuss this at all? I know it refutes one of your most cherished myths and all, but you could at least talk about how your thinking must be changing. But there was nothing! Don’t be embarrassed. Seriously:
Latest data shows cooling Sun, warming Earth
http://www.skepticalscience.com/Solar_temp_update.html
That’s because solar activity has very little influence on earth’s climate changes. The solarphiles still don’t get this but, strangely enough, neither do the warmers. The warmers rely on a more active sun to explain the 1910-1940 increase in global temps. The “detection and attribution” studies which the IPCC claim explain 20th century warming (and cooling) rely on obsolete solar data and BS aerosol fudge data.
Martin, I’m so glad you link to a website that shows no pause. No hiatus. I applaud you for showing the latest and most up-to-datest. Who needs a pause when you can get your 4-year-old daughter to draw a new graph with a Crayola? When are you going to show us the next new data, where the hockey stick and broken-cue stick combine with Obama’s fake birth certificate and Al Gore’s submerged beachside mansion in Santa Barbara, and we can find out that we deserve the 10,000 widows and orphans (young men) that Obama sent us because we are infidels who produce carbon pollution? Get on it lad.
Morgan, I don’t object to continuing to use the wrong data so you can show a pause, but at least show your pause in the real world context. It has been one of many pauses since 1970: http://www.skepticalscience.com/graphics.php?g=47
And even if we were to continue using the wrong data, the pause ended. Last year was the warmest year on record, and this year is warmer than last year by a whole bunch.
this year is warmer than last year by a whole bunch.
Exactly how much warmer? And how much of that is adjustemnts?
They are still emailing each other, trying do decide how much adjustment to make. But it won’t matter how much they tamper, because in Jan, 2017 President Trump hires real scientists to put the original data back.
Hello Marty! Exactly how much warming? And for how much of the warming are the adjustments responsible? You claimed “a bunch” of warming this year over last. Lie much?
IPCC 2001 shows a pause from 1980 -1997, then the spike and start of the step.
https://i1.wp.com/realclimatescience.com/wp-content/uploads/2016/01/2016-01-04-17-05-54.png
All respectable data from satellites then shows a pause or even cooling after the El Nino from 2001.
There is only one person here using a FRAUDULENT graph.. and that is YOU.
And you are destined to use FRAUDULENT data, because that is what SkS always relies on.. because FRAUDULENT data is the only data that shows any warming.
“It has been one of many pauses since 1970: ”
No , not many.. just two main plateaus with a step change
First the zero trend from 1980-around 2000 (as shown by IPCC 2001)
https://i1.wp.com/realclimatescience.com/wp-content/uploads/2016/01/2016-01-04-17-05-54.png
Then the zero trend from 2001 -2015. as shown by the satellite data.
2015 was NOT the warmest year in anything except the fraudulent, fabricated NCDC et al farce. Your continued use of this LIE shows your acceptance of blatant data mal-adjustment and fabrication.. ie scientific FRAUD.
But its all you have.. so you have to keep hanging onto it.
“Last year was the warmest year on record,”
BULLSHIT !
2015 was in 3rd place, well below 1998.
You are still relying on massively fabricated and adjusted and data .. its all you have.
Lets see just how FRAUDULENT that red line.. ie GISS really is.
This is from the 2001 IPCC report
https://i1.wp.com/realclimatescience.com/wp-content/uploads/2016/01/2016-01-04-17-05-54.png
Basically flat from 1980-2000 with the 1998 El Nino spike
Marty’s FRAUDULENT GISS graph has a massive positive trend.
It is a LIE, a FABRICATION and proof of INTENTIONAL FRAUD…… and Marty KNOWS it.
“That’s because solar activity has very little influence on earth’s climate changes.”
It will be ABSOLUTELY HILARIOUS to watch you idiots once the satellite temperatures start to drop once this El Nino is over, which appears may be happening sooner than expected.
GISS et al, will of course have NO CHANCE of showing any real temperatures until the government sponsoring of the AGW scam ceases and the perpetrators are held to account.
Please stop using Sks as a ‘reference’.
roflmao.. We know the red line is a maladjusted, fabricated FRAUD.
This is what SkS always do.. use fraudulent data to show a LIE..
No wonder you use them so much. Its all you have.
The blue line, well yes.. we know it started to cool around 2000, that is what we have been telling you for ages.
PLEASE hang around until after this current El Nino, so that you can for yourself what a monumental ASS you are making of yourself. 🙂
Or will you run , run , run away like a cowardly little worm as temperatures start to drop.
Steven, what happened to the Reggie house? Was your campaign to save it successful?
Thanks all. I feel as if I have done good today. I explained to Latitude how feedbacks reverse. Keep an open mind!
“Keep an open mind!”
From a brain-washed AGW minion like you.. that is truly funny.
Thanks for continuing to be low-end comic relief.
ps.. Indications that the El Nino is subsiding , and with PDO and AMO heading negative, could be fun.
Please stick around. I really want to watch your reaction as real global temperatures start to cool during this year. 😉
Tell me.. what happens to Norway if its hydro dams freeze ?
Do they have to start using all that oil they currently export. Fun times ahead, bozo. 🙂
AndyG,
Did you see my comment HERE up thread?
Looks to me that this El Niño is going to be a wimp compared to the 1997-98 El Niño.
I really wish the cloud cover & albedo data was up to date so we could look at it. Funny how they stopped publishing it five years ago.
I was looks for more recent data and stumble on this.
October 11, 2015 Albedo regulation of Ice Ages, with no CO2 feedbacks
He makes an interesting point. This graph is a bit off putting though.
http://www.climatedata.info/forcing/milankovitch-cycles/files/stacks_image_6997.png
The current El Nino is not quite as strong and different than the “great” El Nino with the highest SSTs concentrated further to the west.
shading a bit towards an El Nino Modoki? Modokis are normally not followed by a La Nina.
El Niño likely past its peak
Issued on 5 January 2016 | Product Code IDCKGEWW00
A number of El Niño-Southern Oscillation (ENSO) indicators suggest that the 2015-16 El Niño has peaked in recent weeks. Tropical Pacific Ocean temperatures suggest this event is one of the top three strongest El Niño events of the past 50 years. Climate models suggest the 2015-16 El Niño will decline during the coming months, with a return to ENSO neutral likely during the second quarter of 2016.
http://www.bom.gov.au/climate/enso/index.shtml
Gees, that’s happening sooner than accepted.
Similar reports on “notalot…
“There are various signs, including SST’s, upper ocean heat content and winds, but the most telling comment is:
Sea surface temperature across the equatorial Pacific basin have cooled roughly one-half a degree over the last four weeks. At the same time, a large pool of cold water beneath the surface in the western Pacific has been expanding eastward, nearly doubling in size over the past two months.
ESRL’s MEI Index also confirms this, dropping from 2.308 in November to 2.123 last month. This is the lowest value since last July.
It could come back for seconds in the next month or so, as it did in 1998, but the consensus is against this.”
Thanks all. I feel as if I have done good today. I explained to Latitude how feedbacks reverse.
====
No….you said “Milankovitch cycles initiate the glacials and interglacials and then are overtaken by the feedbacks yet?”
I asked……”Then what stops the feedbacks?”
Latitude already knows that……
Using your “explanation”…feedbacks obviously have no control over global warming,
…which means CO2 has no control over global warming
Both of those things are easily overwhelmed by Milankovitch cycles…
…which means it’s the sun that done it
So why are we discussing what climate scientists say?…we should be consulting astrologists
Latitude, take a quick peak at the paper I link to above. He brings a completely different factor into play for the Milankovitch cycles, glacial, interglacial switches that I had not seen before. Or at least one I had not thought about.
read that….thanks!
That has to have time to sink in…I’ll have to read it more that once
“I feel as if I have done good today”
Yep, you have continued making a monumental fool of yourself… WEEL DONE. ! 🙂
Remaining ignorant to anything except the farcical comedy that is SkS.
No, No Andy, you do not understand.
Marty feels he has done good by dragging a big dog from the SkS sandbox to help him fight his ‘battles.’ It is amusing that neither of them can do much when it comes to an actual debate except trot out more Alinsky tactics.
BYE BYE!
http://www.shopatnorway.com/images/840101_LA_trolls_norway.jpg
Gail, this blog is very popular and regularly linked on Drudge, Zippers, Mail, etc
I think Marty is just trying to promote his blog….SkS
cause, Lord knows, SkS is at the very bottom of the pile
Latitude, I know SS is on the bottom of the pile. It is one of the reasons I refuse to look at his links. I want it to stay at the bottom. Beside Marty and Finn never bother to read any links we post even to peer-reviewed papers so why should we read theirs?
“a big dog”
I didn’t see any big dog.
at best , a yapping Chihuahua.
Snicker…
To Marty he is an intellectual giant!
I don’t follow his links either….
Marty has also failed to answer my question I asked several days ago, on another thread, why is the current Holocene (warm period) the lowest yet has the highest CO2 levels in the past +400,000 years?
http://i255.photobucket.com/albums/hh154/crocko05/Temp%20vs%20CO2%20-%20400000%20years_zpskyy0qvra.jpg
And note that even at its peaks, CO2 was totally unable to sustain warm temperatures.
In fact CO2 peaks were always near the start of the DOWNWARD temperature trend.
..and that’s the scary part
The default setting for this planet is a lot colder for a lot longer.
Even if someone believes in global warming 100%..
…I’ve never understood why it’s a bad thing
Know what’s even more scarier Lat?
The ‘cold glacial’ periods appear to be increasing in length!
Not at all scary, Bruce.. Won’ t happen in our lifetime.
The children bought up on warmista BS probably won’t see it either.
And hopefully by the generation after that, people will be looking back at the AGW scam and saying ……..
“WTF were they thinking” !!!
Andy, it doesn’t take full glaciation to be a royal PITA for the human race. The slide into glaciation is quite bad enough especially when the goal of ‘world leaders’ is to squeeze every last drop of wealth from the masses even if they have to starve them to death.
“The lesson from the last interglacial “greenhouse” in the Bahamas is that the closing of that interval brought sea-level changes that were rapid and extreme. This has prompted the remark that between the greenhouse and the icehouse lies a climatic “madhouse”! — Neuman and Hearty (1996)
Even a drop back into the weather of the 1970’s could be worrying. The Köppen climate classification [is a]?widely used, vegetation-based empirical climate classification system. In the 1970’s the climatic change shifted the Köppen climate boundary over 2 degrees lat. or 150 miles (240 K) south.
http://www.sturmsoft.com/climate/suckling_mitchell_2000_fig2_3.gif
This is a major problem for Canada and Russia and the rest of the world.
Especially since the Grain Traders convinced the USA to ditch a grain reserve and turn the excess into biofuel.
So don’t expect the US government to make any move to prevent starvation. In fact Goldman Sachs LOVED it! How Goldman Sachs Created the Food Crisis
Dan Amstutz is the thread who runs through out. Under President Reagan (Yes a Republican) Dan Amstutz, VP of Cargill, wrote the World Trade Organization draft Agreement on Agriculture (AoA) as USDA undersecretary for international affairs. Amstutz also wrote the “Freedom to Farm Bill” later known as Freedom to Fail Act that wiped out USA farmers, the US Strategic Grain Reserve and set-up the 2008 food crisis orchestrated by Goldman Sachs. Amstutz was also a VP of Goldman Sachs at the time and was president of the North American Export Grain Association (NAEGA) from 1994 to 2000. “Throughout his very successful career Dan Amstutz represented and championed ideas and goals of NAEGA membership. “ — A Lasting Tribute by the NAEGA who developed the Amstutz Award to honor this baby killer.
Back to the 1970s grain crisis.
The 1974 CIA report:
“A Study of Climatological Research as it Pertains to Intelligence Problems”
Gail, I still stick by the comment that I doubt we will see a LOT of cooling in our lifetimes.
I hope like heck that we don’t drop down to LIA temps again too soon.
And I also think that the general populous HAS to wake up to the fraud of AGW at some stage.
A small, very obvious cooling is all it will take..
That is why the AGW fakers are so worried.. they can see what’s coming.
AndyG,
There is one point all, or at least most of us miss. It is LAND that cools the fastest. That is why 65N is critical to the Milankovitch cycles. The Oceans are giant hot water bottles keeping the COASTAL areas warm a lot longer than the interior. Remember the coastal areas are where most of the cities (and recording stations) are while the interior, like the US great plains and Russian & Canadian wheat belts are where the farms are. This means world temperatures, especially NOAAs, mean diddley because we are measuring the wrong place. If farmland cools we are in deep caca.
The energy in the lower atmosphere is actually temperature PLUS water (latent heat of vaporization) When the earth cools it gets drier and if the energy in water vapor is ignored you could actually see the temperature rise as the earth cools. (Deserts are hotter than rain forests for this reason.)
Frank Lansner has done quite a bit of work separating out the temperature signal from coastal areas vs interior. January 6, 2014 The Original Temperatures Project
http://hidethedecline.eu/media/AORIT/SUM/4.gif
Frank’s graphs show the greater responsiveness of interior land areas. Since you are an Aussie, I thought you would like this one first.
http://hidethedecline.eu/media/AORIT/SUM/9.gif
http://hidethedecline.eu/media/AORIT/SUM/19.gif
http://hidethedecline.eu/media/AORIT/SUM/8.gif
http://hidethedecline.eu/media/AORIT/SUM/3.gif
And a final very telling comment on BEST (Zeke, the Mush pup & Muller) from Frank.
oops Gail.. first graph says “Austria” not “Australia” 😉
If your eyes are like mine at the moment.. an easy mistake.
Way to much Excel work today.. I need a bigger screen at work I think.
Sorry, Andy, not very good eyesight combined with John Dewey’s intentionally F-up ‘See and Say’ reading method means while I can read 1500 words per minute with ease I sometimes confuse words that look the same. It also makes me really really rotten at editing or reading out loud.
What’s more interesting is that 80% of that +400,000 years, temperatures have been at or below the 1961-1990 global average temperature.
http://i255.photobucket.com/albums/hh154/crocko05/Past%20400000%20year%20temps_zpsmqmty7yo.jpg
Take a close look at this graph.
https://i1.wp.com/www.climatedata.info/forcing/milankovitch-cycles/files/stacks_image_6997.png
In all cases, in the last 250,000 years, when the solar insolation at 65N dropped the temperature also dropped…. except for the Holocene which is droppinf much more slowly.
MIS11 was the double precession interglacial between 424,000 and 374,000 years ago. It was considered as a possible Holocene analog and is not shown. Lisiecki & Raymo (2005) trashed that idea. The 21 June insolation minimum at 65°N during MIS 11 only dropped to 489 W/m2, while the Holocene at present already has a minimum of 474 W/m2.
A Pliocene-Pleistocene stack of 57 globally distributed benthic D18O records Lisiecki & Raymo (2005)
Their conclusion: