
Fraudster Michael Mann claims that the recent temperature spike is due mainly to global warming, and El Nino is a minor component.

Wood for Trees: Interactive Graphs
In fact, the spike is completely due to El Nino. Troposphere temperatures were flat for 17 years prior to the El Nino.
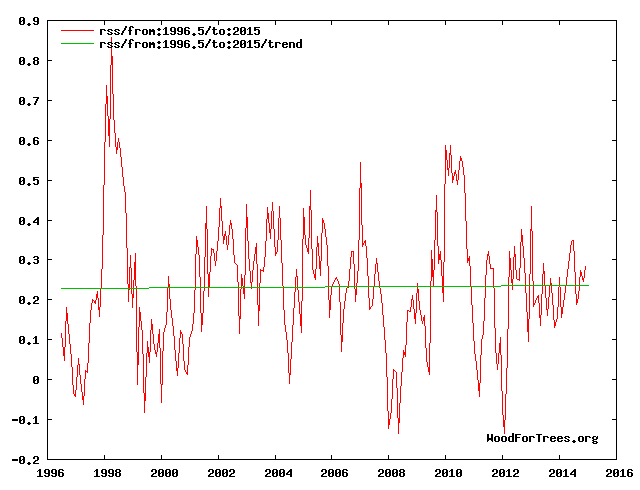

The past 2 months is climate. The last 17 years is just weather.
It fits the cognitive developmental phase of a 2-year-old. When Mikey notices something happening in the world he thinks he’s caused it. Until he suddenly decides it’s over.
https://www.youtube.com/watch?v=uzx59tmEE_0
Not being a pediatric psychologist I can’t tell if this is it or if we are dealing with a cunning 7-year-old who knows he’s lying. It’s a real conundrum.
Mikey fits this description:
“We are seeing not only the death of scientific inquiry, but academia.
Integrity is the worst nightmare of the left and they will go to any length to stamp it out.”
Luckily this only applies to things like acupuncture, astrology, climate science, spoon bending….things like that.
Hey! Stamping out real science is the “free exercise” of the Constitutionally-protected religion of Econaziism. Vade retro, denier!
From 1998 to 1999, the temperature in the troposphere has fallen by more than 1 degree C.
http://woodfortrees.org/plot/rss/from:1997/to:2001
Sorry, almost 1 degree C.
And if it happened then, it very well could happen now. Hang on to your hats!
There’s also a spike in precipitations/clouds. The heat isn’t taking its time to linger around; it’s getting expressed. Isn’t CO2 supposed to retain it, and the upper tropospheric hot spot inhibit convection? The El Nino heat will be gone before we know it, just like 1998, and we will all be happy with the hole in which Mr. Mann has dug for himself. He’ll be fine through, since his only saving grace is NOAA adjusting data, which is modus operandi.
Let’s see how quickly changing conditions in the Pacific.
http://www.cpc.ncep.noaa.gov/products/analysis_monitoring/enso_update/heat-last-year.gif
http://www.ospo.noaa.gov/Products/ocean/sst/anomaly/anim_2mw.html
As you can see the last El Niño does not have a major impact on the AMO cycle.
http://woodfortrees.org/plot/esrl-amo/from:1997
Lets get some perspective: the largest estimate of all oil pumped out of the planet is 135 billion MT.
1 MT = 1 cubic meter of water. So of all the oil used in the history of ever, you could fill up Lake Erie by 31%. Lake Superior by 11%. That is a pimple on an elephant’s ass.
We are not changing the weather.
Why not just have some Mayan Chacs hold us down and these Climate Priests carve our hearts out. That has as much chance as what they put forth to control the weather.
Careful … don’t want to give them any ideas. (Holding us down and having the Climate Priests carve our hearts out) But somehow I think, that is pretty much exactly what they want to do anyway. And yeah … it will have just about the same null effect on the climate.
They have already held down generations of kids while they remove their brains. Thank Jimmy Carter et al.
Truth^^^
Throwing out the baby with the sea water.
During this period of unprecedented heat, there were unprecedented snow in Kuwait, Vietnam (almost down to the old DMZ) and Taiwan. A record blizzard from DC to NYC. Boston has its coldest temperature in almost 60 years. Huge cold related disaster in Mongolia. Great skiing out in the US west, well into spring. Somehow all this unprecedented heat did not melt the planet as one would expect.
Added to which, “Nago city on the tropical island of Okinawa saw snow for the first time in recorded history since 1966, while the island of Amami Ohshima had its first snowfall in 115 years”, JMA said.
http://www.ntv.co.jp/englishnews/nature/cold_snap_brings_okinawa_first-ever_snow/
http://edition.cnn.com/2016/01/25/asia/asia-cold-weather-travel-disruption/index.html
Winter cold lasted 5 days in a row, and in March too. This has not happened at March in Tokyo for 32 years.
http://news.goo.ne.jp/article/weathernews/nation/weathernews-20160314154034486.html
?Until 14th Mar, the highest weekly temperature(C) in Tokyo. http://news.goo.ne.jp/picture/nation/weathernews-20160314154034486.html
According to the JMA data, no warming trend since 1998 in Japan.
https://twitter.com/KiryeNet/status/684937604979011584
Forecast circulation at the beginning of April means the flow of cool air in the Northeast.
http://users.met.fu-berlin.de/~Aktuell/strat-www/wdiag/figs/ecmwf1/ecmwf150f120.gif
Two centers of the polar vortex compatible with the Earth’s magnetic field. Very low solar activity.
Yes, we had April-like weather in February, and now will get February-like weather in April. It balances out to what is called “normal” in New England. There are about sixteen places in the World where they say, “If you don’t like the weather, wait a minute (hour/day/week/month)” and we are one of them.
I actually wonder if the loopy jet-stream isn’t a sign of the planet shifting from a warm to a cold cycle. When things are in transition the jet becomes meridienal, and when they stabilize the jet becomes more zonal. In my mind’s eye I see it as a wobble like a top’s, which then stabilizes.
But if you want to get melodramatic, you can envision it as a wobble like a top’s just before it falls over and goes scooting all over the place. That idea would sell more newspapers.
So you’re OK with fitting a linear trend through a data range that begins immediately prior to the 1998 El Nino event and extends through last year. But extending the trend line through the current El Nino event – or worse, from 1979 where this data set starts – is fraud?
The stupid. It berns.
Good defense of your position there. I’ll ask again: why did you start your graph in 1997 and stop in 2015? Why not plot the full data set beginning from 1979? You can even leave off the current year if you’d like.
He was graphing his description in the heading. See where it says
“In fact, the spike is completely due to El Nino. Troposphere temperatures were flat for 17 years prior to the El Nino.”
Now follow the logic with me…..Piltdown Mann says the spike is due to global warming but it can’t be or there would be, oh never mind you probably won’t understand anyway.
Morgan, thanks for stopping your explanation. I’m sure it involves lots of sciencey sounding words. Tony claims that there was no linear trend towards warmer temperatures from 1996-2015. He shows a plot supporting this. He says that Mann is a fraud because Mann claims that the higher temperatures in 2016 cannot be completely explained by El Nino, but rather, that the higher temperature is mostly due to global warming. Do we agree so far? Here’s the issue: Mann’s conclusion was not based on only these 17 years worth of data that Tony picked. It was based on much longer sets of temperature records. But even the data set that Tony’s 17 graph is derived from shows warming from 1979 to 2015. It shows that 2015 was warmer than 1997. It even shows that the current El Nino is warmer than the one in 1998. Clearly, Mann is acting fraudulently.
Why start in 1979? Grow a pair and start in 1600:
http://www.hyzercreek.com/SolarIrradianceBMP%5D.gif
Now, what was the cause of the warming trend 1600 to 2016?
What was the cause of the dozens of similar warming trends since 8000 BC
http://www.hyzercreek.com/GISPplusGRIP.jpg
Hey Billy! “Clearly, Mann is acting fraudulently.”
Yes, clearly he is. Mann tells us that the warming is from human caused CO2 increases. That warming (if it were real) would have certain characteristics which are not seen in the temperature measurements. One of those characteristics is that (with the observed rate of CO2 increases) CO2 caused warming does not show 17 year pauses.
So, CO2 warming (if it is real) does not exhibit 17 year pauses. We have just had a 17 year pause. Michael Mann says that the current warm spike is due to CO2 warming.
Morgan, I like to post pictures of unlabeled graphs from unnamed sources to support my positions too. But sometimes I just post pictures of cats instead. They work about as well.
Jason, I didn’t say anything about carbon dioxide.
The first chart is clearly labeled and the second one is the GISP2 graph so widely known that only a lithoceph would need a source. You really are new at this aren’t you?
Mann has an MO. If you don’t know is prior record, you can’t understand the level of skepticism.
Here is another picture of my cat:
http://www.hyzercreek.com/solarcyclesk.jpg
http://thumbs.dreamstime.com/z/scared-cartoon-cat-vector-illustration-31019274.jpg
“I like to post pictures of unlabeled graphs ”
Poor Billy.. like most “believers” he does not recognise the basic graphs pertaining to the AGW farce.
Suzuki didn’t know what UAh, RSS, Giss etc were.. …
seems we have Billy Suzuki on a short visit. (Henceforth to be named BS.)
Andy, have you ever read any of the papers that contain the graphs Morgan linked to? The fact that you refer to them as “basic graphs pertaining to the AGW farce” makes me think not.
So, you still don’t recognise the graph.???
Just say so next time.
Billy is really new to this internet thingy, he doesn’t realize you just need to tap your iPad or click on posted graph and it will display the website the graph is taken from
Well, my graphs just link to http://www.hyzercreek.com/hoax.htm but I have all the references there.
Yes. But I didn’t think he realized that.or he just might be obstinate.
(I went to your site could find all the links as to where you got the information and more., I have book marked it when I have to really study.
These climate change people are too lazy to search for information they usually end up name calling or straw man
Morgan, no your graphs do not link to that page. The graphs you posted are hosted at the same directory level of the Hyzer Creek Disc Golf site as is your “hoax” site that you linked to above, and there is no link from the graph to that page. In any case, thank you for showing that the climate has changed in the past. You should use these graphs to inform the climate scientists that generated these graphs that the climate has changed in the past.
Scott, thank you for clarifying that I can click on the graphs that Morgan posted from the Hyzer Creek Disc Golf site and see that they are indeed hosted on the Hyzer Creek Disc Golf site. You can click on the graphs too and verify for yourself that these graphs are hosted on the Hyzer Creek Disc Golf site. However, if you have clicked on the graphs above that link to the Hyzer Creek Disc Golf site, you will undoubtedly have noticed that there is no information provided about where these graphs were obtained from, what data the graphs depict, or the methods used to obtain those data that the graphs depict. Morgan has now provided this information in a separate link to another page at the Hyzer Creek Disc Golf course. But in doing so, he states that the graphs he posted above link to the “hoax” site that actually contains the references. They do not. Since I’m too lazy to search for my own information – like where the unattributed graphs that Morgan posted came from – maybe you can follow the links from the graphs to the Hyzer Creek Disc Golf site that Morgan provided and find out this information for me?
Billy,
What?
Morgan
Oh dear me Billy!
You really aren’t the sharpest knife in the block, are you?
Reblogged this on TheFlippinTruth.
It seems to me there is nothing abnormal about the spike. The 98 one was even bigger.
More spikes.
Guest Richard Moore (author, “Escaping the Matrix”) discuss his thesis that climate change on Earth is a natural phenomenon resulting from semi-regular “pulses” of electromagnetic energy from the galactic core.
https://youtu.be/wUHn5pwytgI
Robertv, excellent. Solar climate change, galactic climate change.
The 98 spike was much bigger close to the coast of South America. That is why Alarmists focus further out, towards the dateline. This El Nino was “the worst ever” out there, which is actually fascinating.
Alarmist need to learn how to say “fascinating” like “Spok” in the old Star Trek shows. They have a bad habit of going ballistic like “Bones”.
I remember this phrase from a recently read article, about El Nino, posted here: http://oceansgovernclimate.com/el-nino-does-not-warm-the-world/. Quoting from there: “When will climate science be able to distinguish clearly between a global-average manifestation of El Niño-driven global weather effects, and an explanation of global average warming associated with El Niño?” I wonder if there’s a link between the two facts?
Cruz will be next US president. SG be prepared LOL!!
The Warmists are so desperate for a sign from heaven that they cannot let any good chance like an El Nino go to waste. The threat of future cooling being likely only adds to their fervour. It’s El Nino or nothing.
No, the future cooling will be proof of warming.
Because of the wrong kind of(man made) CO2 radiating heat up out to space.
Below is a pdf file of the message sent to the UN Secretary General, Presidents of the US National Academy of Sciences and the UK’s Royal Society, and the Editor of Nature earlier today:
https://dl.dropboxusercontent.com/u/10640850/Ethics_and_Human_Rights_in_the_Scientific_Revolution.pdf
The intent is to remove any doubt about the intentions of these holders of high offices.
WUWT me completely blocked. Can I write nonsense?
WUWT blocked me long ago. As noted above, the entire corrupt structure of post-WWII science must be rebuilt from the ground up. The STANDARD CLIMATE, COSMOLOGY, NUCLEAR & SOLAR MODELS were designed to save the world from nuclear annihilation by hiding the source of energy that destroyed Hiroshima and Nagasaki on 6 & 9 AUG 1945.
Anthony Watts unsuccessfully tries to compromise truth with untruth.
Very low solar activity.
https://www.spaceweatherlive.com/en
http://www.n3kl.org/sun/images/noaa_xrays.gif?
I suggest you remove the word fraudster asap since Mann seems to be a litigious type. Whether you can prove something or not in court is secondary to the pain of the process.
Hey Billy! “Jason, I didn’t say anything about carbon dioxide.”
You did not, but the warming that Mann says is responsible, is warming that he says is due to CO2. If the warming observed does not fit the characteristics of CO2 caused warming, then Mann is wrong.
The charts that Tony shows make perfect sense to people who know the difference between CAGW and natural variability. They may not make sense to people who are uneducated about CAGW.
“The F10.7 Index has proven very valuable in specifying and forecasting space weather. Because it is a long record, it provides climatology of solar activity over six solar cycles. Because it comes from the chromosphere and corona of the sun, it tracks other important emissions that form in the same regions of the solar atmosphere. The Extreme UltraViolet (EUV) emissions that impact the ionosphere and modify the upper atmosphere track well with the F10.7 index. Many Ultra-Violet emissions that affect the stratosphere and ozone also correlate with the F10.7 index. And because this measurement can be made reliably and accurately from the ground in all weather conditions, it is a very robust data set with few gaps or calibration issues.”
http://services.swpc.noaa.gov/images/solar-cycle-10-cm-radio-flux.gif
http://www.swpc.noaa.gov/phenomena/f107-cm-radio-emissions
http://www.spaceweather.gc.ca/auto_generated_products/solradmon_eng.png
“Fraudster Michael Mann claims that the recent temperature spike is due mainly to global warming”
He’s going to look VERY STUPID when the spike disappears, then ! 🙂
ps… UAH shows the spike already down slightly for March.
It’s looking like the first half of April most of the eastern half of the US is going to see well below average temps for this time of year but the second half of the month is going to warm up nicely. Then if the guys at Weatherbell are correct we’re going to have a warmer summer than we’ve seen in the last few years. But come fall it’s looking like La Nina conditions start to take hold. It will be interesting to watch the transition and to see over the next couple years how deep the La Nina becomes with a negative AMDO and the Pacific also looking likes it turning the same.
BTW the US is running right on the mean for tornado incidence this year but Joe Bastardi believes that incidence will decrease and we will have another year with fewer than average tornadoes.