
One of the primary excuses used by NOAA to hide the decline in the US temperature record, is Time Of Observation Bias (TOBS.) The theory is that people used to be incredibly stupid and reset their max/min thermometers only once per day – in the afternoon. This would cause double counting of some high temperatures, and result in historical temperatures which were too high.
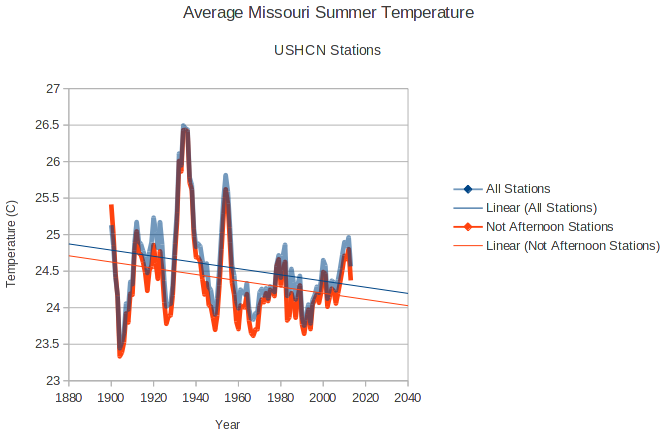
This theory is easy to test. Half of the stations in Missouri took their min/max readings during July 1936 in the afternoon, and the other half took them at morning or night during that month. I separated those groups out and found that it makes no difference to summer temperature trends.
The group of morning/night stations has been cooling at almost exactly the rate as the group of all stations. Also note that summer temperatures in the 1930’s are essentially identical in the two groups. No matter what tricks NOAA uses to hide the decline in US temperatures, it doesn’t change the facts.
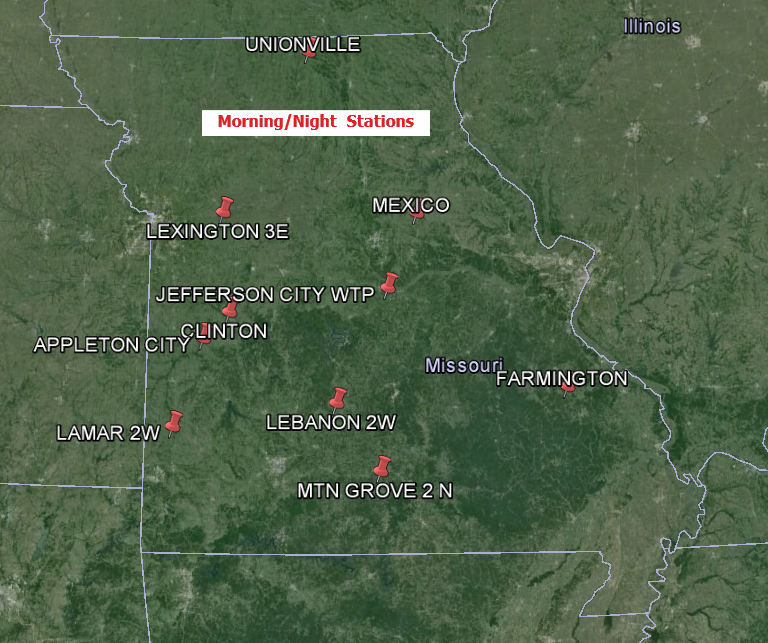
Morning/night stations.
APPLETON CITY           MO  USC00230204
CLINTON                 MO  USC00231711
FARMINGTON              MO  USC00232809
JEFFERSON CITY WTP      MO  USC00234271
LAMAR 2W                MO  USC00234705
LEBANON 2W              MO  USC00234825
LEES SUMMIT REED WR     MO  USC00234850
LEXINGTON 3E            MO  USC00234904
MEXICO                  MO  USC00235541
MOBERLY                 MO  USC00235671
MTN GROVE 2 N           MO  USC00235834
SPICKARD 7 W            MO  USC00237963
UNIONVILLE              MO  USC00238523
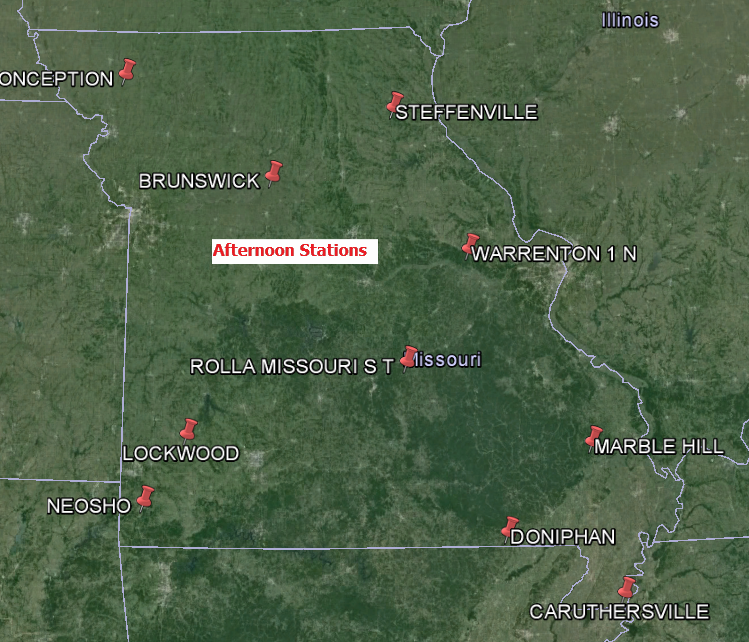
Afternoon stations
BOWLING GREEN 1 E       MO  USC00230856
BRUNSWICK               MO  USC00231037
CARUTHERSVILLE          MO  USC00231364
CONCEPTION              MO  USC00231822
DONIPHAN                MO  USC00232289
LOCKWOOD                MO  USC00235027
MARBLE HILL             MO  USC00235253
NEOSHO                  MO  USC00235976
ROLLA MISSOURI S T      MO  USC00237263
STEFFENVILLE            MO  USC00238051
SWEET SPRINGS           MO  USC00238223
TRUMAN DAM   RSVR       MO  USC00238466
WARRENTON 1 N           MO  USC00238725
Another important test is the percentage of days over 100 degrees, comparing morning and afternoon stations. The result of this interesting – the morning/night stations actually have a higher frequency of hot days than the afternoon stations. This is the opposite of what TOBS theory would predict, and most likely due to the fact that the morning stations are generally further southwest than the afternoon stations.
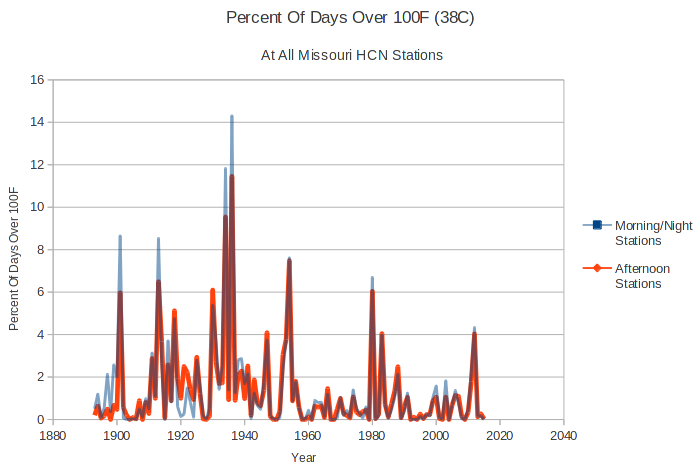
There is no indication that TOBS has a serious biasing effect, and no indication that the NOAA adjustments being done are legitimate.

Great comparison. Looks like the difference in the intercepts of the two slopes is only about 0.2C which is easily in the measurement uncertainty noise range. Another good check would be to compare the number of days above a high threshold, like 95F or 100F. My guess is that it also would not show much difference because most heat waves are multi-day episodes, so the difference in total high days would be small.
oz4caster
You are in the Austin, TX area aren’t you? How you enjoying your cooler and wetter than normal weather? I have a friend that is on the Dallas Fire Department that is loving it.
RAH, yes I’m in the Austin area and I like cooler and wetter, except for the extra mosquitoes. The forecast is back to well above normal for the upcoming week, but I’d be happy to see a cool rainy summer, despite the mosquitoes.
Reblogged this on Climate Collections.
Truman Dam?
When was it named that?
Apparently when it was built!
http://www.welcometowarsaw.com/44/Truman-DamVisitors-Center
SG, here’s another set of Giss “adjustments” for you
http://data.giss.nasa.gov/tmp/gistemp/STATIONS/tmp_633062600003_1_0/station.gif
And now
http://data.giss.nasa.gov/cgi-bin/gistemp/stdata_show.cgi?id=633062600000&ds=5
http://data.giss.nasa.gov/tmp/gistemp/STATIONS/tmp_633062600000_14_0/station.gif
A bit more research shows that there was a station move in 1950, on level ground, of a couple of hundred metres, apparently from a shaded spot because of tree growth, to an open field.
That single move apparently introduced a bigger change than the change in the entire record.
I also found a paper showing the UHI effect in De Bilt to be estimated at 0.22K per decade.. more than the entire warming in the station record.
De Bilt is a special station. Home station of KNMI. See esssat When Data Isn’t for details. But you already have the drift.
Nice little analysis.