
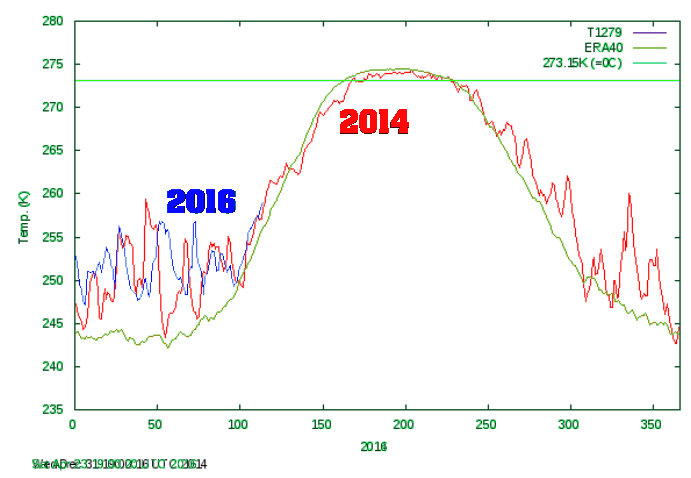
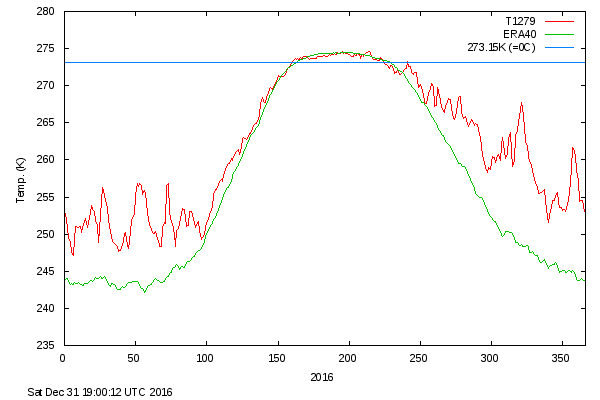
Arctic temperatures this year have been behaving almost identically to 2014, which went on to be one of the coldest summers on record north of 80N.
Arctic temperatures this year have been behaving almost identically to 2014, which went on to be one of the coldest summers on record north of 80N.

I’m sure the ‘boys’ are at work right now to adjust as necessary.
too fooking right
BUT it is an Election Year!
HOT AIR ALERT!!!!!!
Heard you on the Limbaugh show with the guest host.
You’ll be pretty close to correct if the forecasts I’ve seen have it right. And the US Navy will have some explaining to do. Hopefully before congress:
US Navy predicts summer ice free Arctic by 2016
http://www.theguardian.com/environment/earth-insight/2013/dec/09/us-navy-arctic-sea-ice-2016-melt
Tony, do you have any idea how DMI derives their Arctic temperature? I’m curious if they use land stations only, buoy stations only, or a combination of the two and what latitude they use to define “Arctic”.
I recently found Arctic buoy data and have noticed that some of the buoys are reporting obviously bad data. One of the worst this year is WMO ID 48507, which has been reading much too high all winter and would bias high any Arctic temperature estimates that used it. Here is the data at the International Arctic Buoy Programme (IABP):
http://iabp.apl.washington.edu/maps_daily_table.html
The IABP has a current Arctic map that shows “Sea Level Pressure” color coded for each buoy and has a button to switch to “Surface Temperature” for the plotted data, but the button doesn’t work for me with Firefox, Chrome, or IE.
Based on UM CCI CFSR estimates, the Arctic average temperature anomalies for latitudes 60N-90N spiked very high for January through March of 2016, much higher than in early 2014.
https://oz4caster.files.wordpress.com/2016/04/m3-cfsr-arctic-ta-monthly-1979-2016-04-11.gif
I don’t know if the bad buoy data are being ingested into the UM CCI GFS/CFSR system, but I would not be surprised if they are included.
Their SSTs come from Satellite data
http://ocean.dmi.dk/satellite/index.uk.php
I found this under “General FAQs”.
How are the data obtained? Do they come from observations or have they been derived from numerical models?
Reanalysis (as well as analysis) is a process by which model information and observations of many different sorts are combined in an optimal way to produce a consistent, global best estimate of the various atmospheric, wave and oceanographic parameters. S …
Here you go oz4caster
http://ocean.dmi.dk/arctic/documentation/arctic_mean_temp_data_explanation_newest.pdf
The money line:
“An NWP analysis is based on vastly more information than available from any single observing system. Data from ground, aircraft, bouys, ship, satellites, radiosondes, etc. are all combined to adjust the first guess field. As a consequence the quality of an analysis is much better than what can be obtained from gridding, or treating in other ways, data from a single or a few observing systems.”
So yes they do use bouys and every other system available. It seems to me DMI is pretty serious about QC.
Thanks RAH. That is exactly what I was looking for. Looks like they use input for the ECMWF which should be very similar to the GFS based input that UM CCI uses. Hard to tell if either one is including the bad buoy data, but I would not be surprised if it made it into both systems.