
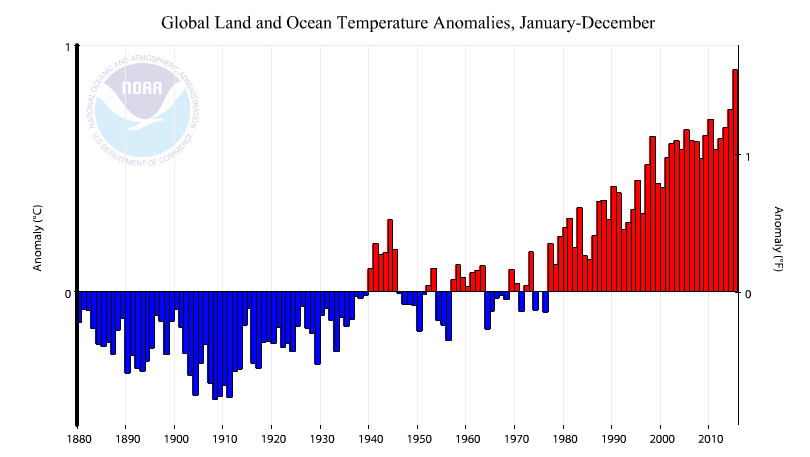
In 1989, NOAA’s Tom Karl said that the global climate cooled from 1921 to 1979.
7 Dec 1989, Page 14 – at Newspapers.com
NASA now shows 0.5C warming from 1921 to 1979.
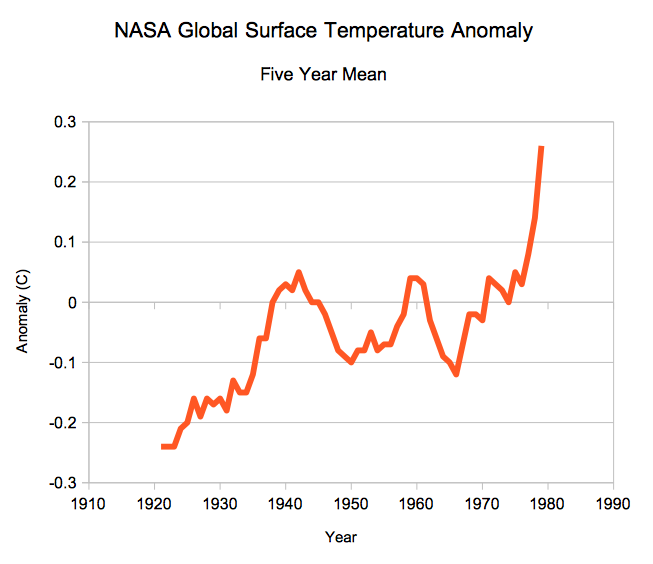
data.giss.nasa.gov/gistemp/graphs_v3/Fig.A.txt
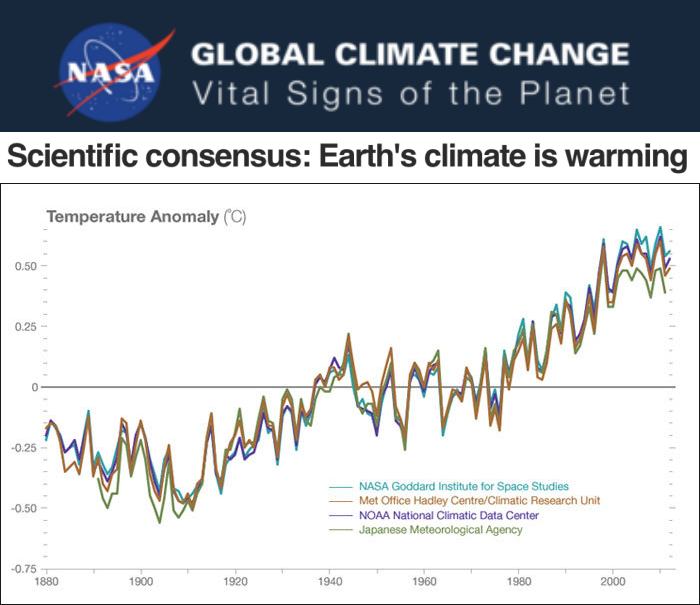
NASA claims that all the temperature data sets agree and are independent, which couldn’t be further from the truth.

Reblogged this on WeatherAction News.
Reblogged this on Climate Collections.
Thank you, Steven, for having the courage to report that “consensus science” is the misuse of government funds to deceive the public that pays for the research.
Liberty, the scientific method and human rights have all been sacrificed to build lock-step, 97% “consensus evidence” for Standard Models of Climatology-Cosmology.
Whoa there!
http://29.media.tumblr.com/tumblr_lj09iw7QZi1qc4debo1_500.png
Reblogged this on TheFlippinTruth.
Thank you again, Steve, for continuing to expose the massive fraud. The so-called data is an artificial product of the collusion of a small cabal of fanatical Warmista ‘Climate Scientists’ This is political fraud not science.
If it looks like a duck, walks like a duck and quacks like a duck, it’s a duck.
Arguably the most awful aspect of the entire climate debacle is the claim that 97% of (climate) scientists agree with AGW. And the media swallowed it hook line and sinker. Shame on them.
Thank you, Steve and Oliver for your efforts to put the facts out there.
That number is fake
there is good evidence that temperature data violate the independence assumption of OLS regression and that at makes OLS trends temperature not only spurious but also easy to manipulate.
http://papers.ssrn.com/sol3/papers.cfm?abstract_id=2763358
Four allegedly independent and unique data sets of a sampled population as diverse as that required to represent average global temperatures, that end up with a graphic display that doesn’t have a dime’s worth of difference between them? While the no-information general public will nod in wise agreement with the intended message of impending disaster, surely the perpetrators must realize that any rational thinker will laugh at just how fabricated and dumb this looks.
Abstract
In this work we study links between low cloud anomalies (LCA) at middle latitudes of the Northern and Southern hemispheres and galactic cosmic ray (GCR) variations used as a proxy of solar variability on the decadal time scale. It was shown that these links are not direct, but realized through GCR/solar activity phenomena influence on the development of extratropical baric systems (cyclones and troughs) which form cloud field. The violation of a positive correlation between LCA and GCR intensity which was observed in the 1980s–1990s occurred simultaneously in the Northern and Southern hemispheres in the early 2000s and coincided with the sign reversal of GCR effects on troposphere circulation. It was suggested that a possible reason for the correlation reversal between cyclonic activity at middle latitudes and GCR fluxes is the change of the stratospheric polar vortex intensity which influences significantly the troposphere-stratosphere coupling. The evidences for a noticeable weakening of the polar vortices in the Arctic and Antarctic stratosphere in the early 2000s are provided. The results obtained suggest an important role of the polar vortex evolution as a reason for a temporal variability of solar activity effects on the lower atmosphere.
http://www.sciencedirect.com/science/article/pii/S1364682616300979
A very poor paper. Rather thoroughly debunked already by Eschenbach at WUWT.
Svensmark maynor may not be right, but this paper does not contribute meaningfully to that debate.
Abstract
Lidar measurements of atmospheric temperature profiles and aerosol backscatter ratio and depolarization have been carried out at Thule (76.5°N, 68.8°E), Greenland, in the period January – early March 2009. The Lidar, installed at Thule in 1990, is part of the Network for the Detection of Atmospheric Composition Change (NDACC). During winter 2008-2009, Lidar profiles were acquired on a regular basis with a maximum of 5-6 hours of measurements per day, except for a few periods characterized by poor weather conditions or instrumental problems. A total of 44 Lidar temperature profiles between 25 and 70 km were obtained during the measurement campaign. Radiosonde data obtained at the stations of Eureka (79.9°N, 85.9°W) and Alert (82.5°N, 62.3°W) were used to derive temperatures below 25 km. Lidar temperature profiles have permitted to show the evolution of the stratospheric thermal conditions. During the first part of the campaign, in mid-January 2009, the polar vortex was still present above Thule. A polar stratospheric cloud (PSC) of NAT particles was detected on January 17 and 18 between 17 and 19 km. The major sudden stratospheric warming (SSW) was observed during the second half of January. The warming affected the upper stratosphere (~ 40-45 km) first, and then propagated rapidly from the upper to the lower stratosphere. The temporal evolution of the stratospheric temperature was derived at fixed potential temperature levels between 500 and 1500 K. Lidar data show the first signs of the warming at the 1500 K level (~ 42 km) on 22 January, after a week of instrumental problems that prevented from carrying out measurements. After 2-3 days, the warming reached 1000 K (~ 34 km), 900 K (~ 32 km) and 800 K (~ 29 km), and after 5-6 days it reached 600 K (~ 23 km) and 500 K (~ 20 km). Comparison of Lidar data with CIRA model profiles indicates that during the SSW the measured temperature between 25 and 45 km altitude exceeded by 40-50 K the expected CIRA values, reaching a maximum of ~290 K at 40 km. The intensity peak of the SSW was observed between 22 and 24 January. The warming produced an abrupt and irreversible break of the polar vortex. Comparison of 2009 data with Lidar atmospheric temperature measurements obtained during several years between 1994 and 2007 indicates that the 2009 SSW was the strongest event ever observed by the Lidar at Thule.
http://adsabs.harvard.edu/abs/2009AGUFM.A21C0202D
http://cosmicrays.oulu.fi/webform/query.cgi?startday=01&startmonth=01&startyear=2007&starttime=00%3A00&endday=01&endmonth=01&endyear=2010&endtime=00%3A00&resolution=Automatic+choice&picture=on
Thanks, ren, for the link. I will try to contact the authors of that important paper to tell them little-known background information from 1945:
My research mentor, Paul Kazuo Kuroda (1917-2001), secretly took and kept, in his own private possession, the successful design of Japan’s atomic bomb for fifty-seven years, at great risk to himself and to his own family. WHY??
To have undeniable proof that –
_ a.) Japan successfully designed the atomic bomb, but
_ b.) FEAR of nuclear annihilation convinced world leaders to hide the FORCE (God) in cores of heavy atoms and stars (Japan’s Goddess, Amaterasu)
http://www.goddessgift.com/goddess-myths/japanese_goddess_Amaterasu.htm
_ c.) Thus, denying humanity Aston’s 1922 promise of “powers beyond the dreams of scientific fiction.“
That is my private interpretation of this latest scientific tribute to Paul Kazuo Kuroda
https://dl.dropboxusercontent.com/u/10640850/Tribute_to_Paul_Kazuo_Kuroda2.pdf
to be published in the Geochemical Journal (of Japan).
http://news.uark.edu/articles/9632/dr-paul-kazuo-kuroda
Thanks, ren, for the article.
After Kuroda died, his widow returned to the Japanese government a copy of Japan’s successful atomic bomb design – information that BBC news reported in 2002 had been hidden from world government for fifty-seven years.
WHY? perhaps Kuroda wanted the public to know:
1. Japan designed and built atomic bombs
2. Japan’s atomic bomb plants vanished
3. Nuclear and solar physics corrupted
4. “Consensus scientific models” hid reality!
Ren, if you read Hungarian, you may appreciate this 2013 tribute to Paul Kazuo Kuroda:
https://dl.dropboxusercontent.com/u/10640850/A_nuclear_chemist_who_foresaw_the_past_Paul_Kazuo_Kuroda.pdf
If not, I have ordered an English translation that should be available early next week.
Unfortunately, I do not know of Hungarian.
http://nsidc.org/arcticseaicenews/
Interesting article in todays Washington Post – old research showed low fat diet with vegetable oils increased heart attack deaths and saturated fat not good for you. A good lesson on “settled science”.
https://www.washingtonpost.com/news/wonk/wp/2016/04/12/this-study-40-years-ago-could-have-reshaped-the-american-diet-but-it-was-never-fully-published/?wpisrc=nl_rainbow
Thanks for the heads up. I’ve also sent the link to Pierre Gosselin at NoTricksZone who besides climate frequently blogs about corruption and fraud in governmentally supported “nutritional science”.
Something really interesting about the research is one of the lead authors was Ancel Keyes himself – the same one who originally came up with the cholesterol/saturated fat theory. The article didn’t say this specifically but it appears to me he sat on his own data that didn’t conform to his original hypothesis. We know where else that happens…
Very interesting …
There is an intriguing series of reports that composite metal foams (CMFs) shield nuclear radiation:
http://www.sciencedirect.com/science/article/pii/S0969806X15300104
This suggests world leaders may be finally ready to utilize Aston’s 1922 PROMISE of “POWERS BEYOND THE DREAMS OF SCIENTIFIC FICTION“ in rest masses of atoms.
The atomic rest masses Aston reported as “Nuclear Packing Fractions“ in 1922, were replaced in nuclear physics textbooks with Dr. Carl von Weizsacker’s misleading “Average Nuclear Binding Energy“ after WWII – apparently in attempt to SAVE THE WORLD FROM NUCLEAR ANNIHILATION !