
James Hansen told Congress in June 1988 that it was going to be the hottest year ever. But by December he had backed down because a La Nina caused temperatures to plummet, which he called “unusual Pacific Ocean currents.”

Ellensburg Daily Record – Google News Archive Search
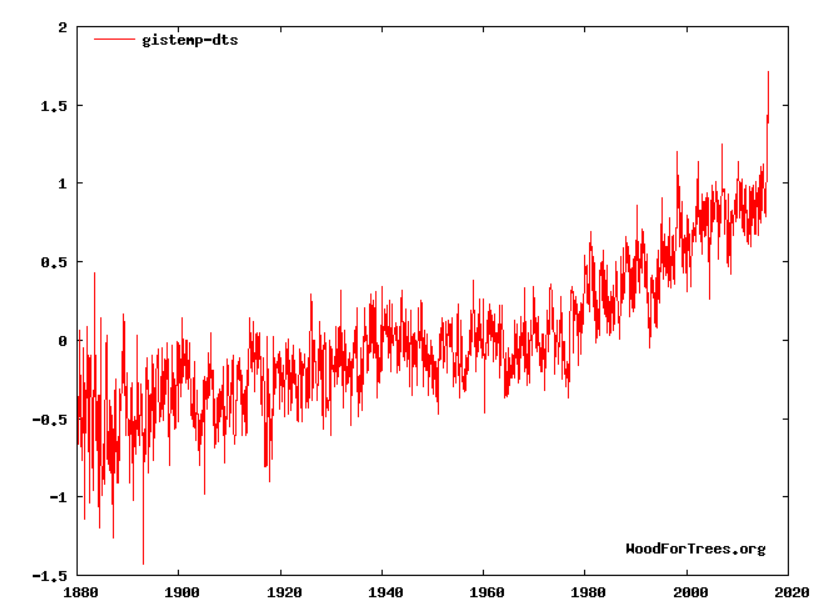
Hansen said at the time that earth had warmed half a degree over the past 100 years. NASA now shows almost double that much warming from 1888 to 1988. They constantly increase historical warming, because they think no one will notice.
NASA has already announced that 2016 is the hottest year ever, and once again we appear to have another La Nina setting in.
However, this time around I wouldn’t bet against NASA making 2016 the hottest year ever, because they no longer make any pretense about trying to be honest and have already jacked 2016 up 0.75C.

The La Niña is coming in much quicker than in 1998. It will be interesting to see if it is also stronger. We should know by later this year.
Below is a comparison of 2016 versus 1998 for April 24.
https://oz4caster.files.wordpress.com/2016/04/s5-um-cci-ssta-2016-04-24.jpg
https://oz4caster.files.wordpress.com/2016/04/s6-um-cci-ssta-1998-2016-04-24.jpg
Notice in the comparison that the global SSTA is only 0.14C higher in 2016 versus 1998. Not exactly very much warming for 18 years. There is also a very large and intense cold anomaly now in the northern North Pacific.
Thanks, oz4caster, for reminding us of reality.
A recent article in the American Thinker on Albert Speers, Jr. implies that False Pride & Blind Arrogance Isolated Humanity from Reality
The primitive relationship of humanity with reality was well illustrated by Yellow Lark’s Prayer:
http://www.worldprayers.org/archive/prayers/invocations/oh_great_spirit_whose_voice.html
The post-industrial relationship of humanity with “consensus scientific opinion” of reality is well illustrated by the dreams and aspirations of Albert Speer, Sr. and his son, Albert Speer, Jr.
http://www.americanthinker.com/articles/2016/04/the_long_green_nazi_shadow_over_albert_speer_jr.html
Scripps institute may have the correct. It’s coming on strong and I am wondering if some others are being too conservative in their La Nina forecasts. Scripps thinks the coming La Nina may be a record breaker.
Thanks to the Climategate emails that surfaced in late Nov 2009, the well-hidden dishonesty of federal research agencies is finally becoming obvious to the public.