
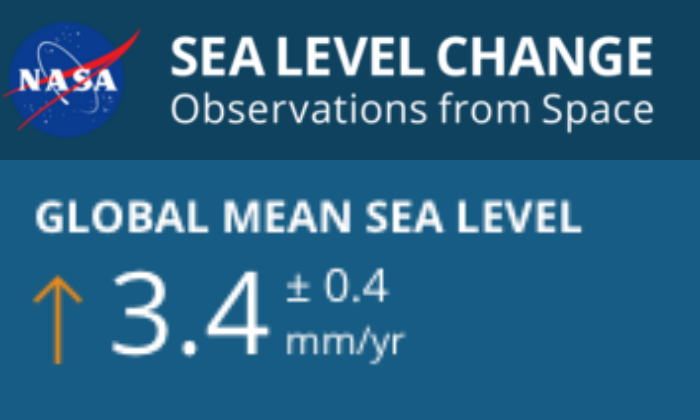
NASA says that sea level is rising 3.4 mm/year
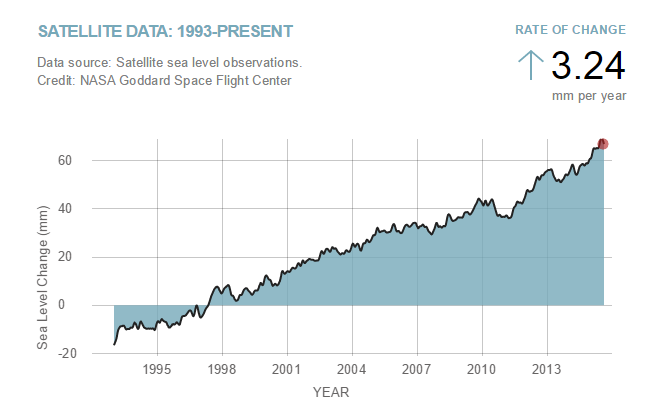
NASA also says that sea level is rising at 3.2 mm/year

Climate Change: Vital Signs of the Planet: Sea Level
In 1982, NASA said that sea level was rising just 1 mm/year
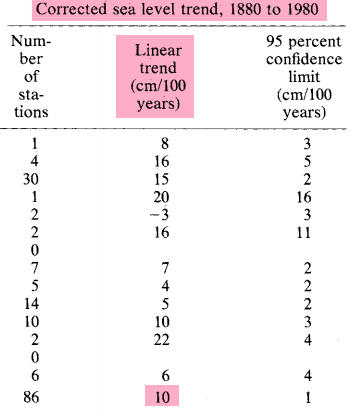
pubs.giss.nasa.gov/docs/1982/1982_Gornitz_etal_1.pdf
NOAA says that sea level is rising at half of NASA’s rate.
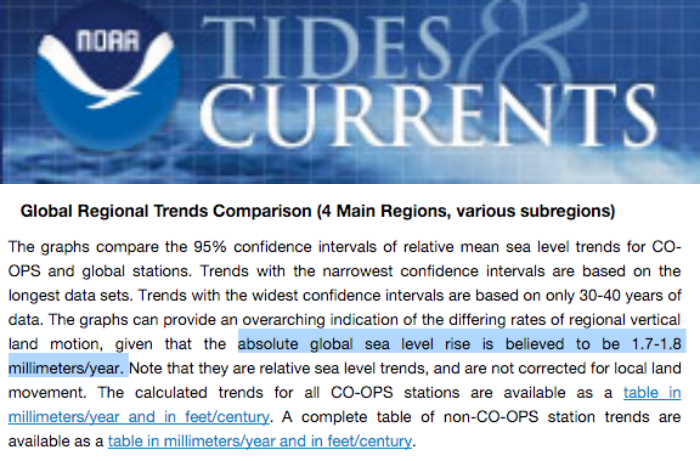
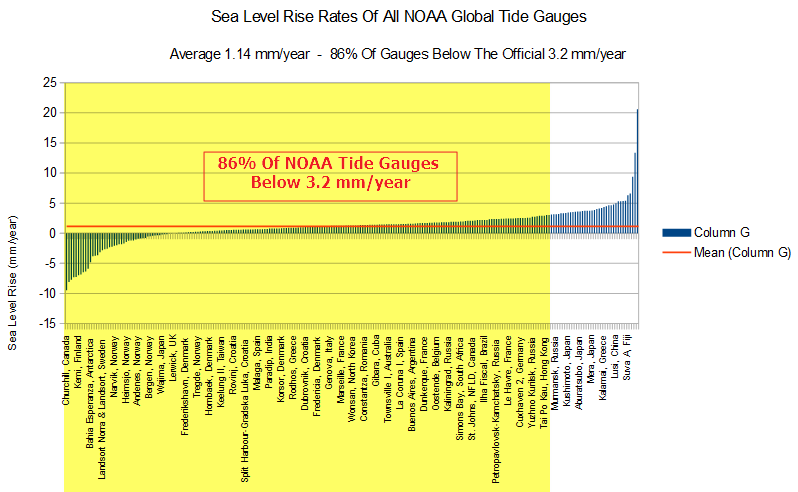
Sea Level Trends – Global Regional Trends
NOAA has 240 tide gauges globally, and 86% of them show less sea level rise than the claimed average of 3.2 or 3.4 mm/year. The average of all of the NOAA tide gauges is 1.14 mm/year, just over one third of the NASA climate claims.
tidesandcurrents.noaa.gov/sltrends/MSL_global_trendtable.html
Like with temperature data, NASA simply makes fake numbers up as required by the White House.

Thank God that we have private entities building space vehicles now-NASA has made a Faustian choice, and now is just another political bureaucracy. Perhaps the guys over there are aiming for a cabinet position rather than the stars.
It is not NASA’s fault. All federal agencies are forced to comply with the National Academy of Sciences (NAS), a “Scientific-Technological-Elite” former President Eisenhower warned might take control of government policy in his departing message to the nation on 17 JAN 1961:
https://m.youtube.com/watch?v=GOLld5PR4ts
World leaders (Presidents, The UN Secretary General, Senators, Popes, etc.) are captives of the “Scientific-Technological-Elite,” following “consensus” scientific opinions fabricated by NAS control of budgets of all research agencies.
Our challenge is to by-pass this barrier and get information to power brokers (Presidents, The UN Secretary General, Senators, Popes, etc.) essential to the survival of humanity:
https://dl.dropboxusercontent.com/u/10640850/Solar_Energy.pdf
You can fool some of the people all of the time and all of the people some of the time. Or whatever. The fact of the matter is that they are Government sponsored pathological liars and frauds.
It is a shame the Republicans are in such a shambles. It will be horrible to have four more years of this same crowd, but Trump and Cruz seem more determined to destroy each other than winning the election.
Who do you think are the aggressive male baboons in our society?
https://youtu.be/A4UMyTnlaMY
So what is the only solution?
The aggressive male baboons in our society are running for office.
It’s called technocracy.
Changes in the level of the ocean depend on the temperature of the ocean.
http://www.cpc.ncep.noaa.gov/products/analysis_monitoring/ocean/weeklyenso_clim_81-10/wksl_anm.gif
http://www.ospo.noaa.gov/Products/ocean/sst/anomaly/anim_2mw.html
Thanks, ren, for your reminders of the real forces that control Earth’s climate, weather, sea-level, etc.
and glacial melt,
but the factor that is often overlooked is water run off from sub surface sources.
Our aquifers are being depleted — and that is an environmental concern.
I have seen studies, that attribute up to 42% of the rise due to water run off.
The other two factors have been quite consistent for at least centuries
Unlike the more diligent contributors here, I do not have sources readily available
ren, I do not see the El Niño depicted in the sl anomaly graphic? Must be cold water below the surface?
http://www.cpc.ncep.noaa.gov/products/analysis_monitoring/ocean/anim/wkxzteq_anm.gif
Ren, that is November 2015. Very different now.
The rate of Sea Level Rise does vary over time. The best I can come up with from tide gauge and satellite data is that over the last 60 years there’s been an increase and over the last 22 years (span of the satellite record) the rate has slowed somewhat. Tide gauges say the overall rate is around 1.4 mm/yr
But as always when you look deeper most of the increase in rate is coming from all those Scandinavian tide gauges. Overall they have negative rates, and over time the absolute value of those rates is decreasing. In other words getting closer to zero.
Tide gauges on the North American West Coast have mostly decreased in rate over the last 60 years. And on the East Coast tide gauge records show a spike in the rates in the ’70s and a decrease since that time.
How does anybody measure sea level to mm? That’s another statistical hallucination. You can’t have more significant figures in the answer than in the raw data. Sixth grade math.
Why, it’s the law of large numbers, of course. You just measure something a whole lot of times with your inaccurate stick: for instance, I have here a “2×4” that I scrounged off the curbside that’s something like 4ft long, maybe. Well, it’s more than a foot long and less than a fathom, I know that cos I’m right around a fathom long when stretched out like a corpse. Now, I want to know the diameter of a certain fuel inlet pipe on my buddy’s oil furnace, so I just take my 4ft(±3ft) stick and measure the diameter 4 or 5 million times in succession. Et voilé! Simple math tells me that it’s exactly 1.200000m(±0.003mm) in diameter. And those unscientific dummies at the hardware store just laughed because they don’t know how to measure stuff scientifically.
Ha! The hardware store guys were right. Even if you took only 6 seconds per measurement it would have taken you nearly a year to finish. Your 4ft(±3ft) 2×4 probably shrank and maybe swelled during that time (unless you measured with a well-seasoned piece in a climate-controlled environment). You didn’t account for it and that’s why they were laughing. I won’t even mention the furnace inlet expanding and contracting with temperature changes while you were measuring it.
I am glad you submitted your paper for peer review here. Make the required corrections before you go for publication. You wouldn’t want to show you don’t understand climate science and embarrass yourself in Nature.
That’s why I applied the inverse barometer adjustment (the graph in the full paper available by subscription shows the inlet pipe shrinking by 2mm/sec, so I had to change the slope slightly to retain funding). Those idiots at the store just handed me a piece of ¼” NPT and pretended I wasn’t a scientist.
Damn, Daniel! You got the bases covered. This is robust.
And to top it off they claim only a 0.4 mm “uncertainty” in the global sea level rate of change estimate. My guess would be more like *at least* a 4 cm uncertainty for global mid-ocean dominated sea level averages determined by satellite. From what I recall, GPS altitude uncertainty is more like 4 m or more, so how can they come up with something better than GPS for middle of the ocean measurements?
Regardless, human activities are not affected by middle of the ocean sea levels and coastal sea levels as monitored by tide gauges are really what matters for interests along coastlines. I suspect the uncertainty of tide gauge annual averages is probably on the order of 4 mm, which means that trends cannot be reliably determined unless the change over a given time period is larger than 4 mm. Greatly underestimating uncertainty seems to be one of many problems in politically corrupted “climate science” these days.
This is really happening?
http://nsidc.org/data/seaice_index/images/daily_images/S_stddev_timeseries.png
If you click on the image it shows this.
2016, 04, 04, 6.082,
2016, 04, 05, 7.959,
And today
2016, 04, 04, 6.082,
2016, 04, 05, 5.799,
2016, 04, 06, 6.310,
ftp://sidads.colorado.edu/DATASETS/NOAA/G02135/south/daily/data/SH_seaice_extent_nrt.csv
Or has the satellite gone crazy?
http://nsidc.org/data/seaice_index/images/daily_images/S_bm_extent_hires.png
Looks like I’ll need to move further North this winter…
I think Robertv wanted this chart
http://NSidc.orG/data/seaice_index/images/daily_images/S_stddev_timeseries.png
You can see a nice uptick.
I capitalized NS and the last G in the initial portion of the URL
http://arctic.atmos.uiuc.edu/cryosphere/IMAGES/seaice.anomaly.antarctic.png
Looks like really, really cold up there to me! Ask Ren.
http://earth.nullschool.net/#current/ocean/surface/currents/overlay=sea_surface_temp_anomaly/orthographic=-303.01,-80.36,300
http://earth.nullschool.net/#current/wind/surface/level/overlay=temp/orthographic=-303.01,-80.36,300
Very high ionizing radiation.
http://neutronm.bartol.udel.edu/realtime/southpole.html
Thanks, for reminders of the powerful forces propaganda artists ignore.
Appeared first wave in the stratosphere in the south.
http://www.cpc.ncep.noaa.gov/products/stratosphere/strat-trop/gif_files/time_pres_WAVE1_MEAN_AMJ_SH_2016.png
“NOAA has 240 tide gauges globally, and 86% of them show less sea level rise….”
I can’t for the life of me…..figured out why this paper is constantly ignored
It’s accurate,,,,even with their error bars….not one single person has disputed it
…and yet, it’s never quoted when the discussion is tide gauges
A full 65% of tide gauges…the majority..show no sea level rise at all….and it’s only the minority of tide gauges that show any sea level rise
http://pluto.mscc.huji.ac.il/~msdfels/wpapers/Tide%20gauge%20location.pdf
That’s because unlike governmental climate scientists you lack scientific fundamentals. Some of these gauges are a “dirty and reactionary source”. Climate scientists know you can’t trust them and if you studied Marx like they did you would have known how to identify the suspect ones.
You can’t use bourgeois scientific methods and expect to be successful in understanding nature. If you want to measure sea levels you must select the progressive gauges even if they are in the minority.
Here is a primer on “active interference” in scientific research:
NOAA’s site says, “…the absolute global sea level rise is believed to be 1.7-1.8 millimeters/year. Note that they are relative sea level trends, and are not corrected for local land movement.”
However, that is somewhat misleading. Although that figure does not adjust for local vertical land movement, they failed to mention that it apparently does include the addition of a 0.3 mm/yr GIA adjustment for the presumed sinking of the ocean floor, due to loading from the meltwater from the great northern ice sheets, which melted ca. 7000 – 10,000 years ago.
If you don’t add that model-derived adjustment, analysis of tide gauge measurements yields a global average rate of sea-level rise of only about 1.4-1.5 mm/yr.
For water mass budget calculations, it is reasonable to add GIA (est. 0.3 mm/yr) to measured rates of sea-level. But the resulting sum (1.4-1.5 mm/yr + 0.3 mm/yr = 1.7-1.8 mm/yr) is not truly sea-level, and is not useful for projecting sea-level for coastal planning. It’s an attempt to calculate what the rate of sea-level rise would be, were it not for the hypothesized sinking of the ocean floor. Unfortunately, NOAA (and many authors) add that adjustment and erroneously report the sum as if it were the actual rate of sea-level rise.
So basically the sea level is rising, but the coasts are also rising. A dumb person like me would measure the rise related to a gauge, but these people like to get bigger numbers by adding sea floor sinking rate. So at Kemi where sea sinks 9mm a year is bad news because it means water will be moving somewhere else and making the sea rise.
I really love this logic, it is so twisted.
Sea floor is crust. Continents are crust. Crust rises and falls. Wouldn’t it be nice if there were a chunk of MANTLE sticking above the sea surface that doesn’t rise and fall?
There is:
http://tidesandcurrents.noaa.gov/sltrends/sltrends_station.shtml?stnid=1612340
Morgan –
On a longer time scale than relevant for climate change discussion on sea level rise, Hawaii does rise and sink.
See 31:05-31:13 of this video: https://www.youtube.com/watch?v=lTRjZQBacaM.
Also 19:05-19:21.
Yes. But on a time scale relevant for climate change discussions on sea level rise, Hawaii does not rise nor sink.
It is the world’s benchmark on sea level changes.
You cannot gauge. global sl rise on any one location.
Yeah, you can.
“You cannot gauge. global sl rise on any one location.”
If you can’t, then it isn’t global sea level.
One location is clearly not global. There are 18 year lunar cycles, decadal variations in ocean currents, etc…
You must be David Appell because nobody else could be so lithocephalic.
Acceleration in the amount that they lie about it.
April 8 will be another attack frosty air in the eastern United States.
http://users.met.fu-berlin.de/~Aktuell/strat-www/wdiag/figs/ecmwf1/ecmwf150f72.gif
…careful-that’s the cherry picking critics of this (and other) sites will leap…
At least NASA is trying to keeps it’s story straight because they also show ice loss mass in Greenland and Antarctica. So at least they are making their lie consistent by answering where the water came from.
Ice-penetrating radar1, 2, 3 and ice core drilling4 have shown that large parts of the north-central Greenland ice sheet are melting from below. It has been argued that basal ice melt is due to the anomalously high geothermal flux1, 4 that has also influenced the development of the longest ice stream in Greenland1. Here we estimate the geothermal flux beneath the Greenland ice sheet and identify a 1,200-km-long and 400-km-wide geothermal anomaly beneath the thick ice cover. We suggest that this anomaly explains the observed melting of the ice sheet’s base, which drives the vigorous subglacial hydrology3 and controls the position of the head of the enigmatic 750-km-long northeastern Greenland ice stream5. Our combined analysis of independent seismic, gravity and tectonic data6, 7, 8, 9 implies that the geothermal anomaly, which crosses Greenland from west to east, was formed by Greenland’s passage over the Iceland mantle plume between roughly 80 and 35 million years ago. We conclude that the complexity of the present-day subglacial hydrology and dynamic features of the north-central Greenland ice sheet originated in tectonic events that pre-date the onset of glaciation in Greenland by many tens of millions of years.
http://www.nature.com/ngeo/journal/vaop/ncurrent/carousel/ngeo2689-f2.jpg
http://www.nature.com/ngeo/journal/vaop/ncurrent/full/ngeo2689.html
https://wattsupwiththat.files.wordpress.com/2016/04/10365en_groenland-eisschild_gfz.png
The tide gauge at Fort Denison in Sydney Harbour has a trend of 0.65mm/year..
I found out the other day that the island has been found to be sinking at 0.49mm/year
That leaves a sea level rise in Sydney Harbour of 0.16mm/ year
Interesting, but also likely false precision. Web search the Palmdale bulge and see how land rise was debated for more then a decade, or maybe still is
I will have to look into it a bit more at some stage.
Rather busy at the moment though.
For those of us used to useful metrics – 0.16 mm = 0.0063″. 6.3 thousandths of an inch. Got a whole set of feeler gauges in the tool box and couldn’t find even one the diameter of an RCH.
tidesandcurrents.noaa.gov/sltrends/MSL_global_trendtable.html
As this link does not work, does anyone have the correct link address?
try
http://tidesandcurrents.noaa.gov/sltrends/sltrends.html
People actually believe that NASA can monitor the height of 80% of the earths water to the millimeter from a height of 300 or 400 miles. I would guess that i could not get a room full of NASA engineers or climate scientists and get that kind of accuracy if they were measuring tub of stationary water. Tidal gauges are based on the observer, and have errors due to factors including the menses effect. They are telling us they can make a measurement of the ocean rise per year that is less than the width of grain of uncooked rice.
Others have mentioned other factors including the pumping of ground water (that is occurring at an alarming rate) and that would include the draining of our inland seas (the great lakes and arial sea) but I wonder if NASA is also taking into account the shrinking of the earth due to the cooling of the magma (which is about .1 of a millimeter per year)
http://www.nasa.gov/topics/earth/features/earth20110816.html
This site is the best class room anyone can have, most of the people who post cite their sources and have a better understanding of earth science than almost another site. I enjoy REN, ANDY55, Gail and others, so please keep posting.
Steve please keep up this site its a ray of reason and sanity in a crazy world.
Dear heavens! What are you saying about NASSA scientists?
Not sure, but I think he means “meniscus”
I don’t think that “menses” has too much to do with it 😉
http://www.merriam-webster.com/dictionary/menses
ok I get, it my typing skills are limited
chuckle.. I always like these type of embarrassing typos..
Its not as if I don’t make enough myself 😉
Web search the Palmdale bulge and see how land rise was debated for more then a decade, or maybe still is. if they could not agree on what was happening in a desert, well then ocean claims are rather meaningless I would go by tide gauges with much greater confidence.
And remember those islands that just miraculously appeared
Who is to say there aren’t bulges happening in the bottom of the ocean, and they are what is causing the very slight maybe trend in sea level.
Meh. Just about anything you build on the coast will be demolished within 50 years, either by storms or developers.
Interesting graph from Bob Tisdale.
https://wobleibtdieglobaleerwaermung.files.wordpress.com/2016/03/bobtisdalglobalsstkc3a4lter032016-e1458069258785.jpg
Hot stuff under east Greenland.. (just like the west Antarctic hot spot)
https://s3.amazonaws.com/jo.nova/graph/polar/arctic/greenland/greenland-heat-crust-geothermal-ngeo2689-f1.gif
http://joannenova.com.au/2016/04/hot-magma-is-melting-greenland-ice-can-windfarms-save-it/#comment-1796542
One possible explanation of the Scandinavian tide gauge anomaly is that the land is still rebounding after the ice melt off following the last ice age. That in itself could account for some of the global sea level rise.
NASA is only doing its part in Mooslim outreach
I thought you knew the 3mm a year is from the satellites. The fact that satellites are increasing at a rate greater than tide gauges has allowed NASA and several other unscrupulous researchers to unscientifically splice them together and report that the sea level rise is accelerating. Of course it is merely the usual problem with calibration that you get when moving from one data capture unit to another. Other scintivists did exactly the same trick in claiming a sea surf temp acceleration out of the sudden instrumentation jump from splicing XBT and Argo despite the obvious subsequent plateau of the Argo data. It’s not our fathers science this, it’s post-modern!
It’s the broken cue stick:
http://www.hyzercreek.com/NatGeoSeaLevel.jpg.jpeg
It is one area that has a long record-the Mediterranean sea: 1 mm/year rise no more no less:
http://tidesandcurrents.noaa.gov/sltrends/global_50yr.htm?stnid=250-011
It is hard to stop the water from flowing from Atlantic to this small pond!
It is uncertain how much GSL (Global Sea Level) has risen the last hundred or so years, mayby 20 cm, mayby 30 cm, but it’s quit certain the sea level has been very stabel the last second thousand of years before the last rise. The last two or tree millenia has not seen such rise or fall within a such short period of time, any ideas?
These scientist are crazy (choose your agitative) , by NASA own admission the satellite has an error of a little less than 10 CM.
http://www.gdgps.net
Then they tell us they can measure to the MM. The theory of large numbers does not apply if you’re measuring device is off by even a MM, you won’t know when your device is correct or not correct so basically every measurement is wrong and your conclusions are wrong.
Source data studies for recent years indicate 1.6 mm/year sea level rise with no acceleration
According to the IPCC (2013), sea levels rose at a rate of 1.7 mm/year (6.7 inches per century) for the 1901 to 2010 period, but 3.2 mm/year (12.6 inches per century) during the 18-year period between 1993 to 2010, a rate similar to that obtained from 1920 to 1950.
—
http://www.climatechange2013.org/images/report/WG1AR5_Chapter13_FINAL.pdf
“It is very likely that the global mean rate was 1.7 mm yr–1 between 1901 and 2010 for a total sea level rise of 0.19 m. Between 1993 and 2010, the rate was very likely higher at 3.2 mm yr–1; similarly high rates likely occurred between 1920 and 1950.”
—
In recent decades the source contribution estimates from published studies add up to half of this claimed rate for 1993 to 2010, For example, the contribution to sea level rise from thermal expansion was 0.64 mm/yr (2.5 inches per century) for the period between 2005-2013 (Llovel et al., 2014, see below). The contribution from the Greenland (GIS) and Antarctic (AIS) ice sheets was 0.59 mm/yr (2.3 inches per century) for the 1992-2011 period (Shepherd et al., 2012). The contribution from global glaciers and ice caps that are not the GIS or AIS was 0.41 mm/yr (1.6 inches per century) for 2003-2010 (Jacob et al., 2012).
—
Llovel et al., 2014
http://www.nature.com/nclimate/journal/v4/n11/full/nclimate2387.html
“Over the entire water column, independent estimates of ocean warming yield a contribution of 0.77 ± 0.28 mm yr?1 in sea-level rise … the deep ocean (below 2,000 m) contributes ?0.13 ± 0.72 mm yr?1 to global sea-level rise” [0.64 mm/yr total].
—
Shepherd et al., 2012
http://science.sciencemag.org/content/338/6111/1183
“Since 1992, the polar ice sheets [Antarctica and Greenland] have contributed, on average, 0.59 ± 0.20 millimeter year?1 to the rate of global sea-level rise.”
—
Jacob et al., 2012
http://www.nature.com/nature/journal/v482/n7386/abs/nature10847.html
“Here we show that GICs [glaciers and ice caps], excluding the Greenland and Antarctic peripheral GICs, lost mass at a rate of 148?±?30?Gt?yr?1 from January 2003 to December 2010, contributing 0.41?±?0.08?mm?yr?1 to sea level rise.”
—
These sources add up to about 1.6 mm/year, which is the equivalent of a little over 6 inches per century. Interestingly, this is the same or slightly less than the rate for the entire 1901 to 2010 period (1.7 mm/year, IPCC), meaning that sea level rise has not accelerated in recent decades according to the summation of source estimates.
Most satellites have decaying orbits. That is, over time they get closer and closer to the Earth. The unwary might interpret this as a rising sea level since the satellite and ocean are slowly approaching each other.
In some satellite orbits you can actually see an 11 year cycle in the length of the orbit. This arises from the high atmosphere rising and falling over 11 years, creating different atmospheric friction.