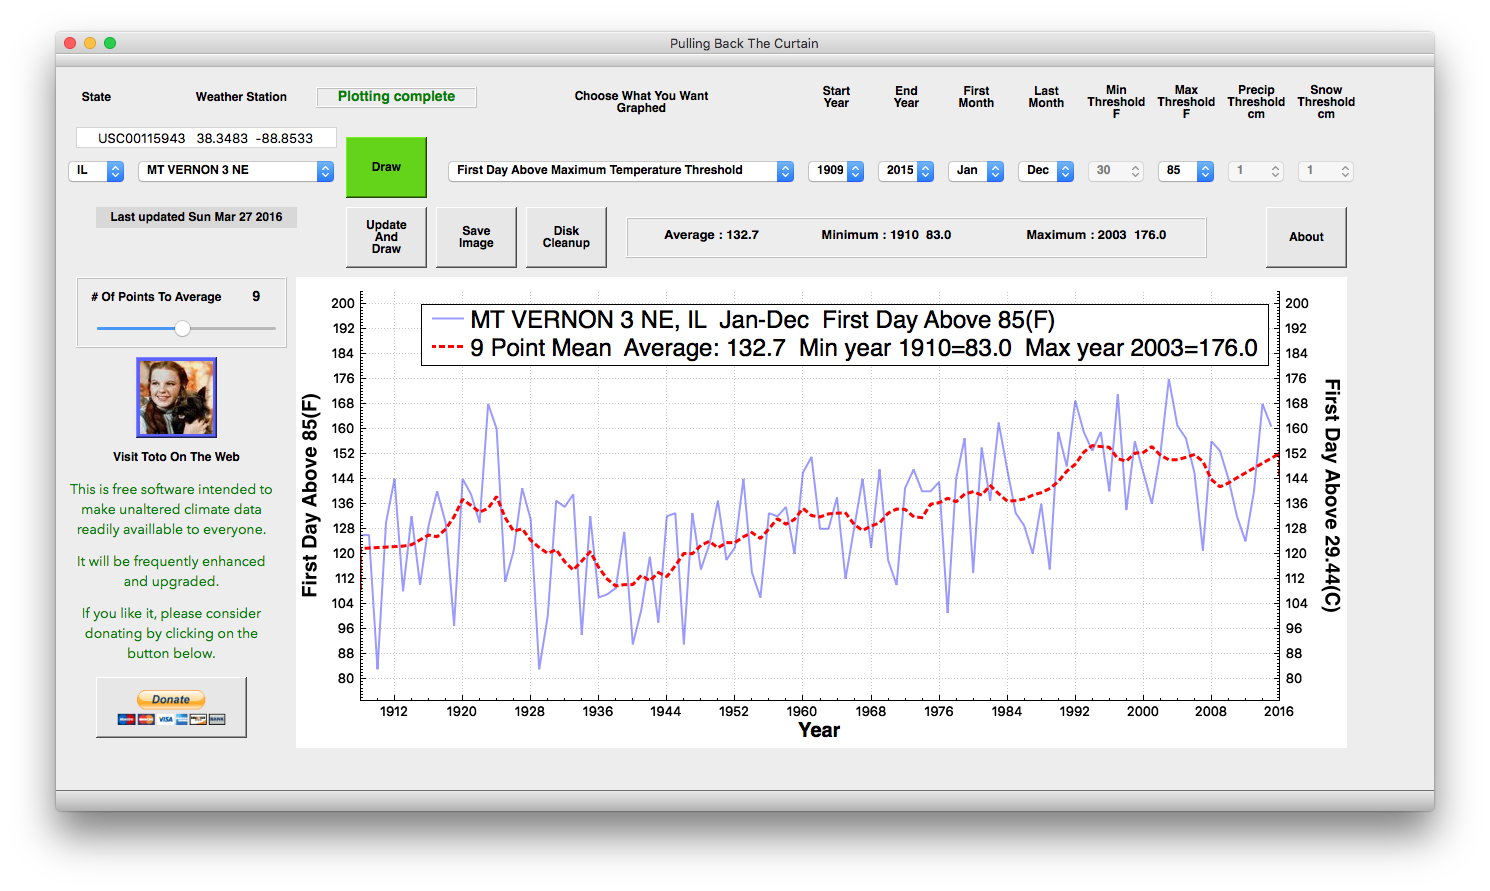
A new release for Windows and Mac. Version 1.10 adds first/last day above the maximum threshold, and first/last day below the minimum threshold. It also dumps out a .csv file of the plotted data in the same directory where it saves the image, which is your Downloads directory.
Mac download :
Windows: download the zip file by clicking here.
Or alternatively replace this file in your current Windows directory:
As always, the software is completely free and contains nothing nefarious. Some people get warnings from their virus protection extortion software.


