NASA shows post-1880 land surface temperature trends increasing from 0.5C warming in 2000 to 1.4C warming in 2016. A massive increase caused primarily by altering the historical record. The past keeps getting cooler.
This massive increase since the year 2000 occurred during a period when satellites showed air temperatures over land decreasing.
Wood for Trees: Interactive Graphs
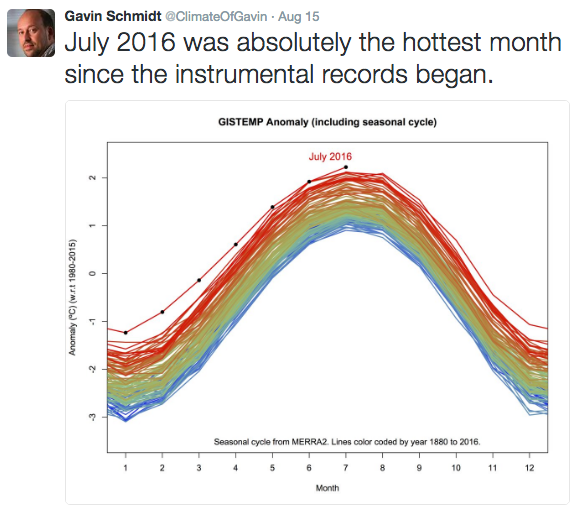
Gavin claims record temperatures, which are the result of data tampering – not global warming.
The observed satellite-data warming pause was killing their theory and reputations, so they simply doubled-down on showing warming by any means. Observations thrashing catastrophe? No problem, just rewrite decades of climate history aaaaand…..voila!
UAH also shows basically ZERO warming from the culmination of the 1998 El Nino effects in 2001 to the beginning of the now-nearly-gone 2015 El Nino
I would really like to know what part of the world actually warmed over the 2001-2015 period.
As most places most certainly DID NOT, there must be some places with massive warming trends.
Can anyone help me with this ?????
I bet its somewhere with very few thermometers. ;-)
It will also be in places where rural temperature stations were shut down and the record had to be scientifically infilled by extrapolation from surrounding urban heat island stations.
I pity the rural residents who have no clue what is going to hit them when a nearby station stops reporting. Without warning, they wake up one day to see their homes engulfed in a heatwave on Gavin’s charts. I mean the first time they know is when it gets reported in the morning program of the local TV station!
We must demand that FEMA starts monitoring the disappearance of the temperature stations and warns these poor folks about the coming disasters, deaths and suffering. It is one of the most robust predictors of coming killer heatwaves!
Again the problem with showing land only data covering only 30% of the earth’s surface for such a short period results in very large errors in the trend linewhich is not representative of the longer term trend.
And satellite dat is more “noisy” than surface temperature data.For land and ocean UAH data from 2001 to 2015 the trend and 2 sigma limits are
0.067 ±0.222
Taking a trend including both the 1998 and 2016 el nino spikes gives a larger, but still not statistically significant warming trend.
0.128 ±0.186
But Hadcrut4 data gives much the same trend, but shows statistically significant warming.
0.129 ±0.114 °C/decade
The trends forBerkeley and NOAA land only data from 1998 to the present
0.215 ±0.242
0.221 ±0.177
The NOAA data shows statistically significant warming.
“Taking a trend including both the 1998 and 2016 el nino spikes ”
All you can do, hey Phlop.
Keep proving me correct :-)
For land and ocean UAH data from 2001 is..
….. negative !!
I repeat, because you so incredibly DENSE.
There has been NO WARMING in the satellite data except that from El Ninos and ocean oscillations.
Any warming in Giss, Hadcrut etc is either from homogenisation to urban heating data, or fabricating or changing past and missing data.
And Berkley , of course, have their “regional expectation”, the catch all warming adjustment ;-)
Depends which UAH version you are using, but again for such a short period, the noie levels and consequent erro margins render any difference statistically meaningless.
http://woodfortrees.org/plot/uah5/from:2001/to:2015/plot/uah5/from:2001/to:2015/trend/plot/uah6/from:2001/to:2015/plot/uah6/from:2001/to:2015/trend
World UAH cooling
World RSS COOLING
Get over it, Phlop.
Essentially no warming in either RSS or UAH World in the periods 1980-1997 and 2001-2015
That is the ZERO trend underlying the El Nino ocean cooling/atmosphere warming events.
And the one place where polar amplification is meant to kick in and is basically unaffected by El Nino events, and where the CO2 level was recently measured at 400ppm has had a COOLING trend for the WHOLE of the satellite record.
Heck, even UAH NoPol had a basically ZERO warming trend this century until the El Nino.
And was actually COOLING before the 1998 El Nino
The problem with looking at short term data sets is that they are not necessarily representative of longer term trends and have large error margins.
With that caveat in mind the global land and ocean trends (°C/decade) and 2 sigma confidence limits for Hadcrut4, NOAA, GISTEMP, Berkeley, RSS and UAH are
0.026 ±0.131
0.076 ±0.128
0.078 ±0.140
0.050 ±0.135
-0.051 ±0.223
0.067 ±0.222
Land only data, Berkeley and NOAA;
0.065 ±0.332
0.075 ±0.237
Problem with looking at anything longer than the periods between major step warming events, is that you prove your ignorance of anything to do with climate
Your forte, Phlop.
“longer term trends ”
Only short term trend are ever likely to be approximately linear.
If you make stupid assumption, you will get STUPID results.
Event such as El Ninos cannot be included in any linear trend.
But your monkeys still keep trying, don’t they.
Maybe you should try to teach them some basic understanding rather than the one trick monkey act you are stuck with.
Trouble with just slapping a ruler across the whole data is that it shows you have no idea what is going on and no intention of ever thinking about what’s going on.
Right, Phlop.
It would be hilarious watching you try to catch a high ball.
You would still think it was going upwards, …
… just as it sconed you between the eyes. :-)
Andy, You cherry pick short term periods which have such large errors they produce no statistically significant information.
El nino events do not create any heat. They release heat which has been going into the oceans into the atmosphere.
Taking a trend from one el nino peak to another does not misrepresent the underlying trend. It simply lengthens the time period, decreasing the error.
There is an underlying warming due to increasing CO2 concentration, which gives an ECS value for UAH data of 2.2 C, within the IPCC range of 1.5 to 4.5 C.
http://www.woodfortrees.org/plot/uah/mean:1/offset/offset/plot/esrl-co2/from:1979/normalise/scale:0.63/plot/uah/trend/offset:-0.03
The graph for UAH 6.0 data is superimp0sed here, with 12 month smoothing to make things clearer. I do not have an algorithm which calculates the version 6.0 trend directly, but it it can be calculated by comparison with the slope of the version 5.6 trend line. The 6.0 slope is 0.83 that of the version 5.6 data, which means the ECS is 1.8 C. But again the difference is negligible given the error for the temperature trends.
http://www.woodfortrees.org/plot/uah5/mean:12/offset/offset/plot/esrl-co2/from:1979/normalise/scale:0.63/plot/uah5/trend/offset:-0.03/to/plot/uah6-land/mean:12/plot/uah6/trend
“Taking a trend from one el nino peak to another does not misrepresent the underlying trend.”
roflmao !!!
What an ignorant assumption, that El Nino peaks would be the same.
You can’t be serious. !! or do you REALLY think that. ?????
Andy, the temperature rise from the baseline of the 1998 and 2016 el ninos are about the same.
The underlying rise is due to AGW.
http://woodfortrees.org/plot/uah6/from/to/plot/uah6/from/to/trend
11 year solar cycles average out over the 37 year period, and sunspot cycles are overwhelmed by the AGW signal since about 1980, when Hnsen’s 1981 model succesfully predicted the AGW signal would emerge from the nturalfluctuations. His model had thre parameters. Solar volcanoes and CO2..
http://woodfortrees.org/plot/gistemp/mean:12/plot/sidc-ssn/from:1880/normalise
But I digress. The fact is that there were other el nino events and la nina events between then and before 1998. Yet you are happy to include those in your cherrypicked short term periods, as shown in the graph here:
http://ggweather.com/enso/oni.htm
roflmao..
AGAIN you prove me correct about your lack of any knowledge of climate systems by slapping a linear trend across the 1998 El Nino step event and trying to link it to CO2.
HILARIOUS. :-) :-)
A monkey with a ruler, nothing more, maybe less.
The 1998 El Nino was the ONLY major warming event in the whole satellite era.
This current one isn’t quite finished, so we don’t know for sure if it will be an atmospheric warming event or not.
The underlying trend is still essentially ZERO.
There is NO CO2 warming signal in the satellite data. Just El Nino and ocean oscillations.
The other minor El Ninos didn’t have any significant atmospheric warming effect.
They didn’t upset the underlying ZERO-warming trend.
Or are you too stupid to see that, as well.
Gees, send me your monkey, its probably got more brains that you !!!
Will be interesting to see where the current El Nino settles down. Sun says cooler.
And the La Nina recharge is going to be very slow. We are entering a period less frequent El Ninos, Most probably a cooling period.
Won’t you have fun making a fool of yourself trying to pass that off as warming ;-)
“which means the ECS is 1.8 C”
It means NOTHING of the sort.
It makes a massive erroneous assumption that CO2 is the only thing driving the temperature.
A VERY STUPID and VERY IGNORANT assumption.
But you are you, so IGNORANCE is all that we expect.
Anyway, the actual underlying trend is that trend BETWEEN the El Ninos steps, which is essentially zero.
NO WARMING from 1980 to just before the 1998 El Nino..
NO WARMING from when that settled down in 2001, until the start of the just subsiding El Nino.
El Ninos release energy from the ocean to the atmosphere, and that energy has ABSOLUTELY NOTHING to do with CO2.
To use those El Nino warming steps to relate to CO2 warming is the height of ANTI-SCIENCE, and displays your total and utter disregard for anything pertaining to reality or honesty.
True, the calculation of the ECS from just the CO2 and emperature data is a first order approximation. But the evidence is that almost all the warming for the last 50 years is from CO2. In fact, there is a diminution in the warming signal from particulate pollution.
“El Ninos release energy from the ocean to the atmosphere, and that energy has ABSOLUTELY NOTHING to do with CO2.”
Where does the energy released come from?
The ENSO cycle has been going on over geological timescales.
Why has not the accumulating warming from “natural” ocean heating cooked the planet, if the warming has not come from warming via increasing CO2 concentration?
“Where does the energy released come from? ”
Surely you are not going to PRETEND its from CO2.
That would be too priceless and hilarious, even from you. :-)
“The ENSO cycle has been going on over geological timescales. ”
So, nothing to do with human released CO2.. thanks for understanding that, at least.. Well done.
“Why has not the accumulating warming from “natural” ocean heating cooked the planet, if the warming has not come from warming via increasing CO2 concentration?”
Seriously ????
Are you really THAT ignorant.
WOW !!!
You really are starting to display your blatant ignorance to the full.
Maybe you are just drunk, or its past your bed time?
Clearly, you cannot answer the question.
ENSO stands for El Nino Southern Oscillation. that’s oscilaation, as in cycle. ENSO giveth and ENSO taketh away. the net contibution to global warming is zero.
Like other natural cycles it is a modulation on the increase in remperature due to increasing CO2 concentration.
Here
http://www.woodfortrees.org/plot/gistemp/from:1958/mean:12/plot/esrl-co2/from:1958/normalise/scale:1/offset:0.35
here
http://static.skepticalscience.com/pics/AMTI.png
and here.
http://www.izvorienergije.com/slike/neobnovljivi_ugljicni.jpg
Have been tapping away here while watching TV but had enough now.
Your bluster, bluff, abuse, capitilizations. emoticons , textspeak gibberish abbreviations etc. cannot cover your lack of scientific argument. and commitment to denailism.
Pathetic really.
I’ll leave you to it.
“modulation on the increase in temperature due to increasing CO2 concentration. ”
There has been NO increase in temperature due to increasing CO2 concentration in the satellite era, we have already established that. Below, thanks to your work, we discovered that ECS = ZERO.
So you are talking nonsense, yet again.
And poor Phlop, know you have lost when you start referencing SKS and pretending that GISS has any meaning except for propaganda purposes.
The “adjustments” to GISS and its family have been shown to be a near perfect match to CO2 rise.
That means that changes in atmospheric CO2 causes changes to past GISS data. R² = 0.98, iirc.
Oh and thanks for highlighting the ABSOLUTELY BENEFICIAL rise of atmospheric CO2.
The world’s plant life is loving it :-)
Poor Phlop, were you watching a comedy show ?
I certainly have been. :-)
“ECS from just the CO2 and temperature data is a first order approximation”
No, its just a nonsense calculation.
Meaningless unless you can discount all other drivers..
But as we have finally got to the FACT that the trend underlying El Nino warming step of 1998 is essentially ZERO..
…. that mean ECS must be essentially ZERO.
We finally got there.. WELL DONE, Phlop. !!! :-)
Here’s the no tricks display of GISS temperature record, in degreees F with changes compared to the range of temperatures experienced each year.
https://rclutz.files.wordpress.com/2016/08/giss-annual-temps3.png?w=1000
Tony, can I ask you a question please? Over at WUWT Lord Monckton has a piece re NASA/GISS/IPCC climate sensitivity issues. He says the IPCC have wildly exaggerated CS.
Over here you show how official climate temperature data has been adjusted in recent years to show a supposed warming trend that’s developed over a period of many decades. If you’re correct then once we remove the artificially introduced ‘warming’ there really has been very little warming that can be attributed at all, let alone all of it to human CO2, and definitely nothing outside of previously-seen natural variation.
You show official satellite data that shows a (very) slight cooling through 2000-2014, just as both total atmospheric and human-emitted CO2 levels have been rising sharply.
In short, if you’re right (and your evidence of deliberate, pro-AGW adjustments is compelling) then CO2 levels have rocketed while overall temperatures have done nothing out of the ordinary.
So here’s my question: once we’ve removed the impacts of those highly suspect adjustments and therefore noted the simultaneous lack of any substantial warming (despite dramatically increased CO2 levels) what does that say about climate sensitivity to CO2, and from there what does low (or even zero?) sensitivity say about CAGW theory?
I don’t see any reason to believe that increasing CO2 has a significant effect on temperature.
Pingback: Visualizing Gavin’s Temperature Fraud | world watch web
Goddard claims that Gavin Schmidt has fraudulently altered the temperature data because adjustments to land only temperature data increases the rise from 0.5 C between 1880 and 2000 to 1.5 C between 1880 and 2016 .
He picks the data that maximises the change resulting from the adjustment process, the 2000 and 2016 data. He is not interested in the differences from the 1987 to 2016 data, or even the 2012 data. (Figure 4 here.)
http://data.giss.nasa.gov/gistemp/history/
Again Goddard measures temperature changes by taking the difference between only two data points, the first and last, neglecting the noise involved. He does not use temperature trends taking in all the data points, which is what a scientist would do to reduce the error.
So his end point in 2001 is at the bottom of a la nina trough and the 1880 start point near the top of a noise peak. The difference is 0.5 C
The adjusted starting point for 2016 is 0.2 C lower, but the final 2016 temperature is on the 2016 el nino spike, so the difference is 0.15 C.
He does not mention the global land and ocean data, where Gavin seems to have slipped up if his intention was to manipulate the data to increase the global warming signal. (Fig 2.)
The start point for 2016 adjustment data is higher than for the other data. Adjustment have increased the start point compared to 1987 adjustments by 0.3 C, reducing, not increasing the overall rise in temperature.
But the fact is that the atmospheric land and ocean temperature change over a century is already 1 C, (1.5 C land only) so an adjustment process which attempts to correct early uncertain data by decreasing the change by 0.3 or increasing by 0.2 C at most over 136 years is within other uncertainties, and has no real effect effect on AGW theory.
Need your eyes checked. Or perhaps open the one perpetually closed.
Point approx. 1965 stays stationary.
Everything below that is dropped, the further away, the bigger the drop.
Everything above is increased in the same manner.
Extra trend is thus FABRICATED in all the data.
Even a monkey could see that… better go fetch one for some assistance, Phlop.
Andy, I am discussing the time periods nominated by Steve Goddard.
Phlop has comprehension issues.
And the overall change which for land and ocean data, which is what people discuss when talking about changes in global atmospheric temperature and global warming, where the adjustment process reduces the change in temperature by 0.3 C .
This is an odd form of fabrication if the intention is to exaggerate AGW.
The top graph clearly has a FABRICATED increase in trend from version to version.
End of story.
Why fabricate a reduction in the temperature if you want to exagerate AGW?
The trend INCREASES with each iteration…
… or are you too blind drunk to see that.
Why fabricate a reduction? I remember why Karl et al did so. The “pause” was continuing so long that it was becoming embarrassing to the CAGW crowd. It was (in my opinion) a calculated PR move to slightly reduce the already-exaggerated warming trend and include a tweak that erased the pause at the same time. The value of claiming “look, there never was a pause!” outweighed the cost of a reducing a small amount off an already erroneous warming trend.
It might be more logical to conclude that it was the priority to remove the highly embarrassing 1998+ pause in time for COP21 at the behest (silent or otherwise) of Obama. Sacrificing a smidgen of long term warming was pretty irrelevant. COP21 could not possibly have credibly proceeded to an agreement in the presence of nearly 2 decades without any demonstrable warming.
Hey Mr Grim Nasty! I wish I had read your comment before I posted my comment above — I could have saved some typing. :)
You make a good point about the timing of the change correlating with COP21!