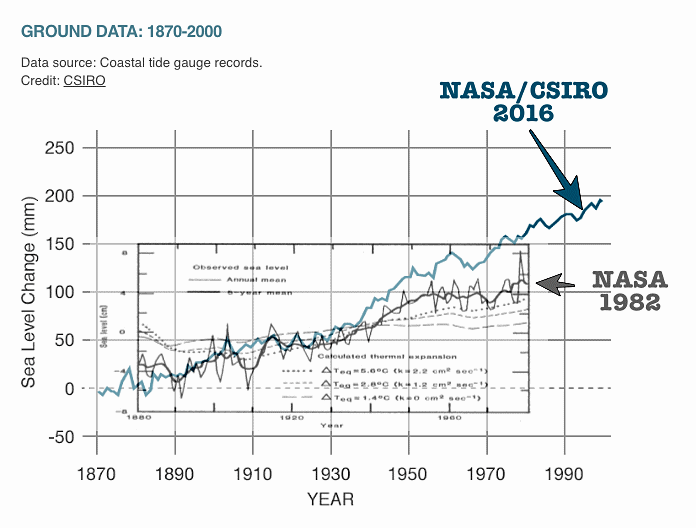
In 1982, NASA showed about 10 mm of sea level rise from 1955 to 1980. Now they show almost 40 mm of sea level rise during that same period. They quadrupled recent sea level rise by altering the data, or perhaps went back in time and took some new readings.
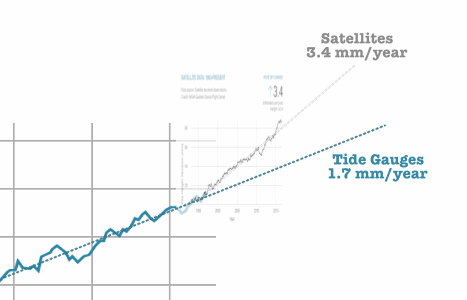
But quadrupling sea level rise wasn’t enough for NASA experts, so in 1993 they switched over to satellite measurements, which immediately doubled their already quadrupled sea level rise. Satellite orbits decay over time, and it doesn’t require a lot of decay to bring them 1.7 mm closer to earth over the period of a year.
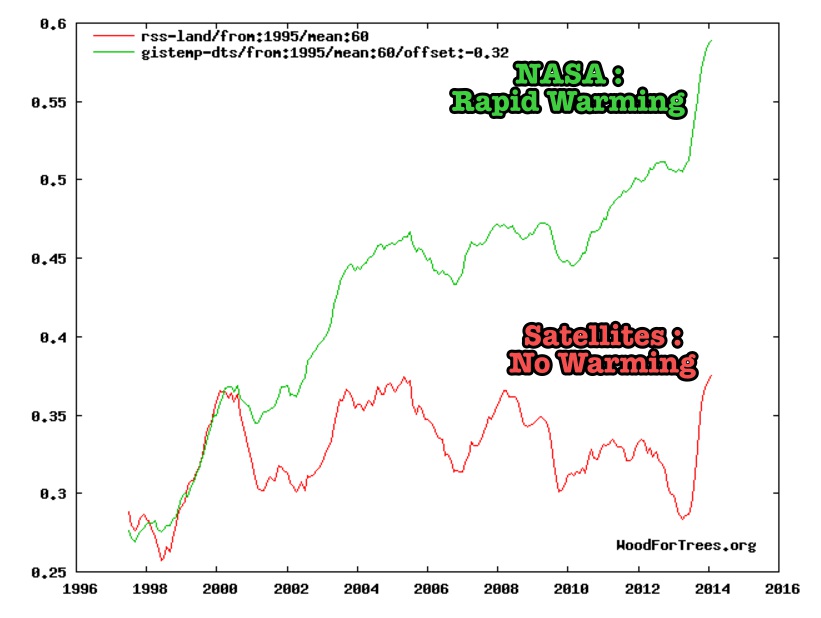
NASA is the same agency which ignores satellite temperature data, because it doesn’t suit their global warming agenda. Satellites are only used when supportive of their agenda, and only for measurements which are most subject to decay errors.
Wood for Trees: Interactive Graphs
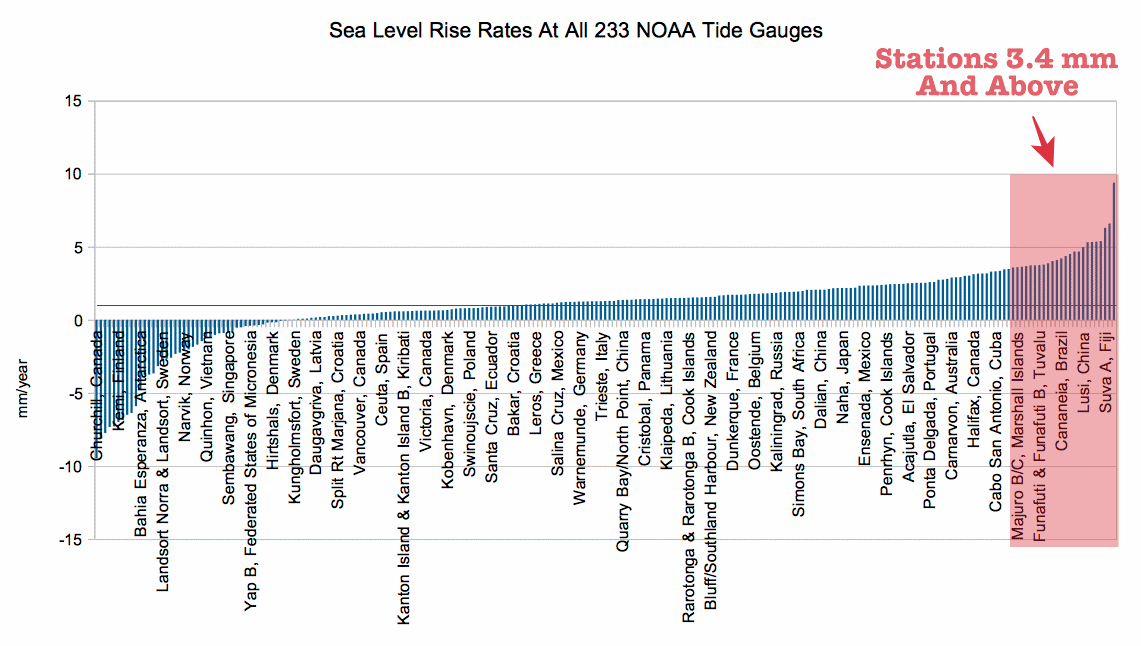
The net effect of their data tampering is an 800% increase in sea level rise. Ninety percent of NOAA tide gauges are below NASA’s claimed 3.4 mm/year, and the average of all tide gauges is only about one mm/year.
Sea Level Trends – MSL global stations trends table
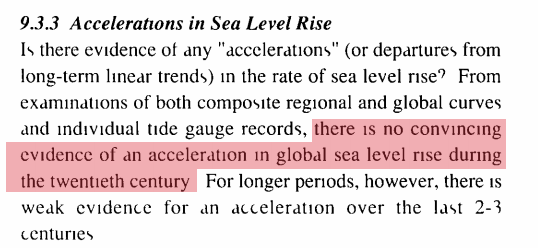
The 1990 IPCC report said sea level rise rates did not accelerate during the 20th century.
NOAA says sea level is rising half as fast as NASA claims.
absolute global sea level rise is believed to be 1.7-1.8 millimeters/year
NASA’s claims about sea level rise don’t stand up to any scrutiny, but they generate revenue for the climate community – so they breeze through peer review.

