The True Climate Deniers

Like Holocaust deniers, a climate denier is someone who tries to erase climate history.

screen-shot-2016-12-01-at-4-44-30-am-down

Average Arctic temperature in Svalbard ‘could end up above freezing for first time in history’ | The Independent

Svalbard was just as warm or warmer 60 years ago. Climate alarm is created by erasing or altering history.

screen-shot-2016-11-29-at-3-32-03-am-down

02 Mar 1954 – Canadians to Move Town Threatened by Thaw

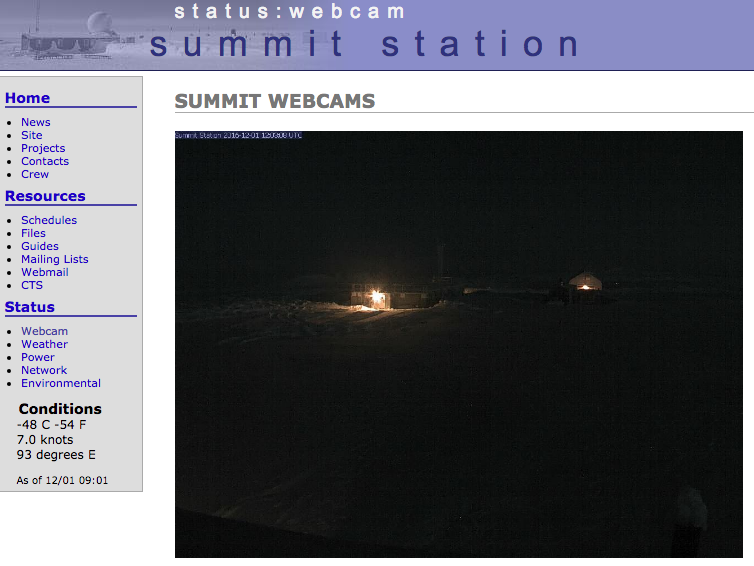
Writers who believe the Arctic is warm should be sent to live there, and survive off solar power.

screen-shot-2016-12-01-at-5-02-24-am

summit:status:webcam

 The Independent also says snowfalls are a thing of the past.

screen-shot-2016-12-01-at-5-11-33-am-down

Snowfalls are now just a thing of the past – Environment – The Independent

This entry was posted in Uncategorized. Bookmark the permalink.

48 Responses to The True Climate Deniers

  1. 2hotel9 says:

    People really hate it when I link them to NSIDC current image of Arctic Sea ice. Puts the lie to all their envirowackism.

  2. gator69 says:

    Another denier converted…

    It made sense. Knowing that CO2 is a greenhouse gas and that our industrialized world is adding a large amount of it to the atmosphere on a yearly basis, I accepted the premise that this would cause global temperatures to rise. But one day about 7 years ago, I looked at the ubiquitous graph showing the “global” temperature of the last 150 years and noticed something odd. It was subtle, and as I found out later, disguised so that it would be overlooked. There appeared to be a period of about 40 years between 1940 and 1980 where the global temperatures actually declined a bit. As a data analysis expert, I could not ignore that subtle hint and began to look into it a little more. Forty years is a long time, and while carbon dioxide concentrations were increasing exponentially over the same period, I could not overlook that this showed an unexpected shift in the correlation between global temperatures and CO2 concentrations. Thus I began to look into it a little further and here are some of the results 7 years later.

    http://www.dailywire.com/news/2071/most-comprehensive-assault-global-warming-ever-mike-van-biezen

    At the end of the piece, he has a number of graphs that will be familiar to the regulars here.

    • dave1billion says:

      An excellent article.

      Thanks for the post.

    • Caleb says:

      It is good to see others taking up the banner, but I have to give our host huge credit for plugging along year after year when pointing out the “adjustments” was unpopular and a good way to get mud slung at you. The reason the graphs are “familiar to us” is because Tony pointed them out over and over and over again. The usual suspects would scoff and scorn, and attempt to tell “the lie” so many times it became a quasi-truth, but over and over and over Tony would respond by bringing up the same old graphs.

      Truth doesn’t change, and is hard as a diamond, and by bringing up the Truth so many times “the lie” gradually frayed and wore thin. But what would have happened if Tony hadn’t persisted?

      We may be glad to see others jump on the bandwagon, but let us never forget the fellows who took the heat when the bandwagon went the other way.

  3. Someday Google will tell tourists in Boulder to “turn north onto Heller Lane, proceed 4 blocks then turn east on Beckmann Boulevard past Von Neumann Park to Orwell Cove.”

  4. Latitude says:

    Svalbard was just as warm or warmer 60 years ago…..

    Of course, it was another AMO high

  5. I live in Florida where we have alligators.

    It must have been much warmer than 60 Fahrenheit when alligators lived there:
    http://schools-wikipedia.org/wp/s/Svalbard.htm

    “Millions of years ago, Svalbard experienced much warmer climates and was forested, even though it was located at around the same latitude as at present. For a phase of several hundred thousand years at the boundary between the Paleocene and Eocene (55 million years ago), Svalbard experienced subtropical temperatures with palms and alligators. Although not generally as warm as this, Svalbard remained mild enough temperatures for forest through most of the Cretaceous and early Tertiary period up until at least 30 million years ago. In February 2008, the University of Oslo announced the discovery of the largest dinosaur-era marine reptile ever found – a pliosaur estimated to be almost 15 m (50 ft) long ( Pliosaur discovered – Science daily).”

    • Gail Combs says:

      I live just north of where NC has alligators by about 30 to 50 miles.

    • Rud Istvan says:

      The wiki is wrong about Svalbard. About 350 mya it was located roughly at the equator. Since then the archipelago has drifted steadily north to its present location thanks to plate tectonics. Svalbard’s coal deposits and associated fauna date to the Eocene maximum ~65 mya. At that time Svalbard was significantly further south (about latitude N55, roughly between Manchester and Edinburgh). Climate would have been very different at ~N55 then. Antarctica was not yet over the south pole and was unglaciated. As a result global sea level was about 100 meters higher than today. Greenland was only beginning to separate from Scandinavia; Framm Strait did not exist. Atlantic was ~1/3 narrower. There was a large ocean gap between North and South America (the Panama Isthmus did not close until ~2.5mya, and many geologists think this change in ocean circulation is what triggered the Pleistocene Ice Ages). So direct inferences about actual N80 Arctic conditions then using Svalbard geology/paleontology are beyond suspect. They are bogus. Wiki is sometimes a research start, but one must always verify with actual sources as it is very unreliable. This example shows how much even oncerning basics.

  6. Andy DC says:

    I hear that due to Trump created climate change, they are planning to have year round night golf at the Greenland Country Club.

  7. Anto says:

    Hey Tony,
    Take a look at this – very useful tool to show the complete lack of sea level rise:
    http://www.brisbanetimes.com.au/queensland/watch-queensland-grow-over-three-decades-20161201-gt1mkd.html

  8. Steve Fraser says:

    Somebody should let them know that the polar vortex is shifting, and that the daytime temps are about to drop waaaaay under 0C. The winds will also push ice their way…

    • Griff says:

      But at the moment there is no sea ice extending to Svalbard…

      It arrived late last year and is now becoming overdue this year – it needs to arrive in December or female polar bears can’t reach their denning sites…
      (so Susan Crockford states)

      • AndyG55 says:

        “But at the moment there is no sea ice extending to Svalbard…”

        Aren’t they lucky. !!

        You know nothing about polar bears. They survived right though the period of often ZERO summer sea ice in the first 3/4 of the Holocene.

      • Steve Fraser says:

        Griff… True, no ice on the Svalbard coast right now, it has actually been moving away for the last week, but the temps there are dropping, and the winds are shifting.

  9. Griff says:

    I don’t believe it was just as averagely warm in Svalbard 60 years ago

    This paper covers the developments in temperature in Svalbard from 1900

    https://www.hindawi.com/journals/amete/2011/893790/

    It clearly demonstrates warming in the last 2 decades unrelated to AO.

    • AndyG55 says:

      Yes, it called an El Nino WEATHER event

      Do try to learn something, sometime, you ignorant twerp.

    • Latitude says:

      It clearly demonstrates warming in the last 2 decades unrelated to AO.
      ===
      Griff, the more you post…the clearer it is that you really don’t understand anything you’re posting

      …not AO…..try AMO
      Of course it was unrelated to the AO

    • AndyG55 says:

      “It clearly demonstrates warming in the last 2 decades unrelated to AMO.”

      No it doesn’t.

    • AndyG55 says:

      “It clearly demonstrates warming in the last 2 decades unrelated to AMO.”

      Change from prop driven aircraft to jets wouldn’t have any affect , would it. ;-)

    • AndyG55 says:

      Love it when Griff doesn’t bother reading anything

      “The huge warming of the Arctic in the decades before the 1940s is often called “early 20th century warming” and is one of the most spectacular climate events of the twentieth century [20]. In the next period (1943–1965), all stations tend to show negative trends in annual temperatures. The cooling was particularly strong (1.5–1.8°C per decade in the composite Ny-Ålesund and Svalbard Airport series) during the winter season. ”

      The 1940’s peak re-established.. THANKS Griff

      You continue, with your idiocy and ignorance, to be one of our best weapons against the AGW scam :-)

    • Caleb says:

      Svalbard has been in the middle of a mild flow which has transported a lot of heat from the Atlantic to the Pole, where there is no sunshine and where the “heat” (actually below freezing by then) is lost to outer space. Although Svalbard may have higher temperatures and the growth of sea-ice may be slower, the result of this flow is a big loss, in terms of the earths heat budget.

      Meanwhile he cold displaced from the Pole settled south over Eurasia which has had record cold in November, and where the snow has fallen deeply further south than normal. The sun does shine that far south, so this snow-cover reflects heat, and again we see a big loss, in terms of the Earth’s heat budget.

      The snow that fell over Saudi Arabia the last week in November may have melted in six hours, but during those six hours Saudi Arabia reflected more heat than the sunless expanses north of the Arctic circle will reflect in sixty days, in the depth of winter darkness. This makes a mess of the albedo theory, which is so concerned about less sea-ice.

      My own take is that the loopy jet is likely due to the “Quiet Sun”, and not CO2.

      It will be interesting to simply observe as winter proceeds. Those who think they understand what we have never seen before are deluded. We are at the frontier of things we have not seen with our modern satellites, and it will be very wonderful to be witnesses. (We have never seen, with satellites, either the AMO turn cold, or the sun go Quiet.)

      https://sunriseswansong.wordpress.com/2016/11/15/arctic-sea-ice-another-mild-surge/

  10. Gail Combs says:

    Chasing a Rabbit…
    Griff and Andy sent me off chasing a rabbit. The rabbit was the warmer Arctic and the much colder Siberia.

    Vukcevic on many occasions mentioned there are not only two North Poles, but that they are galloping off from Canada to Siberia.

    NASA agrees.

    …The [north] pole kept going during the 20th century, north at an average speed of 10 km per year, lately accelerating “to 40 km per year,” says Newitt. At this rate it will exit North America and reach Siberia in a few decades…. Earth’s magnetic field is changing in other ways, too: Compass needles in Africa, for instance, are drifting about 1 degree per decade. And globally the magnetic field has weakened 10% since the 19th century… Sometimes the field completely flips. The north and the south poles swap places. Such reversals, recorded in the magnetism of ancient rocks, are unpredictable. They come at irregular intervals averaging about 300,000 years; the last one was 780,000 years ago. Are we overdue for another? No one knows….

    • Gail Combs says:

      That magnetic Rabbit lead to a whole host of very interesting papers related to climate.

      First is what is causing the wandering and changes in strength?
      The generally accepted explanation is the earth has an iron core with molten rock surrounding it and that molten rock causes the changes. However there are other theories out there.

      First, the sun and the earths orbital changes change the earth’s magnetic field:
      Paleoclimatic context of geomagnetic dipole lows and excursions in the Brunhes, clue for an orbital influence on the geodynamo?

      Abstract

      The hypothesis of an influence of the astronomical precession on the geodynamo energy budget was recently reappraised by theoreticians…Three sets of complementary indicators are however available: 1) records of the direction of magnetization in sediments, 2) records of magnetic anomalies of the deep sea floor basalts and 3) records of production variations of cosmogenic isotopes from sediment and ice cores. These records confirm the genuine geomagnetic origin of paleointensity lows and their narrow link with excursions or short reversals recorded in various materials and often dated by radiometric methods. The analysis of these time series and their comparison with δ18O records of the paleoclimate suggest that such globally recorded geomagnetic dipole lows have preferentially occurred in the context of interglacial or transitional paleoclimates at the time of low or decreasing obliquity…. An important implication of this topic is that the next geomagnetic dipole low should be related with the present interglacial.

      A second more interesting paper suggests it is the ocean currents that move the earth’s magnetic field… Or maybe it is the magnetic field that moves the ocean currents.

      Secular variation of the Earth’s magnetic field: induced by the ocean flow?

      Abstract
      Secular variation of the Earth’s main magnetic field is believed to originate in the Earth’s core. (The main field is operationally defined as comprising spherical harmonics of degree l≤10.) I propose a different mechanism….. This proposal is supported by calculation of secular variation using the induction equation of magnetohydrodynamics, the observed main field and the ocean flow field. The predicted secular variation is in rough agreement with that observed. Additional support is provided by the striking temporal correlation (hitherto unsuspected) between the intensity of the North Atlantic oceanic circulation and the rate of secular variation in Western Europe; this explains, in particular, the geomagnetic jerks, and the recently discovered correlation between secular variation and climate. Spatial correlation between ocean currents and secular variation is also strong.

    • Gail Combs says:

      Speaking of oceans and geomagnetic forces there is this eye opener.
      Magnetic effect on CO2 solubility in seawater: A possible link between geomagnetic field variations and climate

      Abstract
      [1] Correlations between geomagnetic-field and climate parameters have been suggested repeatedly, but possible links are controversially discussed. Here we test if weak (Earth-strength) magnetic fields can affect climatically relevant properties of seawater. We found the solubility of air in seawater to be by 15% lower under reduced magnetic-field (20 μT) compared to normal field conditions (50 μT). The magnetic-field effect on CO2 solubility is twice as large, from which we surmise that geomagnetic field variations modulate the carbon exchange between atmosphere and ocean. A 1% reduction in magnetic dipole moment may release up to ten times more CO2 from the surface ocean than is emitted by subaerial volcanism.

      So not only temperature but variations in the magnetic field determine the solubility of CO2 in water.

    • Gail Combs says:

      Work has also been done on correlating Geomagnetic changes over thousands of years.

      Geomagnetic moment variation and paleomagnetic excursions since 400 kyr BP: a stacked record from sedimentary sequences of the Portuguese margin

      Abstract

      A paleomagnetic study was performed in clayey-carbonate sedimentary sequences deposited during the last 400 kyr on the Portuguese margin (Northeast Atlantic Ocean). Declination and inclination of the stable remanent magnetization present recurrent deviations from the mean geomagnetic field direction. The normalized intensity documents a series of relative paleointensity (RPI) lows recognized in other reference records. Three directional anomalies occurring during RPI lows chronologically correspond to the Laschamp excursion (42 kyr BP), the Blake event (115–122 kyr BP) and the Icelandic basin excursion (190 kyr BP). A fourth directional anomaly recorded at 290 kyr BP during another RPI low defines the ‘Portuguese margin excursion’. Four non-excursional RPI lows are recorded at the ages of the Jamaica/Pringle Falls, Mamaku, Calabrian Ridge 1, and Levantine excursions. The RPI record is characterized by a periodicity of ∼100 kyr, paleointensity lows often coinciding with the end of interglacial stages. This record sets the basis of the construction of an authigenic 10Be/9Be record from the same sedimentary sequences [Carcaillet et al., this issue].

      Do you get this Griff?
      RPI = “a series of relative paleointensity lows”
      And what does the series tell us?
      The RPI record is characterized by a periodicity of ∼100 kyr, paleointensity lows often coinciding with the end of interglacial stages.”

      If you did not you can read this Climatic and oceanographic changes in the Northeast Atlantic reflected by magnetic properties of sediments deposited on the Portuguese Margin during the last 340 ka

      Abstract

      Rock magnetic parameters measured… off the Portuguese Margin, related to other proxy-climatic data, have been used to reconstruct magnetic mineralogical changes of, in relation to environmental and climatic conditions over the North Atlantic, Western Europe and Northwest Africa during the last three climatic cycles (since isotope stage 10)….Spectral analyses of the rock magnetic signals reveal Milankovitch periods at 100 and 41 ka, confirming the relationship with long-term climatic changes at high latitudes….

      And this:
      Paleoclimatic context of geomagnetic dipole lows and excursions in the Brunhes, clue for an orbital influence on the geodynamo?

      Abstract

      The hypothesis of an influence of the astronomical precession on the geodynamo energy budget was recently reappraised by theoreticians…Three sets of complementary indicators are however available: 1) records of the direction of magnetization in sediments, 2) records of magnetic anomalies of the deep sea floor basalts and 3) records of production variations of cosmogenic isotopes from sediment and ice cores. These records confirm the genuine geomagnetic origin of paleointensity lows and their narrow link with excursions or short reversals recorded in various materials and often dated by radiometric methods. The analysis of these time series and their comparison with δ18O records of the paleoclimate suggest that such globally recorded geomagnetic dipole lows have preferentially occurred in the context of interglacial or transitional paleoclimates at the time of low or decreasing obliquity…. An important implication of this topic is that the next geomagnetic dipole low should be related with the present interglacial.

    • Gail Combs says:

      A few more papers on the subject:

      Correlations between Ocean Water Temperature and Related Parameters from the Victoria Experimental Network under the Sea (VENUS) and Geomagnetic Activity: Implications for Climate Change

      Are there connections between the Earth’s magnetic field and climate?

      The Author of this paper links to a large number of papers.

      ABSTRACT
      Although there are powerful models that couple human activity with elevated atmospheric carbon dioxide levels and global warming, the relationships are still based upon correlations rather than causation. Consequently, there is always the probability of a third factor that produces both. Analyses of the diminishing magnetic dipole moment of the earth and the increased carbon dioxide levels and global temperature within the last 40 years revealed correlations of -0.99 and -0.90, respectively. This powerful association has been reported by other researchers. Why it has been ignored by the scientific community is not clear. The sources of the shift in average geomagnetic (magnetic dipole) intensity have not been identified but these relatively rapid decreases and increases have occurred historically with onsets of periods of warming and cooling, including glacier formation. If the long-time quasi-periodicity of the earth’s magnetic dipole moment is coupled to alterations in solar activity as the system moves around the galactic center, then attribution of elevated carbon dioxide-temperature to human sources rather than actual etiologies can be counterproductive to adaptation.

    • Gail Combs says:

      Final a bit of Vukcevic’s work

      Arctic Temperature Anomaly

      Atlantic Multidecadal Oscillation

      Geomagnetic Field Fz

      The Earth’s magnetic field is in a permanent flux, the overall strength of the field has been gradually declining during last 150 years.
      South Hemisphere’s magnetic field’s maximum strength is concentrated in a single area and its decline has been relatively even, while the NH magnetic distribution is more complex, its maximum strength is split between two areas, thousands of miles apart, one is located in the general area of Hudson Bay and the other in the central Siberia, north of Baikal Lake.

      The Beaufort Gyre system plays a flywheel role and stabilizes the climate of the entire Arctic region (WHOI). It is not known if the GMF changes are an indicator of the Beaufort Sea circulation of both warm and cold currents and in turn the ice formation, which is subsequently transported through Fram strait along East Greenland coast….
      http://www.vukcevic.talktalk.net/NFC1.htm

      • Latitude says:

        Great stuff Gail!…thank you!

        • Gail Combs says:

          It is a really interesting Rabbit Hole and one that is not discussed except by Vukcevic.

          There are a lot of other papers BTW.

          One thing is for sure, we don’t even know what all the parameters affecting climate are yet. Not by a long shot.

  11. john says:

    “The judgments pronounced at Nuremberg have only a relative value. The vanquished were judged by their victors. There was not the least possibility of appeal. Articles 19 and 21 of the Statutes of this political tribunal cynically gave it the right of not having to have solid proof, they even validated hearsay evidence.[20] All the other trials for “war crimes” have, as a result, been inspired by the legislation at Nuremberg. The trials of witches and sorcerers through the centuries used to proceed in such a manner.” http://Www.ihr.org

    • RAH says:

      So who was sentenced that was innocent?

    • Shooter says:

      You’re citing the Institute for Historical Review? Whose backers include Islamic apologists, such as the Iranians and Saudis?

      • gator69 says:

        Yep! From John’s link…

        Because the atrocity story that the Third Reich exterminated six million Jews has been the root cause of the most monstrous peace treaty in history, because it continues to blackmail billions of unjust reparations to the promoters of the atrocity story, and because it continues to generate hatred and lies and perjuries, it must have the top priority of Revisionism. A few courageous historians like Prof. Paul Rassinier, Dr. Arthur R. Butz, the Jewish Concentration Camp survivor Josef Burg (Munich) and Richard Harwood, Heinrich Haertl, lately Hellmut Diwald, in part David Irving, are beginning to give evidence that the story of the six million exterminated Jews is both the most enormous and the most brazen and unfounded lie in all of recorded history. Dr. Butz called his blockbusting breakthrough The Hoax of the Twentieth Century. After 239 pages of evidence he concluded flatly, “The Jews of Europe were not exterminated and there was no German attempt to exterminate them.”

        Nice! A holocaust denier and anti-semite. There is not a borehole deep enough to adequately bury John, and his filth.

    • Colorado Wellington says:

      Get back Jojo, go home
      Get back, get back.
      Get back to where you once belonged …

  12. john says:

    “Who is a liar but he that denieth that Jesus is the Christ? He is antichrist, that denieth the Father and the Son.”
    1 John 2:22

  13. TA says:

    gator69’s “dailywire.com” link was excellent.

    It makes a very good case for it being as warm or warmer in the 1930’s than it is today, it shows the elevated temps were worldwide, and it shows how the historical temperature records were doctored into a false representation of reality, by people with a political agenda.

Leave a Reply to Caleb Cancel reply

Your email address will not be published. Required fields are marked *