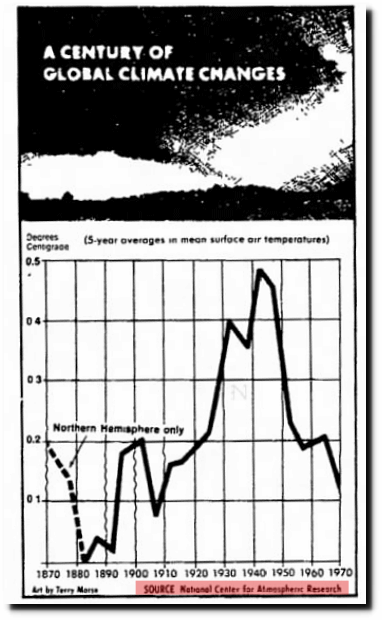
Official government temperature graphs used to show no net warming from 1870 to 1970, and about 0.5C cooling from 1940 to 1970.
14 Jul 1974, Page 1 – Lincoln Evening Journal
NASA/NOAA have been steadily wiping this post-1940 cooling out, and now have completely erased it.
https://data.giss.nasa.gov/gistemp/graphs/
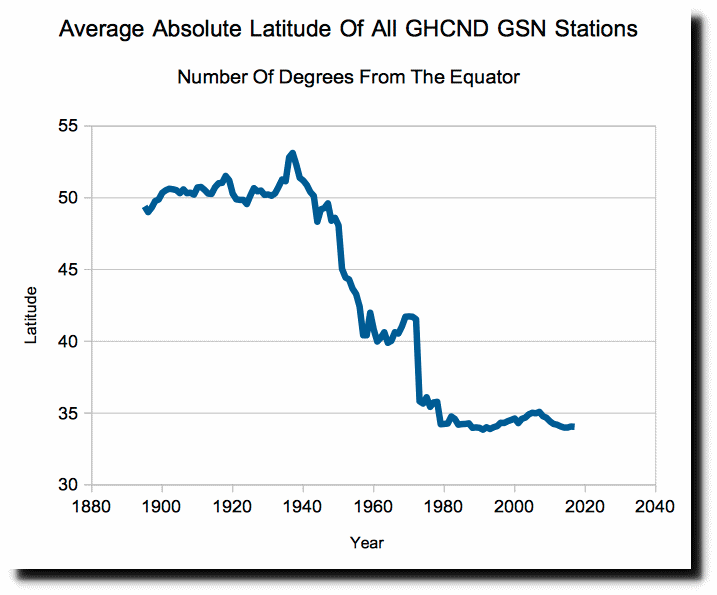
They accomplished by changing the stations that were being used. Between 1940 and 1970, the average latitude of GHCN/GSN stations with daily temperature data linearly moved more than 20 degrees closer to the equator. This introduces a huge warming bias and allowed them to commit the biggest scientific fraud in history.
ftp://ftp.ncdc.noaa.gov/pub/data/ghcn/daily/ghcnd_gsn.tar.gz
In 1940, the set of GSN daily stations was heavily dominated by Russia, with almost no stations in Asia, Africa, Canada, South America, Antarctica, Middle East, China or Greenland, and few in the US, Australia or Europe. The temperature record from NOAA/NASA is a complete farce.


