Springtime Recreational Opportunities In The Overheated, Melting Arctic

“We’ll know our disinformation program is complete when everything the American public believes is false.”

  • William Casey  CIA Director 1981

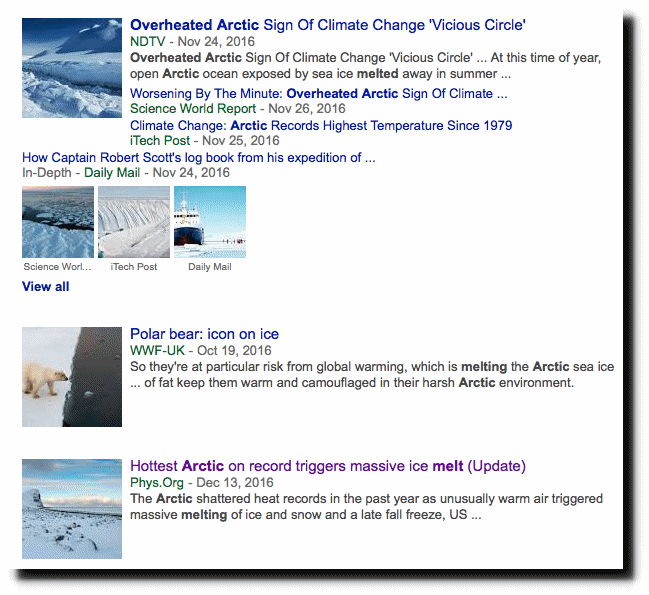
Experts tell us that the Arctic is overheated and massively melting.

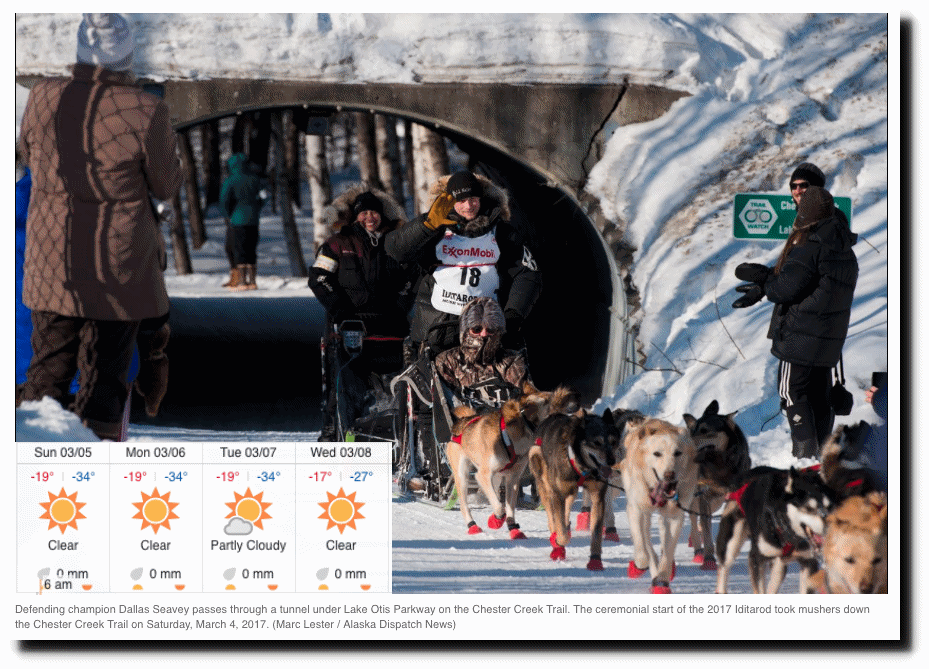
This opens up lots of recreational opportunities, like dog sledding at -34C

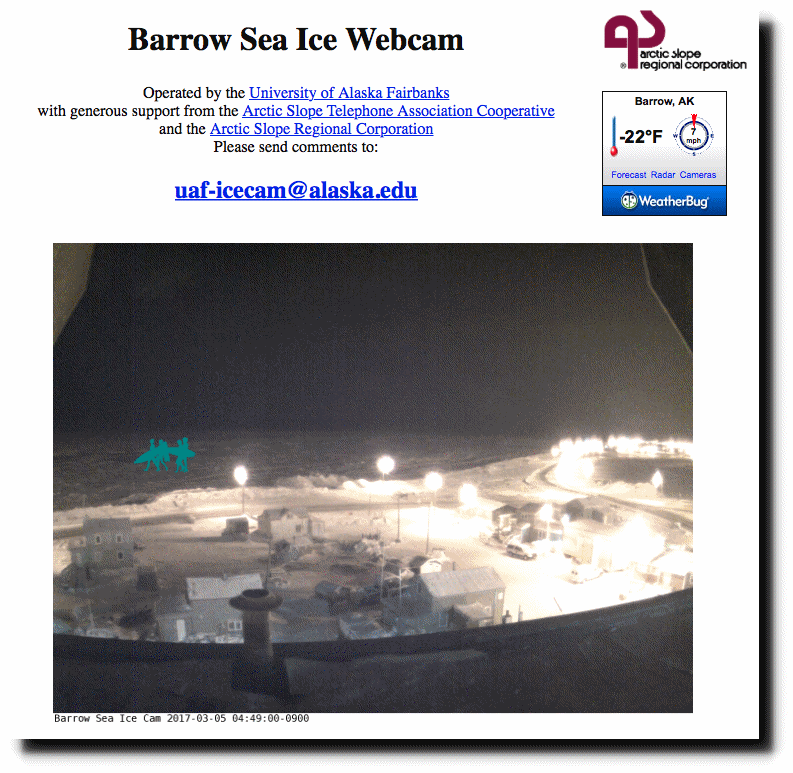
Surfing at -22F is another option.

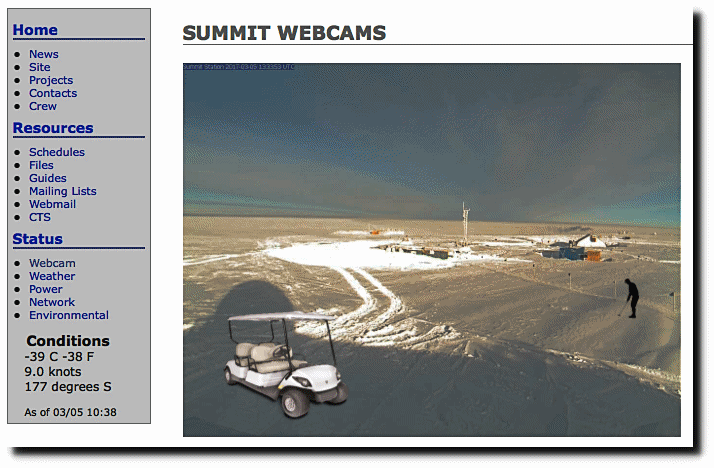
The golfing is fine at -39C.

summit:status:webcam

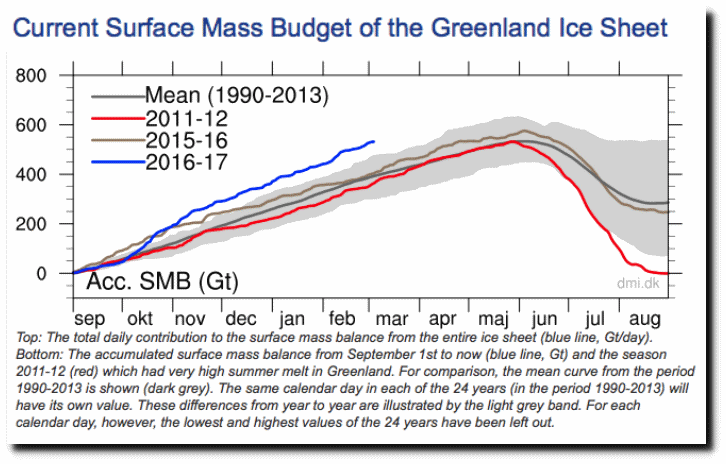
Greens conditions are excellent, with a record 530 billion tons of new ice this winter.

Greenland Ice Sheet Surface Mass Budget: DMI

Almost everything you hear about climate from the press and government scientists is fraudulent. It is time to drain the swamp.

This entry was posted in Uncategorized. Bookmark the permalink.

20 Responses to Springtime Recreational Opportunities In The Overheated, Melting Arctic

  1. gator69 says:

    My sincerest apologies to the Beach boys…

    Surfin’ Prudhoe Bay

    You know Alaska has an ocean
    as warm as Biscayne Bay
    Now the Eskimos are surfin’
    Even on New Year’s day
    You see ‘em dress so scantily
    on skis and not snow shoes
    They’re slaloming around Shamu
    Surfin’ Prudhoe Bay

    You’d catch ‘em surfin’ at Homer (High tide, worldwide, Prudhoe Bay)
    And down at Ketchikan (High tide, worldwide, Prudhoe Bay)
    Junea and Sitka (High tide, worldwide, Prudhoe Bay)
    Nome and Unakleet (High tide, worldwide, Prudhoe Bay)
    All over Kaktovik
    And down at Koyuk way
    Eskimos gone surfin’
    Surfin’ Prudhoe Bay

    Because the white man pollutes
    Have no seals to harpoon
    They’re waxing down their surfboards
    Thank an oil tycoon
    No more seasons only summer
    We’re on surfari to stay
    Tell the media we’re surfin’
    Surfin’ Prudhoe bay

    Polar bear bikinis
    Custom whale bone shades
    Kuiu Island and Junea
    Seward and Bushkin Beach
    All over Alaska
    All the warmists say
    Eskimos gone surfin’
    Surfin’ Prudhoe Bay

    Eskimos gone surfin’
    Surfin’ Prudhoe Bay

    Eskimos gone surfin’
    Surfin’ Prudhoe Bay

  2. GeologyJim says:

    Everybody sang along with the Beach Boys, the Beatles, Rolling Stones (even when no one really knew what Mick was sayin’), and all the MoTown greats

    Nobody sings along with Jayzee, Ludacris, or even Beyonce or Carey

    Bring back the good old days

    [great parody gator69!!]

    • Gail Combs says:

      “Bring back the good old days”
      AMEN!

      I much rather listen to Classic Rock ‘n Roll, MoTown, blues, jazz and ragtime. Or the real classics like Tchaikovsky, PDQ Bach, Mozart….

  3. Andy says:

    Looks like this

    http://notrickszone.com/2017/03/02/new-paper-indicates-there-is-more-arctic-sea-ice-now-than-for-nearly-all-of-the-last-10000-years/#sthash.UJI6kdgG.rrRSck8Q.dpbs

    Is fake news.

    Not only did he chop the original graph, he then rotated it, changed the x axis and then added his own labels !

    Why have scientists when you can just be a blogger and make your own stuff up?

    Ironically this is from a website called NoTricks … ahem…..

    Original is here

    http://thumbsnap.com/s/0hxmnfn5.jpg

    Andy

    • R. Shearer says:

      Sounds like something, Gavin, Michael or Karl would do.

    • R. Shearer says:

      The conclusion of Stein 2017 supports NoTrickszone.

      “Key findings include:

      1. IP25 and PIP25 records indicate that a more reduced sea ice cover was predominant in the Chukchi Sea between 10 and 7.5k cal a BP, coinciding with low primary productivity probably caused by the still very restricted inflow of
      the nutrient-rich PW.

      2. Near 8k cal aBP, nutrient-rich PW inflow may have caused the first increase in primary production indicated by increases in biogenic opal and brassicasterol accumulation rates. A simultaneous increase in sea ice cover was probably triggered by a cooling due to decreased insolation.

      3. Between 6.2 and 4.5k cal a BP, maximum PW inflow may have caused an increase in heat flux into the Chukchi Sea, triggering the contemporaneous decrease in sea ice and maximum surface-water productivity as reflected in low
      PIP25 values and maximum accumulation rates of biogenic opal and brassicasterol, respectively.

      4. During the last 2k cal a BP, sea ice extent increased, coinciding with decreased inflow of nutrient-rich PW and decreased primary production.

      5. The increase in sea ice extent during the late Holocene seems to be a circum-Arctic phenomenon, coinciding with major glacier advances on Franz Josef Land, Spitsbergen and Scandinavia.

      6. The main factors controlling the millennial variability in sea ice and surface-water productivity are probably changes in surface water and heat flow from the Pacific into the Arctic Ocean as well as the long-term decrease in summer insolation, whereas short-term centennial variability observed in the high-resolution middle Holocene record was possibly triggered by solar forcing.”

    • AndyG55 says:

      He hasn’t change the data one tiny bit, just rotated the graph and used

      There is also nothing wrong with pointing out time periods so idiots like you can comprehend.

      You seem to either be VERY confused…. or VERY, VERY DUMB !!

      There is nothing fake, and no intent to deceive, about the graph Stein puts forward, so long as he references the source in his paper.

    • R. Shearer says:

      Sounds like something, Gavin, Michael or Karl (Tom) would do.

      • AndyG55 says:

        Except there has been no data manipulation what so ever.

        Just the dim-witted one talking through his arse as usual.

    • Sunsettommy says:

      No you didn’t make the case since they are using different data sources.

      From Stein et al., 2017,

      “ABSTRACT

      In this study, we present new detailed biomarker-based sea ice records from two sediment cores recovered in the Chukchi Sea and the East Siberian Sea. These new biomarker data may provide new insights on processes controlling recent and past sea ice changes. The biomarker proxy records show (i) minimum sea ice extent during the Early Holocene, (ii) a prominent Mid-Holocene short-term high-amplitude variability in sea ice, primary production and Pacific-Water inflow, and (iii) significantly increased sea ice extent during the last ca. 4.5k cal a BP. This Late Holocene trend in sea ice change in the Chukchi and East Siberian Seas seems to be contemporaneous with similar changes in sea ice extent recorded from other Arctic marginal seas. The main factors controlling the millennial variability in sea ice (and surface-water productivity) are probably changes in surface water and heat flow from the Pacific into the Arctic Ocean as well as the long-term decrease in summer insolation. The short-term centennial variability observed in the high-resolution Middle Holocene record is probably related to solar forcing. Our new data on Holocene sea ice variability may contribute to synoptic reconstructions of regional to global Holocene climate change based on terrestrial and marine archives.”

      NEW BIOMARKER DATA,HIGHER RESOLUTION.

      Your source was composed of SIX different older science papers with LOWER RESOLUTION and partially modeled.

      Meanwhile Me and Kenneth posted NINE more science papers,in the comment section that comes to similar conclusions.

      Stop being misleading and dishonest.

    • Sunsettommy says:

      Here are the NINE papers,8 with link and ninth is from Dr. Meier himself:

      My comment then the next one is from Kenneth

      http://notrickszone.com/2017/03/02/new-paper-indicates-there-is-more-arctic-sea-ice-now-than-for-nearly-all-of-the-last-10000-years/?replytocom=1177668#respond

      and of course the three already in the blog post.

      There are more in the literature,so stop trying to mislead.

    • AndyG55 says:

      Seems the ONLY one here “making stuff up” is you.

      Your every post is just one big stuff-up after another.

  4. AndyG55 says:

    Something disappeared off the first line….

    He hasn’t change the data one tiny bit, just rotated the graph and used the sea ice part… because the other part of the graph are not about sea ice per say.

  5. griff says:

    The Iditarod had snow issues last year…

    …and will likely have them again, given a warming Alaska (3 straight years when a new record high temp year occurred 2014, 2015, 2016)

    • gator69 says:

      Wow! Three straight years!

      Damn it, we need to starve people faster.

    • Gail Combs says:

      What GRIFFY never tells you:

      January 31, 2012 Coldest January on record for parts of Alaska

      Consider some of the following chilling facts:

      * Using satellite data, the University of Wisconsin detected surface temperatures as cold as -73 below zero around the town of Arctic Village in northeast Alaska

      * Low temperatures in the 60 to 65 below zero range have chilled the towns of Galena, Fort Yukon and Huslia since last Friday; the coldest recorded temperature was -65 at both Ft. Yukon and Galena

      * Fairbanks hit -50 on January 28, and -51 on January 29, the first -50 degree readings there since 2006

      * Fairbanks dropped to 40 below on 16 different days during January, the greatest number since 1971 (hat tip: Jim Cantore)

      * The average low in Ft. Yukon, 145 miles northeast of Fairbanks, has been -35 (Source: Our Amazing Planet)

      * The average temperature in Anchorage has been just 2.7 F in January compared to an average of 15. Only three other years have been colder (Source: MSNBC). More info from National Weather Service.

      In addition to cold, snow socked Prince William Sound earlier in the month, paralyzing Valdez and Cordova. Anchorage has already received 92” of snow this winter, compared to an average of 74.5” for an entire season…

      The cold, snowy pattern has arisen from a persistent storm track through the Gulf of Alaska, bringing an onslaught of snow events to the coastal part of the state and record-shattering cold in the interior….

      August 09, 2012 Endless Winter for Alaska’s Mountains This Year

      ALASKA WEATHER
      September 26, 2015 – Fairbanks had 6.7″ yesterday (Fri.). That obliterated the previous daily snowfall record of 0.8″. Just north of Fairbanks, 9″ was recorded. Here’s more snowfall totals.Temps were far below average. A record low was set at Kodiak AK at 29 and small hail fell at Annette. The high temp. of 34 in Fairbanks was 15 deg. cooler than the average high of 49 for 9/25.

      September 30, 2015 – Fairbanks, Alaska – Largest September snowfall on record. 7,000-9,000 without power in Fairbanks, Alaska, area. Officially, 11.2 inches of snow blanketed Fairbanks International Airport Tuesday, setting an all-time September daily snow record, previously 7.8 inches on Sep. 13, 1992.

      November 17, 2015 – Alaska goes into Deep Freeze and it’s only November. Temperatures about 20 degrees below average. Fairbanks was subjected to bitter temperatures of minus 22 degrees Sunday and was forecast to endure almost as bad on Monday night,

      June 9, 2016 – Measurable snow on the ground in June is unusual but FAIRBANKS AK had a storm watch for 4 to 8 inches of snow.

      June 11, 2016 – Record snowfall in Barrow, Alaska. A record 1.7 inches of snow fell Thursday in Barrow, shattering the previous record of .5 inches, set in 1992.

      January 31, 2017 -Record gas use in Alaska during recent cold spell. The record day came on Jan. 19, when temperatures dropped to below minus 20 (-29C) in Anchorage and below minus 40 (-40C) in the Matanuska-Susitna Borough.

      January 24, 2017 – Record snowfall in southcentral Alaska. “Most of the Anchorage Bowl picked up between 11 and 13 inches,” says ktva.com. This was the most snow ever recorded on Jan. 21, far surpassing the previous record of 3.8 inches set in 1981. The 26 inches of snow measured in Anchorage also set a new record. The previous record for Jan. 21 of 25 inches was set in 1967

      Active underwater volcano discovered in southeastern Alaska, about 850 km (530 miles) north of Vancouver, B.C.

      OH, and to add insult to injury — Alaskans to be fined for burning wood.

      Taku Glacier

    • Gail Combs says:

      What M.A. Vukcevic says :
      Phase relationship between SOLAR and the EARTH’s MAGNETIC VARIABILITY is of the fundamental importance, when in phase oceans warm, when out of phase oceans cool.
      Two magnetic signals combined (Geo-Solar cycle) closely correlate to the N. Hemisphere’s natural variability, both on decadal and multi-decadal scale.
      Vukcevik’s geomagnetic-solar correlations here:
      http://www.vukcevic.talktalk.net/EarthNV.htm

      We are at the TOP of the cycle GRIFFY

Leave a Reply

Your email address will not be published. Required fields are marked *