I posted this in January. Roy Spencer predicted that Carl Mears (under pressure from the climate mafia) would corrupt his TLT data to bring it in line with the global warming scam.
Dr. Roy Spencer forecasted that RSS TLT data will be altered :
“I expect there will soon be a revised TLT product from RSS which shows enhanced warming, too.
Here’s what I’m predicting:
1) neither John Christy nor I will be asked to review the paper
2) it will quickly sail through peer review (our UAH V6 paper is still not in print nearly 1 year after submission)
3) it will have many authors, including climate model people and the usual model pundits (e.g. Santer), which will supposedly lend legitimacy to the new data adjustments.
Let’s see how many of my 3 predictions come true.
-Roy”
It has happened exactly as Roy predicted.
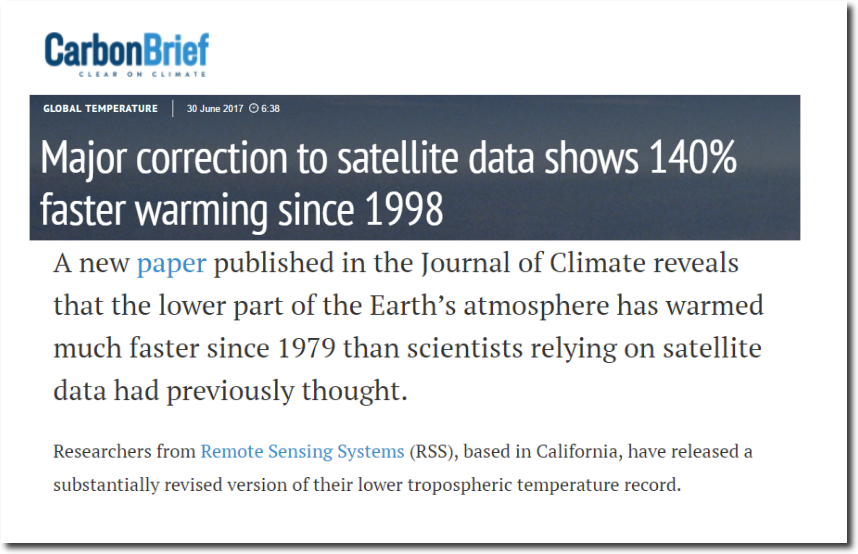
Major correction to satellite data shows 140% faster warming since 1998
Climate is impossible to forecast, but climate fraud is extremely predictable.
UAH has been shown to an almost exact match to NOAA’s own satellite.
And an almost exact trend match to the only untampered , pristine surface data in the world, USCRN.
It will be very interesting to see if the “Adjusted™” RSS still has a trend match to USCRN over the US.
Knowing the trend correlation of RSS to UAH, which I can email you, you can deconstruct real RSS values based on UAH, but since they match over the full range with an offset, just use UAH.
You do not overlay two trends to compare them. You graph UAH in one axis and RSS in the other. Then do a trend fit. Doing that with the originial RSS data shows a very strong correlation over 0.9, and that RSS runs exactly 0.1 C hotter than UAH over the full range. That is statistics. This graph is not.
Well thats certainly an effective excuse for the pause now, isn’t it? It never existed.
It really is a pity that Carl Mears would decide to RUIN his reputation for scientific integrity like that.
But MONEY and PEER PRESSURE will do that to the weak willed.
reading this makes me BURST OUT LAUGHING
“the RSS group used a number of different approaches and models to try and estimate what the temperature would have been if the measurement time remained constant. This involves a combination of satellite observations (when different satellites captured temperatures in both morning and evening), the use of climate models to estimate …….”
SERIOUSLY !!!!!!
BOGUS !!!!!!!!!!!!!!!
all that increase in temps has had an amazing effect on agriculture-
Grains piled on runways, parking lots, fields amid global glut | Reuters
http://www.reuters.com/article/us-usa-grains-storage-analysis-idUSKBN17D0EO
11 Apr 2017 – World stockpiles of corn and wheat are at record highs. From Iowa to China, years ofbumper crops and low prices have overwhelmed storage capacity for …. 2014 2015 2016 2017 0.0 0.2 0.4 0.6 0.8 1.0 1.2 1.4 billion bushels.
Researchers from Remote Sensing Systems (RSS), based in California, have released a substantially revised version of their lower tropospheric temperature record.
That’s NOT where this particular rabbit was pulled out of. !!!
Looking before pulling …
“Now the techniques exist,” Cullen says.
h/t gator
My response. I wonder if it will stay there. ;-)
Lol, i tried to post there but a red comment box flashed up saying i was banned.
Mears says,
“By correctly accounting for the changes in satellite measurement times, the new satellite data are in better agreement with the surface data.”
Matching highly corrupted surface data was the AIM of the “Adjustments™”. ????
WOW !!!!!!! How’s that for a big bent in scientific integrity !
The new data actually shows more warming than has been observed on the surface, though still slightly less than predicted in most climate models.”
(sigh)
Once again, there is no such thing as “adjusted data”. Data is what you get, and not what you make.
da·ta ˈdadə,ˈdādə/ noun:
1- facts and statistics collected together for reference or analysis.
These frauds want us to believe that artifacts of analysis are data, and they are not. Models are tools, not proof.
This is a bit unrelated, but only a bit. I heard on the radio this morning the state of Georgia has a state climatologist.
Let that one sink in just a bit.
I am just trying to imagine what a state climatologist does and how much he or she gets paid for it. Perhaps a quarterly state of the state climate report? Or does he run around looking for the devastating effects of climate change in Georgia?
I am not sure why we need to pay someone what is probably a lot of money to do that when Atlanta is the home of the AGW Propa….. I mean, the Weather Channel.
Seems like a tad bit of over kill.
The Georgia Department of Climatology “disseminates climate information”. That appears to basically mean putting out monthly climate reports. That is my taxes at work. How much is this BS really costing us? It apparently permeates every level of government.
The financial inertia behind this dubious theory must be huge indeed. No wonder they love it so. Money is being made. That is simple fact.
Ever since Trump was elected the size of the swamp gets bigger and bigger.
It has become a major project to drain this humongous swamp……
Maybe not bigger but certainly more crowded …
Edmonton Al
It didn’t get larger, what happened is some of the major critters that have hid in the shadows and murky waters or behind the supposed impartiality or nonpartisanship of the organizations they are in have been exposed. There is even more swamp out there still but the critters at the top of the food chain will not become visible until threatened or called upon to try and help other swamp critters that have already been exposed.
The swamp is actually draining, but look what is being uncovered. Only when the swamp is draining can we see all the vicious animals inhabiting it. They were always there, we just couldn’t see them
I see a lot of revealing but not that much draining. I also think that there are probably aspects of the deep state that fall into the Donald Rumsfeld category of “unknown unknowns”.
True, and some revealing started long before November.
And the Deep State wouldn’t be very deep if we should assume no unknown unknowns.
Mears: “By correctly accounting for the changes in satellite measurement times, the new satellite data are in better agreement with the surface data.”
AndyG55: “Matching highly corrupted surface data was the AIM of the “Adjustments™”. ????”
That’s what it sounds like. Mears apparently felt pressure to find some way to conform with the bastardized Hockey Stick charts. Peer pressure is a powerful thing.
1998 is still the second hottest year on the RSS chart. At least that still puts the lie to the NASA/NOAA claims that 2014 and 2015 were respectively the hottest years ever. Mears has some work to do. He’s behind the curve in cooling the past and warming the present.
This will be screamed from the rooftops at the BBC and Guardian next week. (If they can contain their excitement that long)
The bizarre thing is WE’RE the good guys and the criminals are claiming to be the virtuous ones! Quite incredible. As they pull stunts like this so they need the threat of court trial and serious jail time. This corruption cannot continue.
here’s our climate scientists hard at work “adjusting” the data with the Universal Variable Constant
It would be interesting to subpoena the emails that lead to this adjustment.
Sorry, no biscuit.
They learned. They toasted to HRC about her cunning.
It’s none of your business. They are “personal emails”.
If the machines used are government machines paid for by my tax dollars, and the time used to read/write these is also paid for by tax dollars, then I would argue that it is NOT personal, and if they try to delete emails or other records to avoid such searches, that they are guilty of destroying government property and should be appropriately penalized for that. (Being prosecuted for a little bit of obstruction of justice shouldn’t hurt either ;)
Only hateful idiots like Ms Griff think this is how science operates.
Once again, alarmists prove without a doubt they are faking it til the make it. Real scientists would welcome scrutiny, and would never run from it.
Re: They toasted to HRC about her cunning. Hillary’s cunning stunt?
https://www.carbonbrief.org/major-correction-to-satellite-data-shows-140-faster-warming-since-1998
“A new paper published in the Journal of Climate reveals that the lower part of the Earth’s atmosphere has warmed much faster since 1979 than scientists relying on satellite data had previously thought.
Researchers from Remote Sensing Systems (RSS), based in California, have released a substantially revised version of their lower tropospheric temperature record.
After correcting for problems caused by the decaying orbit of satellites, as well as other factors, they have produced a new record showing 36% faster warming since 1979 and nearly 140% faster (i.e. 2.4 times larger) warming since 1998. This is in comparison to the previous version 3 of the lower tropospheric temperature (TLT) data published in 2009.
Climate sceptics have long claimed that satellite data shows global warming to be less pronounced than observational data collected on the Earth’s surface. This new correction to the RSS data substantially undermines that argument. The new data actually shows more warming than has been observed on the surface, though still slightly less than projected in most climate models.”
“Carbon Brief has contacted Dr John Christy at UAH, but he says he is currently at a conference and unable to comment at present. This article will be updated should he provide any comment.”
No word from him at Carbon Brief so far…
Yes Ms Griff, we have already addressed this fraud. Dr’s Christy and Spencer were left out of this “paper”, because they know it is fraud and would never have allowed it to see publication. Your alarmist priests know that the peer of a fraud is a fraud, and excluded actual scientists from the process.
Why do you love fraud, and hate poor brown people Ms Griff?
Peer reviewed by big Al Gore? or Gavin Schmidt?
Griff when you show me
one other instance in all thermodynamics
of someone placing refractive insulation
between a rock and fire warming it,
making 20% less fire warm the rock,
so the rock actually gets warmer with every percent warming light not warming it,
then you aren’t the ignoratti representative of purest fraud.
I found this on You tube…
going to take it down now?
https://www.youtube.com/watch?v=r9SJlqs2DtY
Why would Tony erase actual data? That’s what frauds do.
Why do you hate poor brown people Ms Griif?
“I found this on You tube…”
Wow , isn’t griff a clever little amoeba. !!
There is no polite way to say what you are, Ms Griff.
And I found this:
“Satellites continue to be conspiracy theorists, showing little or no net warming over the past 25 years.”
https://realclimatescience.com/2017/03/celebrating-six-years-of-fake-berkeley-earth-temperatures/
That needs changing, right?
Nope.
Why do you hate poor brown people Ms Griff?
Griff u truly are a tool of amazing scope. Fudging the data to give the answer you want is gold standard science in your nitwit bizarro world. Do u actually buy the changes to the data as justified?
Ms Griff isn’t buying anything, she knows she will never pay the price for this fraud. Poor brown people are paying for this scam with their lives, and this is exactly how Ms Griff likes it.
A picture tells a thousand words.
All these donors are know far-left operatives, high on the Climate AGENDA.
Griff thinks that the now statistically adjusted RSS is the only satellite temperature data set out there apparently.
Never heard of UAH or radiosondes Griff? Only in the mind of a true believer would it be logical to instantly believe a source that is telling you that their data was wrong for years, but now all of a sudden they have found the answer and it’s correct. Especially when their data, which they now claim is correct, will now not agree with other satellite data nor the radiosonde data.
Does anyone know where I can get hold of this new and “IMPROVED™” non-data?
Perhaps
http://images.remss.com/data/msu/graphics/TLT_v40/time_series/RSS_TS_channel_TLT_Global_Land_And_Sea_v04_0.txt
4 decimal places!
ROFLMAO.
These guys are A JOKE !!!!!
It is a dead give away since Satellites are not that accurate.
That’s what is so hilarious.
There’s Carl Mears, saying his RSS data is no good, then presenting it to 4 dp.
Its almost as if the fool hasn’t had any mathematical or statistical training whatsoever. !
Don’t laugh, such things have happened before. The 4 decimal places could be a secret signal from a captive. This is how you could read it:
“They got me. Can’t leave the room. Seems like a basement. Hillary’s drunk and babbling in the corner but Podesta, Mann and Gore have me tied to the chair. Typing the paper with my left pointer finger. The other hand in a vise. Help.”
Roys 2dp is sort of acceptable, just to get some different level.
Changing to 1 dp gives a graph where the TWO NON-WARMING periods stand out like ***’s ****s..
They take up 32 of the 38 years as NON-WARMING periods.
So much for CO2 forcing !!!
What I’m after is the RSS USA data.
Will wait and see if it is ever published.
Redoing that graph so it can be seen
http://models.weatherbell.com/temperature.php
This is the temperature data I go by which is not biased.
Global cooling has begun this year and will be continuing for many years.
I’ve said it before, but it still bears repeating.
If you find yourself changing the facts/data to match your hypothesis it’s not science. If you go ahead and publish anyway, your not a scientist.
An old saying in physics is:
If you keep your data base short enough, it will fit your theory.
I’ve used it often when criticizing the notion that the economy can be “managed” by interventionist central bankers. Who are as deluded as “warmers” who strongly believe they can “manage” the temperature of the planet.
Tony, this would be a good topic for a new video analyzing what happened here. We need to get ahead of the smug libtards who are bound to tell us, with the obligatory smirk, that “see, even your vaunted satellite data now agrees with us.”
I’d suggest focusing on the rationalizations given for making the adjustments.
“libtards who are bound to tell us, with the obligatory smirk, that “see, even your vaunted satellite data now agrees with us”
The amazing thing is that they can do this immediately after so obviously cooking the books. This is a syndrome. (That’s why Griff is as central to this thing as Michael Mann.)
They only have the balloon data to go now then they will have a consensus of modified data.
Not so Fred. UHA is not weather ballon data. Just confirmed by it.
Hello Tony,
I’m not a rocket scientist, but there is something that just doesn’t add up when I tried to understand these adjustments to the RSS data. As far as I understand, they try to convince us that those adjustments were necesary because of the satellite orbital decay.
First of all, I must say that I have a hard time making myself believe it took those experts so long to discover this error.
But far more important… I believe the net effect of orbital decay must equal zero. The problem is that the orbital decay causes a delay in the flyover times and thus, same spot is measured a fraction of time later every day.
For polar orbiting satellites, all spots are measured twice a day (https://en.wikipedia.org/wiki/Weather_satellite) so when a certain spot is measured in the morning, this delay will cause a gradually increasing temperature, but for the same spot measured in the evening the delay will cause a gradually decreasing temperature.
For all spots and a long enough period, all these small desviations will add up to zero.