1.15 Trillion Tons Of New Ice On Greenland’s Surface

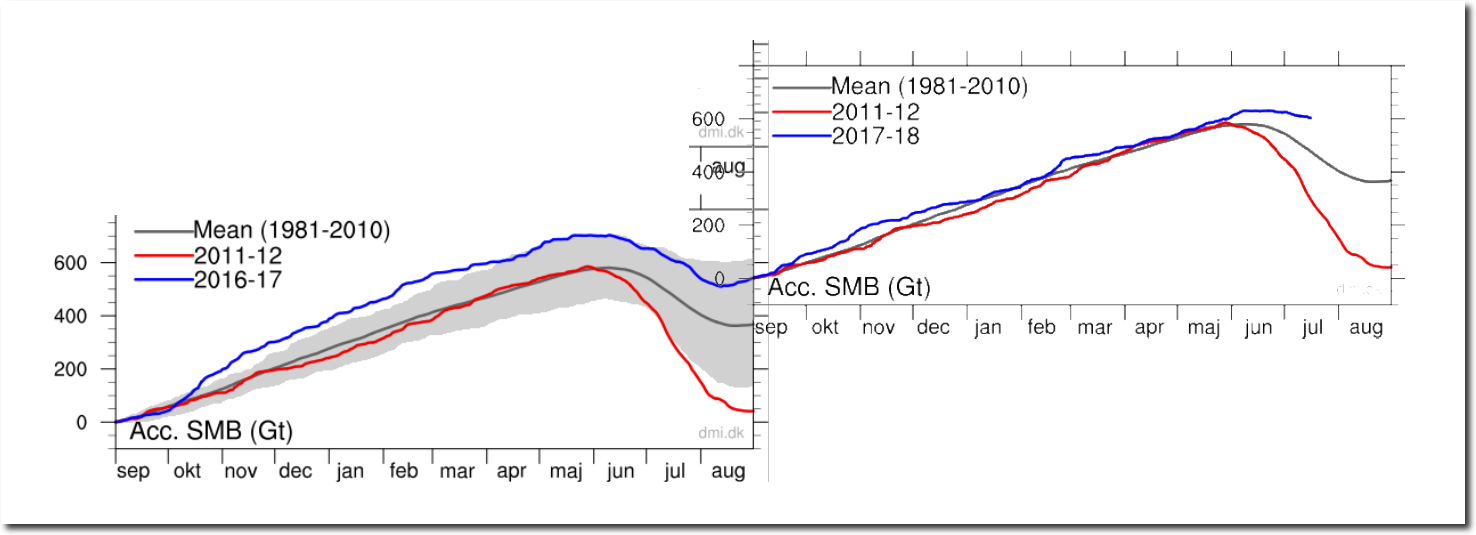
Since the end of August 2016, Greenland’s surface has gained 1.15 trillion tons of new ice, which is more than 50% above normal.  Surface mass balance is the difference between snowfall and melt. Snow is falling much faster than it is melting in Greenland.

2016-2017      2017-2018

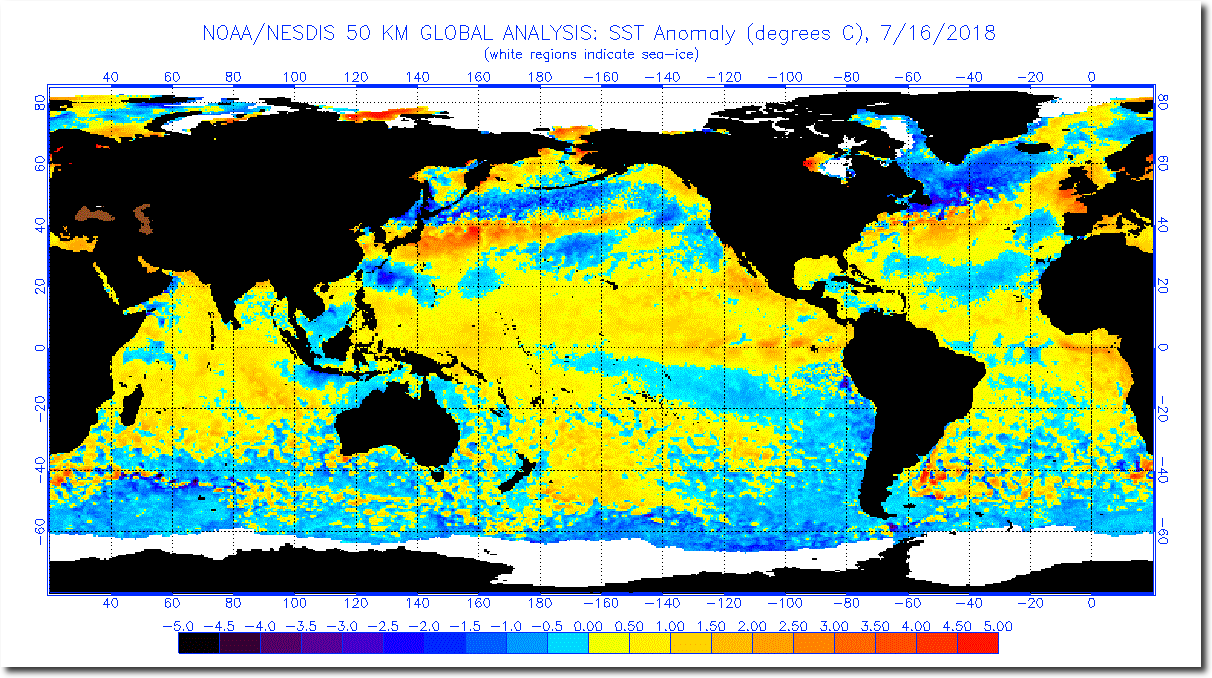
This is not surprising, giving that ocean temperatures around Greenland are record cold.

anomg.7.16.2018.gif (930×340)

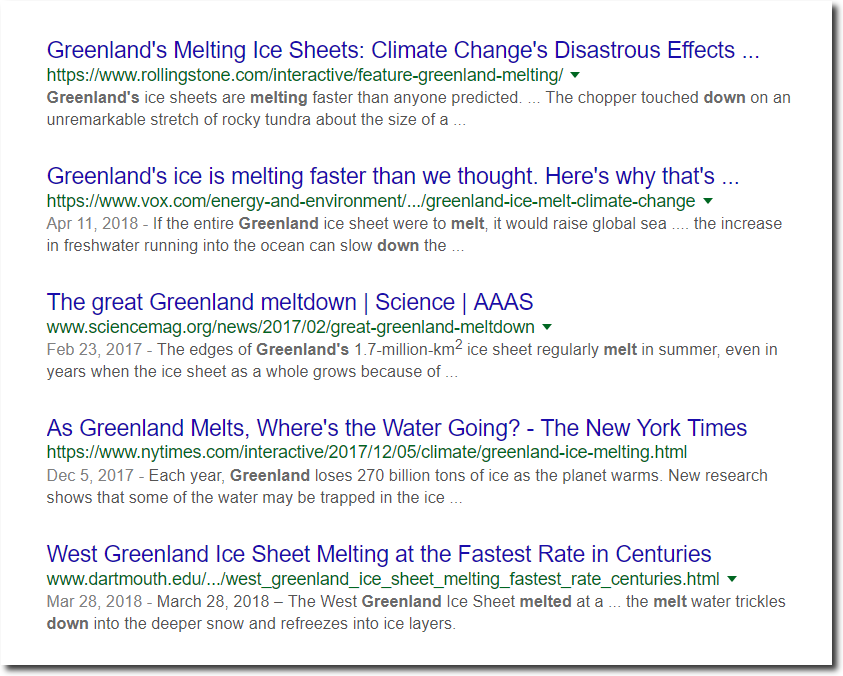
Meanwhile, the climate mafia continues their endless barrage of lies and fraud.

This entry was posted in Uncategorized. Bookmark the permalink.

54 Responses to 1.15 Trillion Tons Of New Ice On Greenland’s Surface

  1. Gator says:

    Are there any sharks left for Rolling Stone to jump? Talk about your premium quality mullet wrapper…

  2. Jack Miller says:

    I still have not received a reply from HUFFPOST regarding the article written by Mary Papenfuss “Massive Rogue Iceberg Threatens Greenland Community” published July 15.

    It would be interesting to see their response to the current DMI Greenland SMB and UAH Global Temp data that I included in the email.

    • tonyheller says:

      The left isn’t interested in facts.

      • GW Smith says:

        Only if it suits them.

      • Caleb Shaw says:

        The left may not be interested in Truth, but all your hard work does chip off followers at the edges. I was trusting and naive originally. I simply found it hard to face the sad fact that people I thought were friends were liars, and could lie while smiling and pretending to be honest.

        Even among the foam-at-the-mouth Alarmists there are some who are merely being loyal without thinking. And when a loyal person discovers they have been lied to, they switch sides with a vengeance.

        Keep up the good work. Keep pounding away with the Truth. And when they take cheap shots, calling you racist, be aware more and more people understand this is their MO and are sick of them.

      • Phil. says:

        Do you mean the fact that in most recent years the loss due to glacier calving/ice berg formation exceeds the Accumulated SMB?

        • Gator says:

          Fact? Really? Have you personally measured?

          • Phil. says:

            According to both NSIDC and DMI it is a fact just like the accumulation of SMB. No I haven’t measured it personally, neither has Tony.

          • Gator says:

            No Phil, it is not a fact. Do you know why it is not a fact Phil? Have you ever bothered to look into these claims? Or are you just a loud mouthed alarmist acolyte, who likes the idea of CAGW, and therefore never questions the alarmist anti-science dogma?

          • Phil. says:

            NSIDC:
            “The mass of the Greenland ice sheet has rapidly declined in the last several years due to surface melting and iceberg calving. Research based on observations from the NASA/German Aerospace Center’s twin Gravity Recovery and Climate Experiment (GRACE) satellites indicates that between 2002 and 2016, Greenland shed approximately 280 gigatons of ice per year”

            DMI:
            “Over the year, it snows more than it melts, but calving of icebergs also adds to the total mass budget of the ice sheet. Satellite observations over the last decade show that the ice sheet is not in balance. The calving loss is greater than the gain from surface mass balance, and Greenland is losing mass at about 200 Gt/yr.”

          • Gator says:

            I know what they claim Phil, and I know what their claims are based upon, which is why I know their claims are not facts. Do you know what their claims are based upon Phil, and do you know why they are not facts?

          • Phil. says:

            Yes the ice loss is based on measurements of the change in the gravitational field. Between 2002 and 2017 the loss was almost 4000 Gt.

          • Gator says:

            GRACE measures gravity anomalies. Do you believe that the Earth’s gravitational field never changes, that it is a reliable consistent benchmark against which you can find an ice signal that is also reliable?

            Hint1: A Remote Sensing degree, like the one I earned, will help.

            Hint2: Interpretations of GRACE measurements are not facts.

            Take your time, I have a meeting to attend this morning.

          • Phil. says:

            Hint1: A Remote Sensing degree, like the one I earned, will help.

            So how does your expertise explain the consistent variation in the gravitational field over 15 years around the southern coastline of Greenland? Do you think that the same satellites’ measurements of gravitational anomalies in the Amazon basin is incorrectly interpreted as the seasonal change in water storage there?

            Hint2: Interpretations of GRACE measurements are not facts.

            But the results of a climate computer model fed with the results of a computer weather model are?

          • Gator says:

            Phil, answer the question.

            Do you believe that the Earth’s gravitational field never changes, that it is a reliable consistent benchmark against which you can find an ice signal that is also reliable?

          • RAH says:

            Driving down the road thinking about this GRACE stuff the other day made me think that perhaps the best question would be to ask for the methodology by which they separate the gravitational signal of the crust and mantle from that of water in any and all forms. It wasn’t GRACE that discovered the huge unfrozen lake under the Greenland ice sheet. That took actual drilling.

          • Gator says:

            RAH, the most valuable thing that GRACE gives alarmists is tons (literally) of fudge factor. They can manipulate numbers to reflect what ever they wish, almost as good as a GCM.

          • neal s says:

            The GRACE people think they can detect groundwater changes. I was surprised when I saw they thought there were groundwater changes under the atacama desert. Prior to that, I had been willing to consider that there might be something (however slight) to their results.

            While I don’t doubt that something is being measured, I doubt their interpretations and I also doubt they are actually measuring what they think they are measuring.

          • Phil. says:

            It wasn’t GRACE that discovered the huge unfrozen lake under the Greenland ice sheet. That took actual drilling.

            Actually that was detected by radar.
            http://www.cam.ac.uk/research/news/lakes-discovered-beneath-greenland-ice-sheet-0

          • Phil. says:

            RAH, the most valuable thing that GRACE gives alarmists is tons (literally) of fudge factor. They can manipulate numbers to reflect what ever they wish, almost as good as a GCM.

            Like the one that’s used to generate the new ice ‘facts’ that Tony presents in this post?

          • Phil. says:

            The GRACE people think they can detect groundwater changes. I was surprised when I saw they thought there were groundwater changes under the atacama desert. Prior to that, I had been willing to consider that there might be something (however slight) to their results.

            My understanding is that the groundwater under the Atacama desert are very important to local communities and are fed by the glaciers in the Andes. There is concern that these are at risk by local mining activities.
            https://phys.org/news/2015-08-architecture-aquifers-chile-atacama.html

          • spike55 says:

            “According to both NSIDC and DMI it is a fact just like the accumulation of SMB”

            WRONG yet again, phlop.

            Neither NSIDC or DMI produce daily calving or ice berg data.

            Generic statements are meaningless, like your comments.

            You really are not very intelligent, are you phlop.

            Just making CRAP up to suit your trolling.

          • spike55 says:

            Actual mass of Greenland since 1900, phlop.

          • spike55 says:

            And Greenland ice area is only just a tad down from its LARGEST area in over 8000 years.

            That is because the world is only just a tiny amount warmer than the COLDEST period in 10,000 years.

            There is absolutely ZERO-EVIDENCE that any of that highly beneficial warming since the LIA is cause by human anything.

          • Gator says:

            What model did Tony use Phil?

            And pray tell us, why can you not find one example of you criticizing the climate porn produced by alarmists?

            Troll much?

          • spike55 says:

            “Actually that was detected by radar.”

            Yep GRACE once “detected” a mountain in Indonesia.

            There wasn’t one there..

            But .. what the heck. !!

          • spike55 says:

            “The calving loss is greater than the gain from surface mass balance, and Greenland is losing mass at about 200 Gt/yr.””

            ROFLMAO

            really phlop.. do you know how long that generic statement has been there?

            No actual data to back it up. If you think there is .. then produce it..

            .. and no, NOT gravity based nonsense over a volcanic region.. actual real measurements.

            And then you can try to prove scientifically that the AMO , which causes the natural Arctic sea ice cycles, is “human” caused.

            There is ZERO EVIDENCE that Arctic sea ice fluctuations are anything to do with human anything.

          • Phil. says:

            What model did Tony use Phil?
            Do learn to read Gator, what I posted was:
            “Like the one that’s used to generate the new ice ‘facts’ that Tony presents in this post?”
            But since you asked this what DMI says about the models used to generate the SMB data he presented (emphasis mine).
            “Here you can follow the daily surface mass balance on the Greenland Ice Sheet. The snow and ice model from one of DMI’s climate models is driven every six hours with snowfall, sunlight and other parameters from a research weather model for Greenland, Hirlam-Newsnow, and since 1 July 2017 the HARMONIE-AROME weather model. We can thereby calculate the melting energy, refreezing of melt water and sublimation (snow that evaporates without melting first). The result of this is a change in the snow and ice from one day to the next and this change is shown below. All numbers are in water equivalent, that is, the amount of water the snow and ice would correspond to if it was melted.

            The model has been updated in 2014 to better account for meltwater refreezing in the snow, and again in 2015 to account for the lower reflectivity of sunlight in bare ice than in snow. Finally, it has been updated again in 2017 with a more advanced representation of percolation and refreezing of meltwater. At the same time, we have extended the reference period to 1981-2010. The update means that the new maps, values and curves will deviate from the previous ones. Everything shown on this site, however, is calculated with this new model, so that all curves and values are comparable.”

          • Phil. says:

            really phlop.. do you know how long that generic statement has been there?

            The page was last edited in 2017.

            No actual data to back it up. If you think there is .. then produce it..

            Here is the data produced by DMI:
            http://polarportal.dk/fileadmin/polarportal/mass/Grace_combine_Sm_EN_20170100.png

            Note that DMI says the following (my emphasis):
            “The graph illustrates the month-by-month development in changes of mass measured in gigatonnes, Gt (1 Gt is 1 billion tonnes or 1 km3 of water). The left axis on the graph shows how this ice mass loss corresponds to sea level rise contribution. 100 Gt corresponds to 0.28 mm global sea level rise).

            This data shows that most of the loss of ice occurs along the edge of the ice sheet, where independent observations also indicate that the ice is thinning, that the glacier fronts are retreating in fjords and on land, and that there is a greater degree of melting from the surface of the ice.”

            .. and no, NOT gravity based nonsense over a volcanic region.. actual real measurements.
            It is not a volcanic region!

          • Gator says:

            It is so cute how these little warmists believe that their failed models are accurate. LOL

            Reality is not their friend, so they hide behind models, and fling their excrement at the rest of us.

          • Phil. says:

            And Greenland ice area is only just a tad down from its LARGEST area in over 8000 years.

            You might want to review the graph you linked to.
            https://realclimatescience.com/wp-content/uploads/2018/07/113711-1.jpg

            The current area of the Greenland ice sheet is 1.7×10^12m^2.

          • spike55 says:

            “It is not a volcanic region!”

            BS, Greenland is right over the Icelandic magma sac

            Gees you are an IGNORANT little troll. !!

          • spike55 says:

            The FARCE that is GRACE..

            roflmao

            You refuse to learn, don’t you phlop.

          • spike55 says:

            “The current area of the Greenland ice sheet is 1.7×10^12m^2.”

            ROFLMAO,

            The fact you bring up that SHOWS that you are likely to remain perennially IGNORANT

            I suggest you do some research, and find the actual region the Briner graph represents.

            Then wipe the slime and dribble off your face.

          • spike55 says:

            Volcanic. Geothermal flux

            Do try to actually keep up, phlop !!

          • spike55 says:

            more

          • RAH says:

            Phil admits there is a lake under an ice cap that is well over a mile thick and then denies that geothermal energy has anything to do with it. Too funny!

          • Phil. says:

            I suggest you do some research, and find the actual region the Briner graph represents.

            Why it’s the data you linked to, it originates from the model of Larsen et al. look it up.

          • Phil. says:

            Volcanic. Geothermal flux
            It’s not volcanic.

          • Phil. says:

            Phil admits there is a lake under an ice cap that is well over a mile thick and then denies that geothermal energy has anything to do with it. Too funny!

            I didn’t ‘admit’ anything, just because there’s a lake there it doesn’t mean it’s due to geothermal energy. In fact those who discovered it said:
            “unlike in Antarctica where surface temperatures remain below freezing all year round, the newly discovered lakes are most likely fed by melting surface water draining through cracks in the ice. A surface lake situated nearby may also replenish the subglacial lakes during warm summers.

            This means that the lakes are part of an open hydrological system and are connected to the surface, which is different from Antarctic lakes that are more often isolated ecosystems.”

          • Gator says:

            Of course Phil did not “admit” anything, that would be heresy for the climate faithful. For them it is easier to believe that a minor trace gas is more responsible for melting ice, rather than the enormous geothermal energy located directly below the melting ice or the huge nuclear fusion reactor in the sky that powers our “solar” system.

            Amen.

    • spike55 says:

      FFS, Bangladesh, New Orleans, all built where floods from water upstream can cause issues.

      How is a glacier calving any different.

      The utter IGNORANCE of some of these fools astounds me !

      • Rah says:

        How miserable an existence it must be. Having the job of spending one’s days looking for something, anything, to report as a climate disaster.

        • Colorado Wellington says:

          Having an orgasm when one finds something to be miserable about is the very definition of Leftism.

          • arn says:

            Just this photo(i watched even the video)
            was worth that Trump became president.
            +the fact that everyone can see what a bunch of fascist ,spoiled,bigotted assholes many of those people are as soon as they don’t get what they want(or to be more precize:
            What the media told them to want)

          • Colorado Wellington says:

            Phil should take her out. She wants to go to the lake!

          • RAH says:

            Need to see stuff like on occasion so I remember why I appreciate my wife so much. Never in 39 years 10 months of marriage has she acted like that or even anything close to it. In fact I was thinking that guy needs to do the world a favor and take that woman to the lakes along with a concrete block and bit of chain.

          • RAH says:

            Oops! That’s 34 years and 10 months of marriage.

    • Caleb Shaw says:

      The media likes to focus on huge icebergs and rushing meltwater without mentioning they are seen every year.

      A gigaton is a billion metric tons. Every year Greenland gains 600 gigatons from falling snow. That is enough to make the oceans fall 1.5 mm. In order to keep the ocean at the same level Greenland needs to lose 600 gigatons, each and every year.

      On an average year it loses only 200 through melting, and therefore must lose 400 through having enormous icebergs calve off gigantic glaciers.

      A gigaton is roughly a cubic kilometer. That’s a lot of water for the press to take pictures of. It can make icebergs half the size of Manhattan for the media to have a tizzy about. But it is quite normal and natural, and happens every year, even when Greenland goes through a year like this one, when it is actually gaining mass.

      http://sunriseswansong.wordpress.com/2018/07/16/arctic-sea-ice-the-amo-chill/

  3. Rah says:

    Looking more and more like the AMO may be turning. If it is we may be able to take off our waders in a few years as this climate bull shit subsides. If I outlive Gore I just may do the same to his grave as Patton did to the Rhine.

  4. spike55 says:

    OT, but its great to see the EU, India, Turkey, and particularly China, doing so much to support world plant life.

    USA, pull your socks up and start doing your bit, please. !!

    (graph from WUWT.)

    • Colorado Wellington says:

      USA exploiting the natural resources of other countries, as always. Growing food with CO2 fertilizer these countries emitted into the atmosphere at a great cost.

      Selling the food back to them at a premium. Disgraceful.

    • arn says:

      Now-that’s not just new but even for the lefties beyond crazy.
      (i guess even the millenium bug may return as result of global warming)

Leave a Reply to Caleb Shaw Cancel reply

Your email address will not be published. Required fields are marked *