Scary Times For Climate Alarmists

The Arctic melting scam is entering dangerous territory. Great wailing and gnashing of teeth among people who make their living lying about the Arctic.

Ocean and Ice Services | Danmarks Meteorologiske Institut

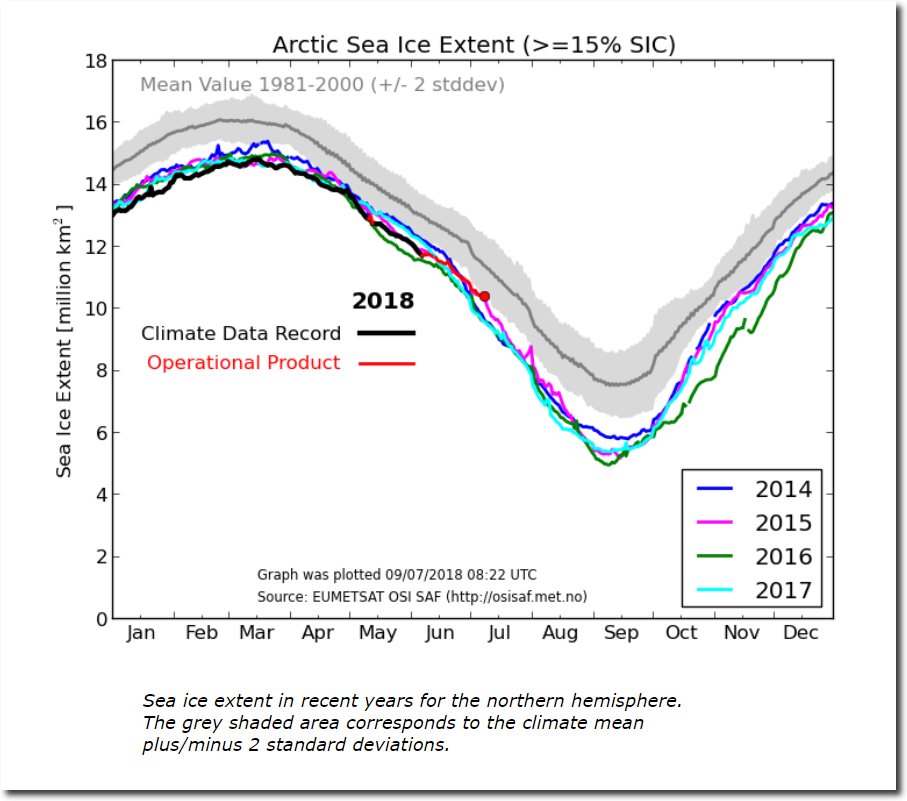
There has been a huge expansion of thick ice over the last ten years.

2008    2018

The Argus-Press – Google News Archive Search

Gore: Polar ice cap may disappear by summer 2014

This entry was posted in Uncategorized. Bookmark the permalink.

54 Responses to Scary Times For Climate Alarmists

  1. CO2isLife says:

    Can someone please explain how trapping outgoing LWIR with a blackbody temperature of -80 deg C (13 to 18 Microns) cause record temperatures? The Greenhouse Gas Effect slows cooling, it doesn’t add energy to the system. record high temperatures are evidence of more incoming visible radiation reaching the earth’s surface. Record high daytime temperatures rule out CO2 as the cause, they don’t validate CO2 driven warming. The oceans are also warming. LWIR between 13 and 18 microns, the wavelengths CO2 absorbs, don’t warm water.

    • Squidly says:

      Greenhouse Gas Effect slows cooling ..

      BS! … no gas “slows cooling” and no gas “causes warming” .. period.

      The so-called “greenhouse effect” cannot coexist with our universe. It is impossible. The very physical mechanisms that would allow the “greenhouse effect” to exist would not allow our universe to exist. They cannot coexist.

  2. jb says:

    Quick question:
    The black line (labeled climate record date 2018) in the 1st plot ends in mid- end- of May by my eye.
    Is it being hidden by the red line from then to now?

    tnx,

  3. Anon says:

    Tony,

    FYI: Sorry to go off topic, but as you frequently post tide gauge date, I think you should be apprised of this:

    Link between river outflow and coastal sea level

    “Based on our model and the observations, we’re finding that variations in the amount of water that comes out of a river annually can raise or lower coastal mean sea level by several centimeters.”

    https://www.sciencedaily.com/releases/2018/07/180709152714.htm

    *As this could be a possibility, the evidence (slope and cor. coef.) from high quality tide gauges with a LONG HISTORY should be given the most weight.

  4. spike55 says:

    You can see that 2008 was thin spread out sea ice,while 2018 is much thicker.

    Interesting is that NSIDC has 9th July 2018 extent above EVERY year since 2006 except 2008.

    You can see clearly in this chart how the respective volumes compare

    • Steven Fraser says:

      The grey area looks like the 16-year std deviation. Congrats on getting that to chart. Well done!

    • spike55 says:

      Its the +1 sd done as a grey area, and the -1sd done as a white area over the top.

      That’s why the grid lines disappear down the bottom. (haven’t figured that one out yet , Excel doesn’t seem to allow the grid to be brought to the front)

    • carlos says:

      Is it not logical that the ice, when it is close to melting, spreads better?.

      The ice extent ant ice volume can thus have different maximums…the ice extent maximum comes years after ice volume (and cold) maximum, when the ice have already become softer and warmer and spreads better?

      When ice is as cold as on the planets like Pluto or the Jupiter/Saturn moons it can be compared to steel i have read somewhere.

  5. Scarface says:

    Why is the red dot of the ‘operational product’ situated in the 3rd quarter of june, while we’re already in the second quarter of july? We’re looking at old news so to speak.

    Is it that much work to calculate the value for a recent date? I could understand a lag of 1 or 2 days, but 2-3 week?

    • Steven Fraser says:

      Here you go. Took the chart currently at the source, and plotted it with a vertical line through the center of the red circle.

      Notice that the name of the month is in the center of the date-range, below the mid-month line.

      Enjoy!

  6. spike55 says:

    AMO is cyclic, one would expect the Arctic sea ice volume to be so as well.

    In any realistic temperature match reconstruction it is.

    https://s19.postimg.cc/hcmhnqak3/Arctic-_Sea-_Ice-_Alekseev-2016-as-shown-in-_Connolly-2017.jpg

    This cycle is even evidence in the depths of the LIA.

    https://s19.postimg.cc/9fnv8ma43/Icelandic_sea_ice_index_3.png

    A second order curve could be used to approximate the low point of a cycle, as in the pic below

    If this trend continues, we should have some serious fun with griff et al in the next few years (unless they crawl back into their troll holes and disappear)

    • Anon says:

      Spike55… now that is interesting – to see the data like that – thanks!

      • spike55 says:

        time will tell,

        . but the AMO is sort of on track to start heading back down.

        and when it does Arctic sea ice will increase

    • Griff says:

      That’s one of the reasons I persist… the decline pattern is additional to the AMO. Yes, the AMO signal is there, but the decline is overriding it.

      • spike55 says:

        Griff why are you so deliberately IGNORANT?

        Why don’t you admit that the late 1970s was the HIGHEST EXTREME in Arctic sea ice since the LIA. ?

        Why do you continue to DENY CLIMATE CHANGE ???

        There is NO decline except the totally natural decline from the massive extremes of the LIA modified by the AMO.

        You KNOW the AMO is turning

        and you KNOW that Arctic sea ice extent will start to climb over the next few years

        GIVE IT UP.. you are a LOSER..

    • richard says:

      Spike55- Great!! loving that curve.

  7. Jack Miller says:

    It’s been a huge game of climate “whack-a-mole” lately, not so much on the poles lately more nonsense on the Great Barrier Reef. I suspect the hype regarding the monsoonal weather affecting Japan will be ramping up very soon.

  8. Griff says:

    so the DMI extent chart shows open water where the DMI thickness chart shows ice…

    what’s that about, eh?

    http://polarportal.dk/en/sea-ice-and-icebergs/sea-ice-extent0/

    http://polarportal.dk/en/sea-ice-and-icebergs/sea-ice-thickness-and-volume/#c23629

    Pasting the DMI thickness chart in is misleading as to the state of the ice…

    • Jack Miller says:

      How is that misleading, one shows varying ice thickness from thin ice to thick and the other shows areas of concentration of 15% or more.

    • spike55 says:

      NSIDC shows July 9th above EVERY YEAR back to 2006 except 2008.

      2008 was a LOT THINNER sea ice..

      You have absolutely nothing but your brain-washed LIES and FANTASIES, griff.

      • Jack Miller says:

        You might have to educate him on how to read a graph . . .

      • Steven Fraser says:

        Some numbers from the DMI Sea Ice Volume for July 10:

        2018 is still #4, behind 2003, 2014 and 2004.

        Comparing 2018 and 2003
        The 2018 daily decline rate has decreased the last 2 reports, from -410 to -336.

        The 2003 daily decline rate has decreased in the last 6 reports, from -538 to -299.

        It appears that the decline rates for both 2003 and 2018 have passed their max.

        Percentages and std deviation.

        2018 Sea Ice Volume is at 111.02% of the 16-year average, on the upper end of the first std deviation. It is 110.33% of the DMI-charted 2004-2013 range, and in the 2nd std deviation due to spacing of the values for those years.

        Very interesting.

        Stay tuned!

    • richard verney says:

      No doubt that the reason why there has been substantial recovery in the amount of Arctic ice is due the recent cooling of the North Atlantic. Since 2005, there has been a very significant fall in the heat content. For example see the Piecuch 2017 paper: https://agupubs.onlinelibrary.wiley.com/doi/full/10.1002/2017JC012845

      The take home plot:

      • RAH says:

        Richard

        “Recovery” to what?

        I ask for two reasons.
        1. Arctic ice “recovery” is a premise the alarmists created. The word implies that the Arctic climate is sick or not healthy. A vital sign that is outside established parameters. I reject that premise.

        2. Recovery to what? What is the accepted proper range of for Arctic ice mass/volume/area/extent etc…? There isn’t one that from what I have read.

        • Colorado Wellington says:

          RAH, everyone can see that Arctic ice is unwell. 650 million years ago we had good, healthy ice pole to pole.

          • RAH says:

            Good thing man wasn’t around back during the times of Ice ball earth. If he was our modern day “climate scientists” would be blaming them for it.

          • richard says:

            Colarado- classic!

          • richard says:

            Colorado,

            Though looking at some info on the last ice age it says the Arctic was similar to today with seasonal open waters-
            Causes-
            Wind direction
            Undersea volcanoes?

      • spike55 says:

        Richard, the “recovery” of sea ice was from 1979 to about 2006.

        1979 was the anomaly, up there with the LIA.

        For most of the last 10,000 years Arctic sea ice has been substantially LESS than current levels.

        • Steven Fraser says:

          And, let’s not forget the progress of Greenland SMB. Here are this year July 10 side-by-side with last year, with a cross-hair for this year’s level and last year’s July 10 value.

          Though we have taken a different path to get here, 2018 is now quite close to 2017, with a melt rate a bit less than it.

  9. Michael Spencer says:

    Perhaps Ms Griff would like to go swimming then; after all, it’s summer beach weather on the north coast of Alaska: http://seaice.alaska.edu/gi/observatories/barrow_webcam

    Mind you, I don’t think that the ice is melting all that rapidly at Greenland’s “Summit Camp” because it’s -16C right now: http://www.summitcamp.org/status/webcam/. Although – wait a minute! “The experts” say that it is, so they must be right – ice must melt at that temperature.

    I’m worried now – sea levels will rise and we’re all doomed! Doomed, I say!

  10. richard verney says:

    Don’t forget also that the North Atlantic has cooled since the late 1980s and particularly since 2005.

    See for example the recent (2017) paper by Smeed et al (https://agupubs.onlinelibrary.wiley.com/doi/epdf/10.1002/2017GL076350 )

    http://notrickszone.com/wp-content/uploads/2018/02/North-Atlantic-SST-Cooling-Since-1985-Smeed-2018.jpg

    • RAH says:

      And so far this year the SSTs in the equatorial zone are down also. But there is a warm blob in the temperate zone in the Atlantic hanging off the east coast of the US. That is where the prime hurricane development threat will come from this year according to Joe Bastardi.

      • Disillusioned says:

        Propagandalarmunists will ignore all down temps and will cherry pick any ‘warm blob’ or any hurricane as evidence for their religion and worship of their failed, fictional CO2-based “climate change” religion.

        Blinded by their religion, CO2 alarmists are the consummate climate and science “deniers.”

        • Snowleopard says:

          Yup. And they don’t buy icebreakers either. But if the Atlantic cooling trend continues they might be needing a few.

      • Steven Fraser says:

        With the cool equatorial Atlantic this year, the heat has to come from somewhere.

Leave a Reply

Your email address will not be published. Required fields are marked *