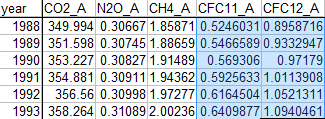
Bill Illis posted a table from RealFakeClimate showing Hansen’s scenario A/B/C assumptions. What was inside was just about what I should have expected from Homer.
He is off by three orders of magnitude in his CFC numbers
The table is parts per million, but the CFC numbers are at least three orders of magnitude too high. CFC11 should be 0.00025 PPM, not 0.52
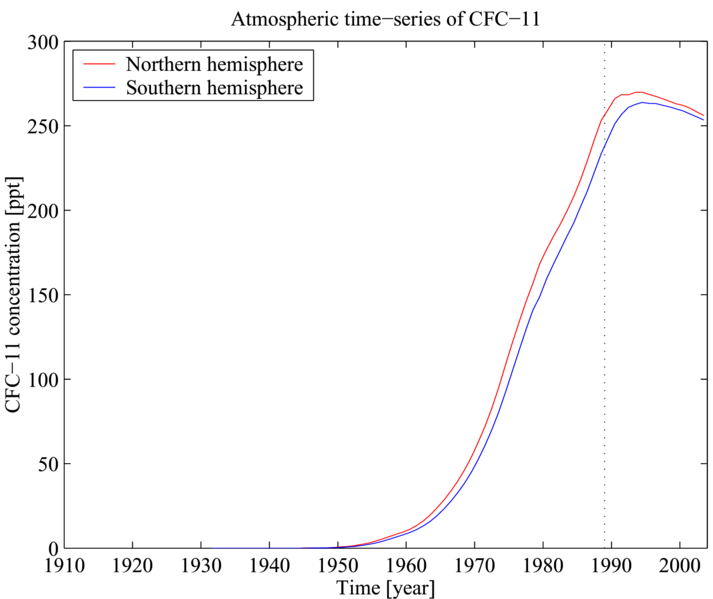
File:AYool CFC-11 history.png – Wikipedia, the free encyclopedia
If everyone on the planet was a molecule of air, less than two people would be CFC11 molecules. CFC’s play essentially no role in the greenhouse effect, as radiative transfer models show. A 1 ppm change in CO2 is 4,000 times more molecules than a doubling of CFC11.
Hansen is completely incompetent, and apparently has been for his entire career.


The chart indicates ppt from chemistry is that not Parts Per Trillion?
Exactly. 250 PPT is 0.00025 PPM
Got it, thanks.
.Last year, it is estimated humans ejected 35.5 billion tons of CO2 into the atmosphere, this is impressive until one realizes that the atmosphere weighs in at 5.5 MILLION BILLION tons. This works out to 0.00000065%
I think you should add the two hemispheres together …we can then see that his sucksess was thwarted by a misplaced decimal point.
a2a, the math is as follows:
At 400ppm the mass of atmospheric CO2 is 400 x 5.5 Bt or 2,200 Bt.
35.5 Bt per annum is 1.6% of that. Scale that up to a decade and we get 16% which is significant.
If the CO2 level is going up by 1.5ppm a year, or about 33 Bt, then most of this can be attributed to humans.
However.
The atmospheric residence time of CO2 is only about 5 years, not the humpty gazillion millenia preached by AGW followers.
According to Trenberth, biomass absorbs and releases about 440 Bt CO2 per annum. Divide 2200 by that = 5.
The erroneous 99 yotta-ans residence time calculation comes from including the approximately 40,000 gigatons of CO2 in the oceans. This assumes circulation of the deep oceans such that every drop comes to the surface at least once a year to exchange CO2 with the atmosphere.
The table may be showing global warming potential scaled to CO2. So, 1 ppt CFC11 concentration may scale to 0.5 ppm equivalent CO2.
But then the CH4 numbers don’t make sense, because their value of 2 ppm is the actual concentration of CH4, not the equivalent CO2 value.
Something is fishy with that table.
In the scenario C, does anyone know the CO2 changes that were programmed into the model? In the early 90’s the rate of CO2 increase in the atmosphere was 1.6 PPM per year and last year it was up to 2.5 PPM per year. Is the concentration of CO2 measured in the atmosphere increasing at a faster rate than scenario C? I suspect it is by a fairly wide margin.
Scenario C is no change in CO2 after 2000
Actually, I meant scenario A, business as usual. Is the concentration of CO2 building 40% faster than the business as usual case?
There is not much difference over short time periods (of a couple of decades) in the way in which Hansen’s original model calculates temperature rise whether the CO2 increase is linear or exponential. It does become more significant later on, though.
From Hansen’s paper (abstract)
“Scenario A, since it is exponential, must eventually be on
the high side of reality in view of finite resource constraints and environmental concerns, even though the growth of emissions in scenario A (?1.5% yr-1) is less than
the rate typical of the past century (?4% yr-1).”
We are above scenario A, not between A and B, not at B, and certainly not at C
I worked in the HVAC industry many years ago, and had to take the course and test to get “certified” in refrigerant use in the early ’90s. This was all about money and control… there was no money left in the old standby refrigerants R-12 and R-22, as the “Freon” patents had long expired, and many generics were cheaply available. When I started in the industry, generic R-12 was about 80 cents per pound, if I remember correctly. Compare that to the price of the current “environmentally correct” refrigerants. And of course, the existing equipment was (generally) not compatible with the environmentally correct refrigerants, so there was a ton of money to be made in new equipment sales, also. I still believe that this CFC crisis was devised as stage one of the global warming scam, to test and refine the scare tactics and money-grubbing and control. They always use scare tactics that the average joe can’t confirm – remember that NASA was telling us that CFC’s were causing this humongous ozone hole over the south pole. So we just have to trust the govt.-funded scientists, as there is no independent way to confirm their assertions. Keep up the good work Mr. Goddard in exposing these slimeball global warming crooks.
Significant places: In the table, the concentration of CFCs is given to SEVEN places of decimals. Don’t they teach anything about significant places any more? Where the number in the table is “0.5246031”, the real number is probably “0.52” (I’m not going to bother doing the calculation).
Ian M