

Disrupting the Borg is expensive and time consuming!

Google Search
-
Recent Posts
- On The Road Again
- Vandalism At The Reflecting Pool
- Fifty Years Ago Today
- Truth Or Consequences
- US Climate Trend Maps
- Declining Spring Snow Cover In Northern New Mexico
- You Can’t Fool Mother Nature
- Cattle And The Climate
- One Atomic Bomb Per Hour
- New Video : Analyzing Oil And Gas
- Is Antarctica Melting?
- High Speed Analysis And Visualization
- El Nino To The Rescue?
- Fake News Update
- Growth Of Antarctic Sea Ice
- 65 Years Of Progress!
- El Nino To The Rescue?
- Worst March Drought On Record
- ChartGL Process Control Demo
- The Biggest Money Laundering Scam
- Drought In The Headwaters Of Lake Powell
- Unrealistic Expectations Of Water Availability
- Did Bill Gates Do This?
- Worst March Drought On Record In The US
- The Real Hockey Stick Graph
Recent Comments
- Bob G on On The Road Again
- Bob G on On The Road Again
- Luigi on On The Road Again
- arn on On The Road Again
- Bob G on On The Road Again
- Bob G on On The Road Again
- Bob G on On The Road Again
- Gordon Vigurs on On The Road Again
- Bob G on On The Road Again
- Bob G on On The Road Again
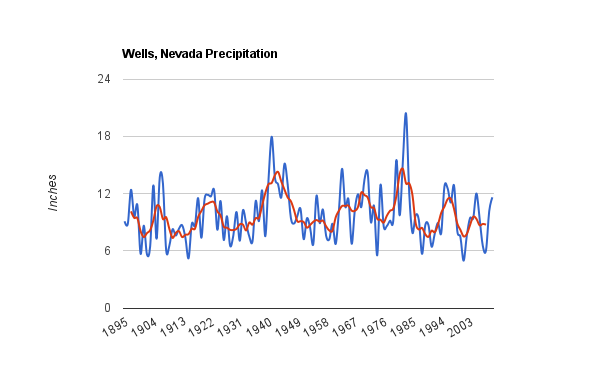
Maybe by “extremes” the doomsayers mean extremely moderate?
I’m sorry, but I just laid that one out and it has a down trend too……;)
Oh I don’t know sir… I bet if you run that through a computer model or two you can eek out a nice trend of some kind… up or down depending on your climate-mood!