
SO THIS IS SOLAR MAXIMUM?
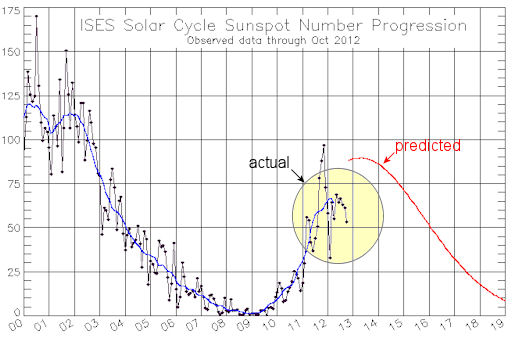
Forecasters have long expected the Solar Max of 2013 to be the weakest of the Space Age. It might be even weaker than they thought. As shown in this 20-year plot of sunspot counts vs. time, the sun is underperforming:

Disrupting the Borg is expensive and time consuming!

Google Search
-
Recent Posts
- Three Years Since The Apocalypse
- Arctic Report card Summer 2026
- Elon Pushing Pushing Geoengineering
- Earth, Wind And Fire
- On The Road Again
- Vandalism At The Reflecting Pool
- Fifty Years Ago Today
- Truth Or Consequences
- US Climate Trend Maps
- Declining Spring Snow Cover In Northern New Mexico
- You Can’t Fool Mother Nature
- Cattle And The Climate
- One Atomic Bomb Per Hour
- New Video : Analyzing Oil And Gas
- Is Antarctica Melting?
- High Speed Analysis And Visualization
- El Nino To The Rescue?
- Fake News Update
- Growth Of Antarctic Sea Ice
- 65 Years Of Progress!
- El Nino To The Rescue?
- Worst March Drought On Record
- ChartGL Process Control Demo
- The Biggest Money Laundering Scam
- Drought In The Headwaters Of Lake Powell
Recent Comments
- conrad ziefle on Three Years Since The Apocalypse
- Bob G on Three Years Since The Apocalypse
- John Francis on Elon Pushing Pushing Geoengineering
- conrad ziefle on Earth, Wind And Fire
- GW on Arctic Report card Summer 2026
- GW on Three Years Since The Apocalypse
- arn on Three Years Since The Apocalypse
- Gordon Vigurs on Three Years Since The Apocalypse
- Gordon Vigurs on Three Years Since The Apocalypse
- Denis Rushworth on Three Years Since The Apocalypse
Six years of WAGs, looks like Dec. of 2010 may have been best WAG.
http://i39.tinypic.com/34rufj9.jpg
Excellent graphic. It nicely shows the dead certainty of Hathaway’s 2006 prediction for SC24, which was an actual prediction made before SC24 began.
Can anyone say sunspot cycle 5 and the effect it had on this rock?
“Forecasters have long expected”??????? This was to be the “killer” cycle according to them. A high that would coincide with December 21st, 2012 and send flares to finish us off…
The projections fell awry of a sun that was doing its own thing. ie Not following the dictates of the scientific community. Our theories are only as good as the data that confirms them.
The low values seen are indicative of a quiescent period in solar activity. It may well decrease solar wind and thus affect GCR cloud formation resulting in more clouds and lower temperatures.
More speculation but a hypothesis that can be tested and will be demonstrated…IF we can get them to stop adjusting all of the temperature measurements upwards!
With Hansen’s 2,000 atom bombs exploding every day we’ll be warm.
According to Jan Alvestad:
http://www.solen.info/solar/
(bottom of page)
Solar max for cycle 24 may have been in February 2012 at SSN 66.9.