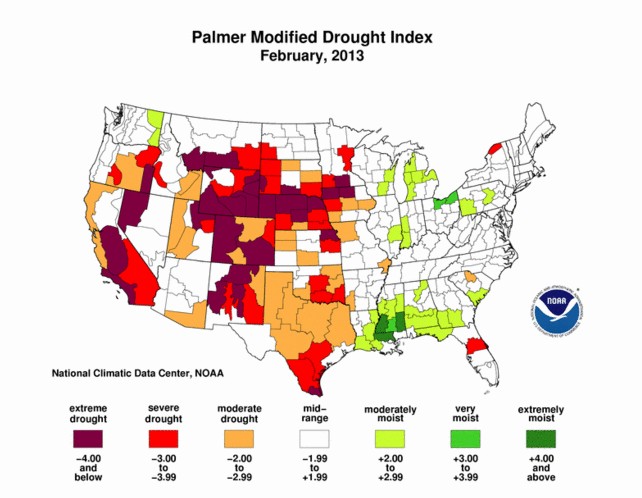
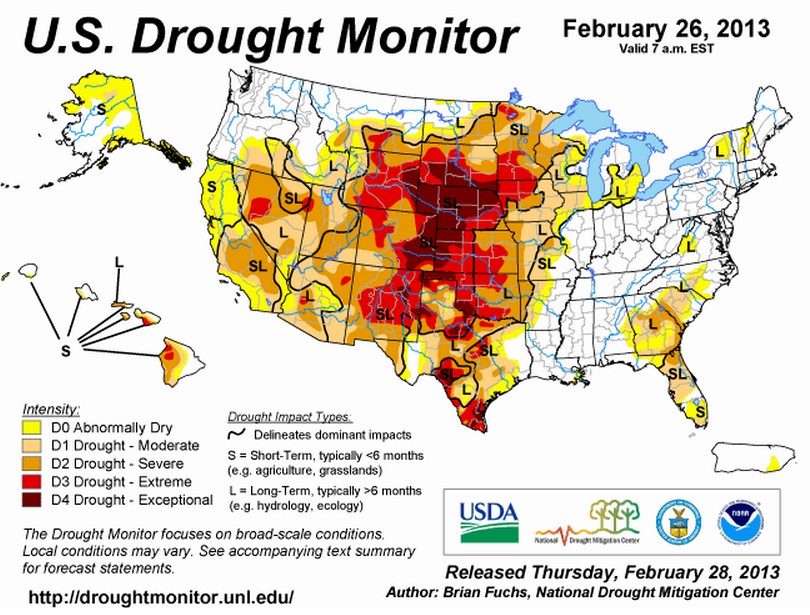
PMDI shows an excess of moisture in Georgia. and almost no drought in Arizona, but the Washington DC based US Drought Monitor artist forgot to check the actual data before getting out his airbrush.
Disrupting the Borg is expensive and time consuming!
Google Search
-
Recent Posts
- “Why Do You Resist?”
- Climate Attribution Model
- Fact Checking NASA
- Fact Checking Grok
- Fact Checking The New York Times
- New Visitech Features
- Ice-Free Arctic By 2014
- Debt-Free US Treasury Forecast
- Analyzing Big City Crime (Part 2)
- Analyzing Big City Crime
- UK Migration Caused By Global Warming
- Climate Attribution In Greece
- “Brown: ’50 days to save world'”
- The Catastrophic Influence of Bovine Methane Emissions on Extraterrestrial Climate Patterns
- Posting On X
- Seventeen Years Of Fun
- The Importance Of Good Tools
- Temperature Shifts At Blue Hill, MA
- CO2²
- Time Of Observation Bias
- Climate Scamming For Profit
- Climate Scamming For Profit
- Back To The Future
- “records going back to 1961”
- Analyzing Rainfall At Asheville
Recent Comments
- John Francis on Ice-Free Arctic By 2014
- Bob G on Climate Attribution Model
- Bob G on Climate Attribution Model
- Bob G on Climate Attribution Model
- Robertvd on “Why Do You Resist?”
- arn on “Why Do You Resist?”
- Gamecock on “Why Do You Resist?”
- Bob G on Climate Attribution Model
- Gordon Vigurs on Climate Attribution Model
- Bob G on Climate Attribution Model


When was the first image published, and do you have a link to the source?
When would you guess that a February, 2013 drought map might have been published? In 1985 perhaps?
http://www1.ncdc.noaa.gov/pub/data/cmb/drought/historical-palmers/201302-pmdi.gif
A better link for Gina: http://www.ncdc.noaa.gov/temp-and-precip/drought/historical-palmers.php?index=pdsi&month%5B%5D=2&beg_year=2013&end_year=2013&submitted=Submit
Plug in your choice of months and years, suggest compare 2012 to 1988, the 1950s and 1930s:
1988 – http://www.ncdc.noaa.gov/temp-and-precip/drought/historical-palmers.php?index=pmdi&month%5B%5D=6&month%5B%5D=7&month%5B%5D=8&month%5B%5D=9&beg_year=1988&end_year=1988&submitted=Submit
1950s – http://www.ncdc.noaa.gov/temp-and-precip/drought/historical-palmers.php?index=pmdi&month%5B%5D=6&month%5B%5D=7&month%5B%5D=8&month%5B%5D=9&beg_year=1953&end_year=1956&submitted=Submit
1930s – http://www.ncdc.noaa.gov/temp-and-precip/drought/historical-palmers.php?index=pmdi&month%5B%5D=6&month%5B%5D=7&month%5B%5D=8&month%5B%5D=9&beg_year=1931&end_year=1937&submitted=Submit
Maybe one of them is short term drought, the oither long term drought? Whatever!
They use two different methods to determine “Drought” conditions! USDA is in the Chicken Little business even more than NOAA, and NOAA is into it over their heads.
Keep posting this stuff and the droughts in the past will start to dissapear, along with strem flow data.