
Nothing about climate science reeks more of confirmation bias, than the changes scientists make to their own data sets over time. They all show exactly the same pattern of monotonically cooling the past and warming the present, regardless of the instrumentation.
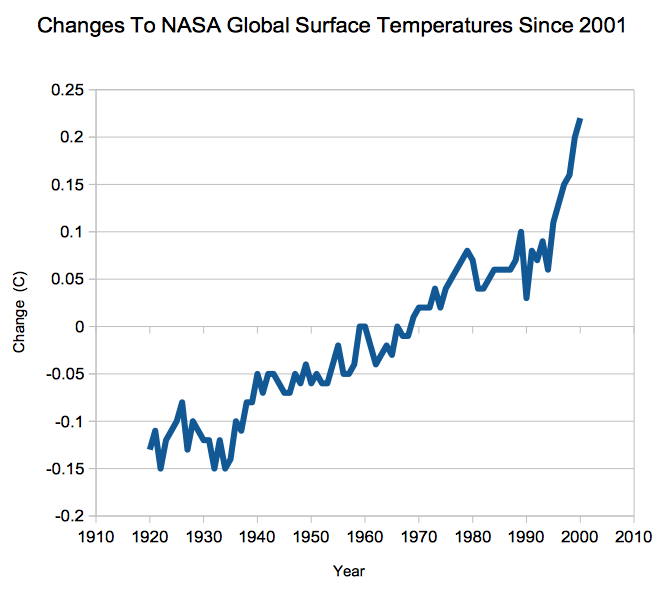
2001 version : FigA.txt 2016 version : Fig.A.txt
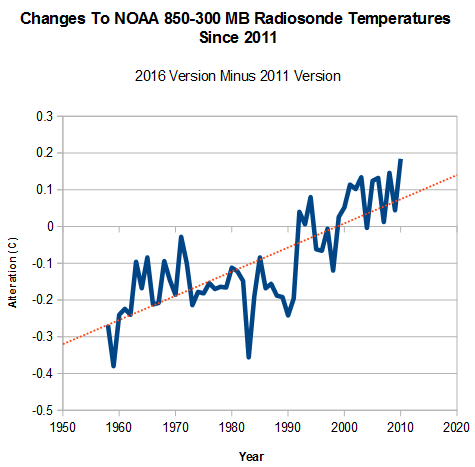
2016 version : RATPAC-A-annual-levels.txt 2011 version : global.dat
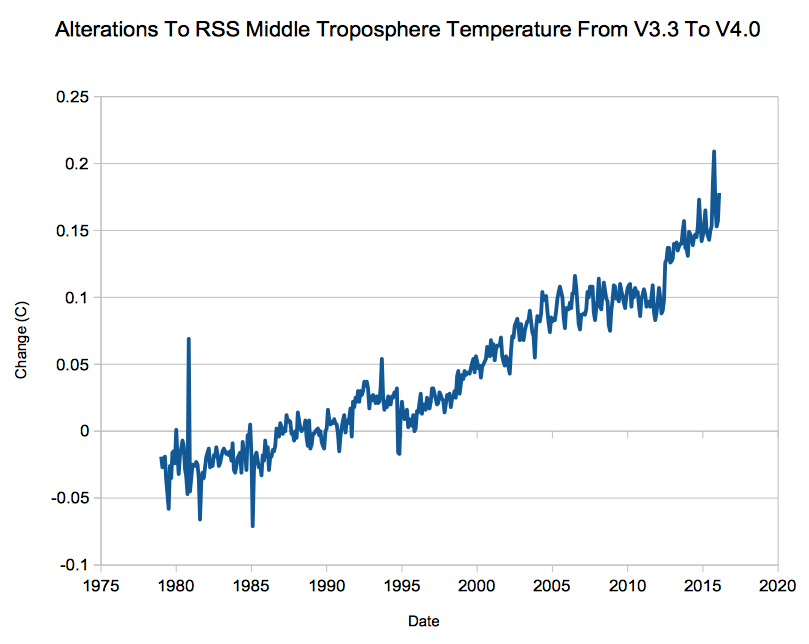
RSS_Monthly_MSU_AMSU_Channel_TMT_Anomalies_Land_and_Ocean_v04_0.txt
RSS_Monthly_MSU_AMSU_Channel_TMT_Anomalies_Land_and_Ocean_v03_3.txt
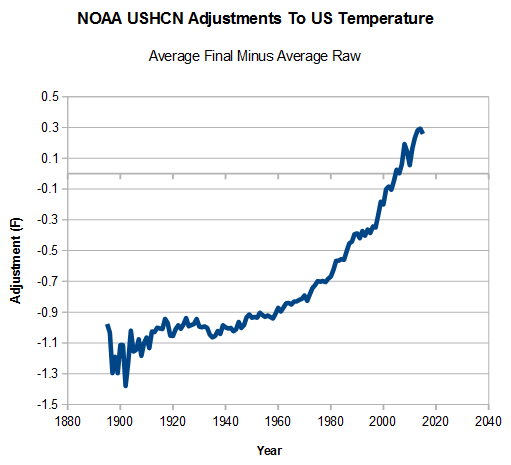
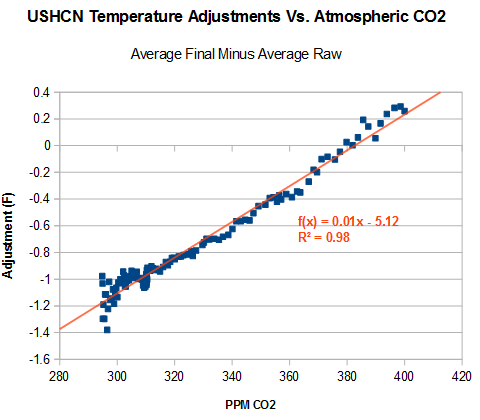
In the case of US temperature adjustments, they are made to exactly match the increase in CO2. Junk science doesn’t get any worse than that.

Why would governments pay scientists public funds to deceive the public?
Dr. Harvest Collier once said to my class, “See O.K. Manuel”.
Cornelius,
Was Harvest Collier’s student one of five that helped make 3-D plots of rest masses of 3,000 types of atoms that compromise all matter in the Spring Semester of 2000 to find that NEUTRON REPULSION IN THE CORE OF THE SUN IS THE FORCE OF CREATION, PRESERVATION & DESTRUCTION OF ATOMS, LIVES & PLANETS IN THE SOLAR SYSTEM?
https://dl.dropboxusercontent.com/u/10640850/The_FORCE_of_Creation_Preservation_and_Destruction.pdf
Thanks, Cornelius.
Harvest Collier was perhaps too young to know that former President Dwight Eisenhower had warned in January 1961 that government scientists might take control of US policy:
https://m.youtube.com/watch?v=GOLld5PR4ts
Ted Cruz may be the only presidential candidate who is capable of taking US policy back away from the US National Academy of Sciences.
In order to deceive the public into paying a tax willingly. Doesn’t make a bit of sense unless your job is to spend other people’s money.
The gold(digger) standard!
Pretty stupid considering the effect “should” correlate with log(CO2). If they were smart, they would be showing a deceleration in data tampering, instead they show acceleration.
Theoretically, yes, the CO2 effect is logarithmic, but by the time you get up to concentrations of CO2 in the 100s of parts per million, the effect is very, very close to linear. Besides, they are more interested in adjusting to match the models than they are to matching the physics.
Make that linear with a slope of zero.
That seems to be best supported by observation.
Everybody had to know this was coming, first they fiddled with the land temperatures(calling TOBS et al), then they fiddled with the ocean temperatures (their own soni buoys less reliable than ship intake water), then they fiddled with satellite data (decaying orbits, bad algorithm et al). now the inevitable weather ballon fiddling.
Was nice to see even Drudge linked to your last post, and missing posts by gail always interesting.
Is Gail okay? She is a gold mine of information.
It’s true for sea level too:
http://oi58.tinypic.com/331k5ya.jpg
The only odd one out is Leif, who has FLATTENED the solar TSI…
…… so it can’t be used as the obvious forcing for the adjusted temperatures.
And let’s not forget the purposeful removal of the late 1930′ peak. !
This is the big enchilada, the smoking gun of climate fraud.
How on Earth these lying warmista jackasses get away with these shenanigans, year after year, for all of this time, is the biggest mystery of all.
It is like scientific credulity has been taken hostage and our economy is the ransom.
“scientific credulity” probably should read “scientific credibility”
do
i
Best post ever. Shared!
And then there’s “Correcting Ocean Cooling”
http://earthobservatory.nasa.gov/Features/OceanCooling/
Paul Homewood also has a great post on data fraud…
https://notalotofpeopleknowthat.wordpress.com/2016/03/09/how-the-pause-was-made-to-disappear/
And he quotes from Karl’s “pausebuster” study…
Previous analyses of global temperature trends during the first decade of the 21st century seemed to indicate that warming had stalled. This allowed critics of the idea of global warming to claim that concern about climate change was misplaced. Karl et al. now show that temperatures did not plateau as thought and that the supposed warming “hiatus” is just an artifact of earlier analyses. Warming has continued at a pace similar to that of the last half of the 20th century, and the slowdown was just an illusion.
Then that makes the warming trend found in Karl’s paper “an artifact of later analyses. These grantologists really are just parroting words they have heard while preening.
“Academia stinks. Academia is a heartless, cold bureaucracy. Colleges and Universities… are a breeding house for parrots.”
-Christopher Langan
“These grantologists really are just parroting words they have heard while preening.”
I suspect that his family physician may have ordered Karl to remove all mirrors from his home. Why take a chance that he might try to peck himself to death?
I don’t know the odds but it would be a nasty fight. Anyway, here he is all relaxed on a weekend:
http://www.ametsoc.org/boardpges/cwce/docs/profiles/KarlThomasR/profile.jpg
And here he is all anxious to go to work on the next pause-busting paper:
http://i64.tinypic.com/35lt4ci.jpg
Daaaaaang! Just when I think that the envelope has been pushed as far as possible, something comes along and proves that I underestimated the creativity of idiots!
What is their rationale for making these corrections?
Funding.
Hey ST! “What is their rationale for making these corrections?”
There is usually (not always) some not-very-well-defined rationale given. Maybe they have decided to include a new data set. Or drop out an old data set. Or maybe they have a new procedure for determining which readings are outliers and likely to be erroneous. Or they have readjusted their corrections for urban heating based on how bright cities look in satellite photos. And so on and so on… Sometimes there is no clear reason given at all. Even when they give a reason, there never seems to be enough detail given to independently verify the corrections. Additionally, they often “adjust” readings that were made a hundred years ago — as if some new information just became available that allows us to better interpret what a thermometer said long after everyone concerned is dead and buried! As a general rule of thumb, when errors of measurement are made, they may go either way, too high or too low. One would expect that the corrections would be roughly equal in those that adjust upward and those that adjust downward. We DO see adjustments that go both ways, but the adjustments are temporally skewed. Old measurements are overwhelmingly adjusted to be cooler, and recent measurements are overwhelmingly adjusted to be warmer. Year after year after year, we sceptics have seen each succeeding round of data adjustments cool the past and warm the present. If the subject were not so serious, it would be a joke. They have even adjusted measurements far beyond the documented error bands which they have placed on earlier versions.
Here is a simple way to do a quick sanity check to see whether current charts make sense. We know that if the average temperature really and truly rises even a small amount, it will dramatically increase the odds of record high temperatures. Remember the analogy of the loaded dice? If you move the hump of a Gaussian distribution even a little the wings of the curve change their distribution quite a lot. We are being told that the current US average temperatures are record setting highs. One set of temperature records that is very difficult to change without someone noticing is the state by state all time high temperatures. You can change monthly or yearly averages and who will ever notice? But if you falsely claim that new all time state records have been set, that is more difficult to do, people will notice. Check what the US states all-time temperature records are. See which decade shows the most high records. It is not the current last couple of decades. Instead, it is the decade which the OLD temperature records showed as the hottest, before they started “adjusting” so heavily.
So not a scientist but an observer and here is my question. IF all of the data has been tampered with, then doesn’t that nullify EVERY single prediction to this point due to a corrupted database? If the IPCC said 4 degrees C by X, based on the historical records, then that number is immediately thrown out because of the historical record change, or am I missing something? And to me, if they cool the past and heat the present, shouldn’t that make the predictions even further off?
Don’t you just love that first graph (NASA)? Hundredths of degrees take *giant* leaps. I call that visual deception/distortion of the facts. Good grief. They weren’t reading hundredths of degrees 100 years ago, were they?
Reblogged this on Climate Collections.