

Disrupting the Borg is expensive and time consuming!

Google Search
-
Recent Posts
- On The Road Again
- Vandalism At The Reflecting Pool
- Fifty Years Ago Today
- Truth Or Consequences
- US Climate Trend Maps
- Declining Spring Snow Cover In Northern New Mexico
- You Can’t Fool Mother Nature
- Cattle And The Climate
- One Atomic Bomb Per Hour
- New Video : Analyzing Oil And Gas
- Is Antarctica Melting?
- High Speed Analysis And Visualization
- El Nino To The Rescue?
- Fake News Update
- Growth Of Antarctic Sea Ice
- 65 Years Of Progress!
- El Nino To The Rescue?
- Worst March Drought On Record
- ChartGL Process Control Demo
- The Biggest Money Laundering Scam
- Drought In The Headwaters Of Lake Powell
- Unrealistic Expectations Of Water Availability
- Did Bill Gates Do This?
- Worst March Drought On Record In The US
- The Real Hockey Stick Graph
Recent Comments
- Gordon Vigurs on On The Road Again
- Bob G on On The Road Again
- Bob G on On The Road Again
- Bob G on On The Road Again
- Gordon Vigurs on On The Road Again
- Bob G on On The Road Again
- Bob G on On The Road Again
- Bob G on Vandalism At The Reflecting Pool
- arn on On The Road Again
- Gordon Vigurs on On The Road Again
New Video : Your Tax Dollars Being Used To Push Massive Climate Fraud On Public Radio
Posted in Uncategorized
Leave a comment
PBS – Global Warming Killed All Life On Earth 17 Years Ago
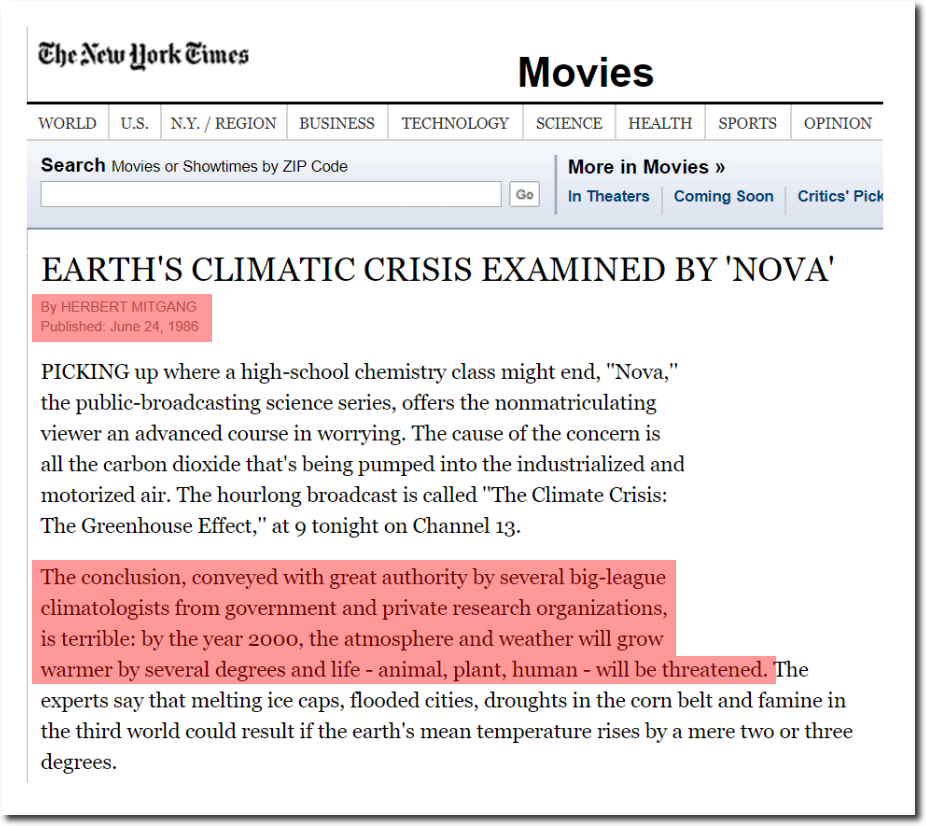
In 1986, fake news New York Times and fake news PBS said global warming threatened all life on earth by the year 2000.
Posted in Uncategorized
Leave a comment
Recycling Mindless Fear
Experts say New York will drown.
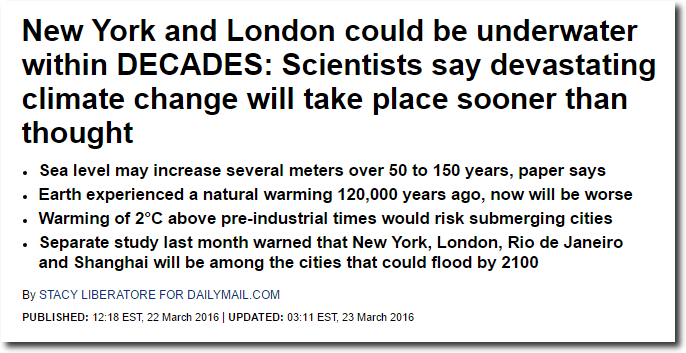
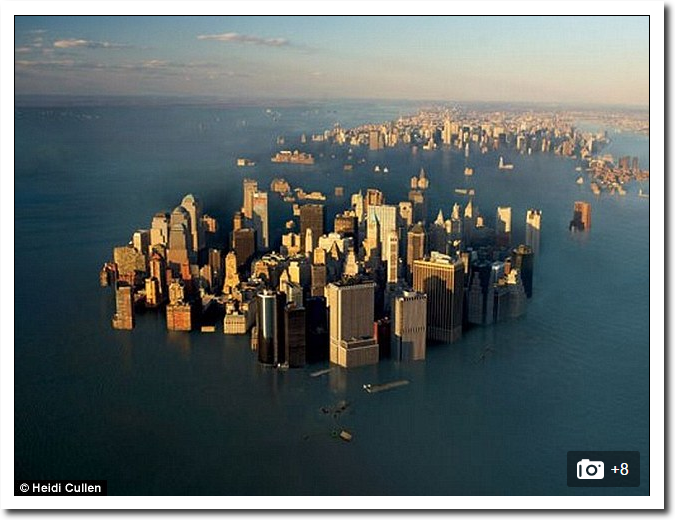
New York and London could be underwater within DECADES due to climate change |
Same story as 1934.
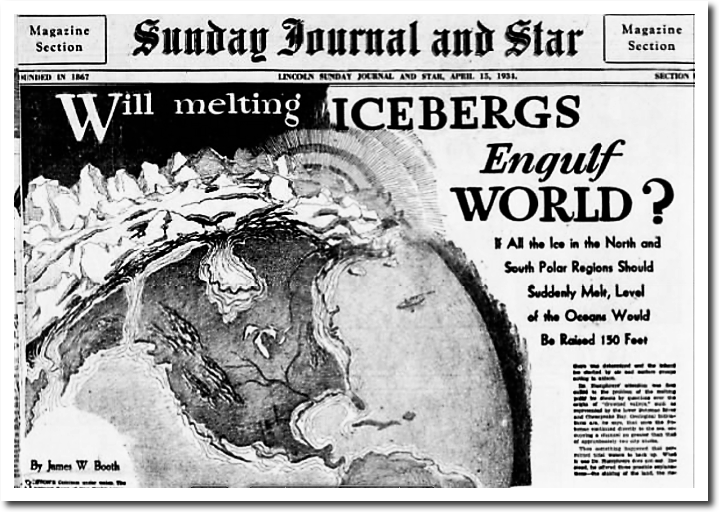

15 Apr 1934, Page 33 – The Lincoln Star
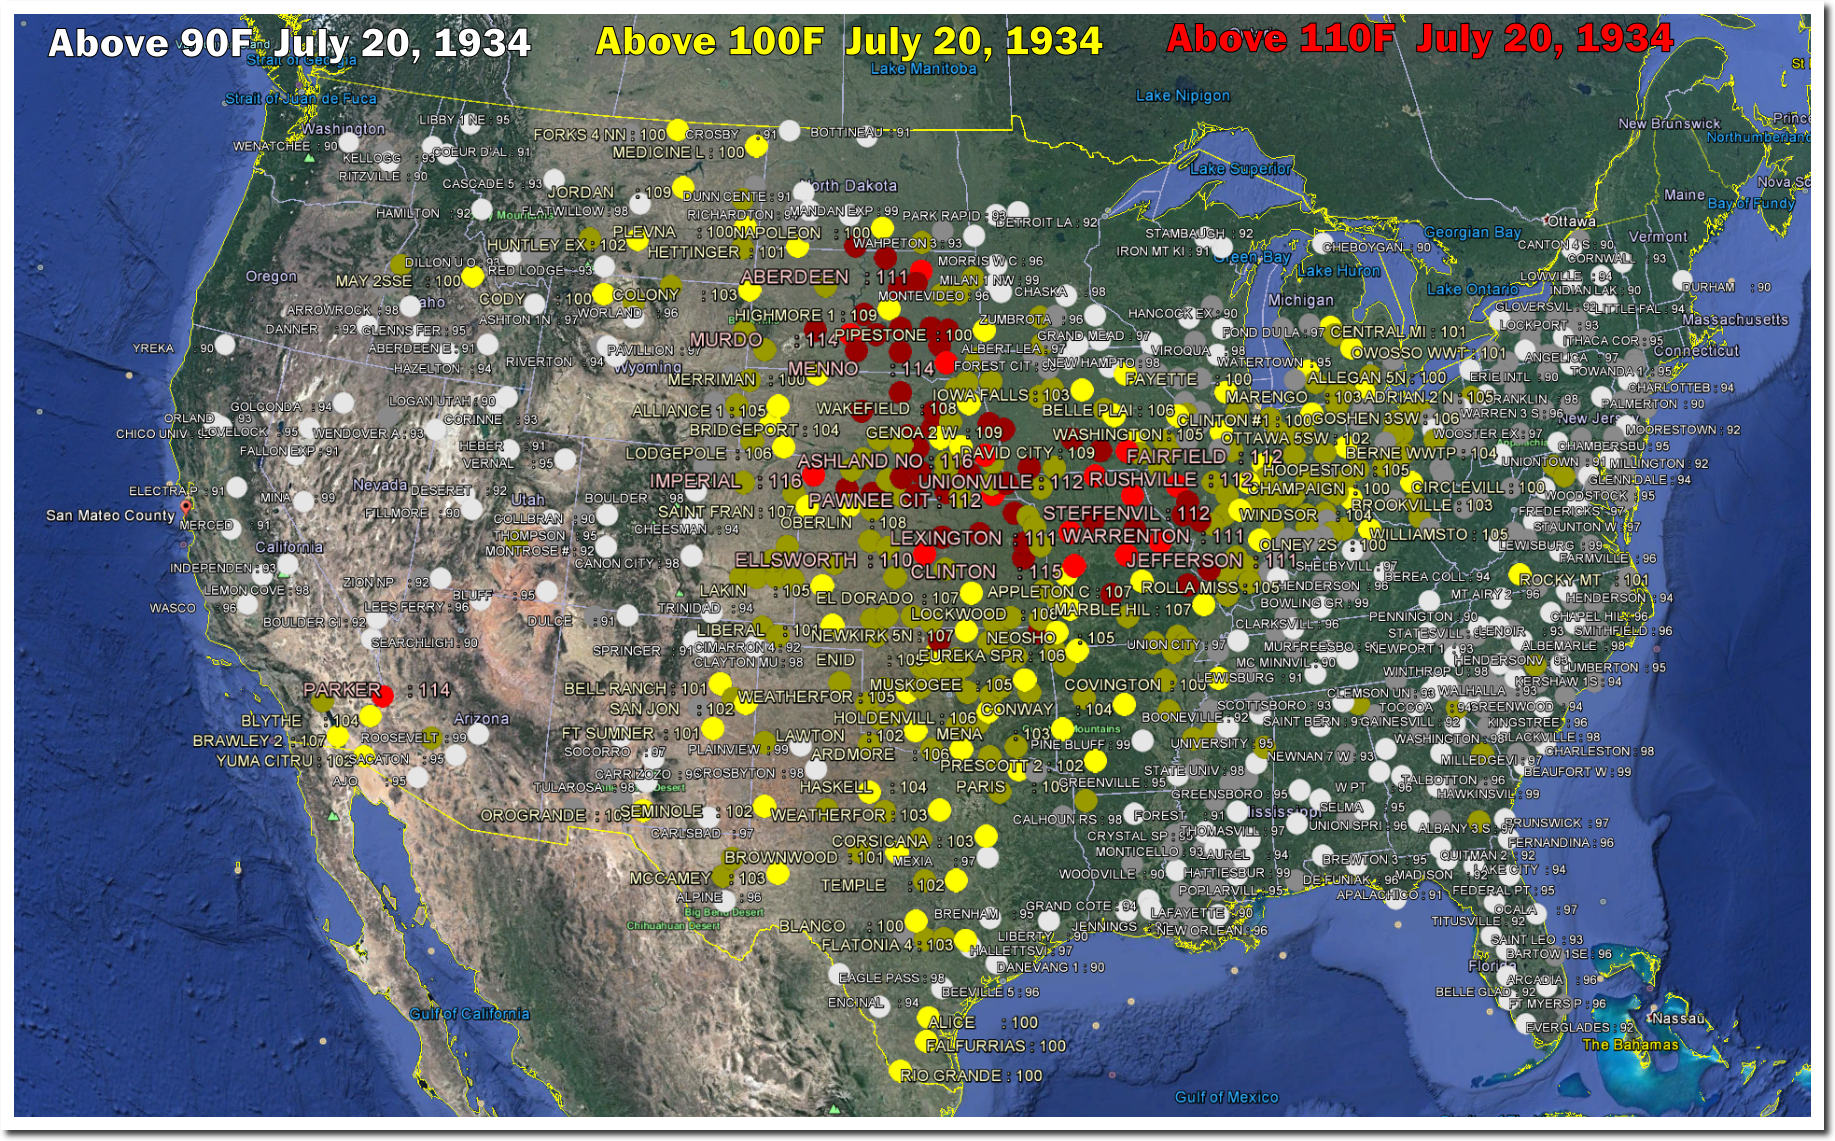
The only difference is that unlike now, it actually was hot in 1934.
Posted in Uncategorized
Leave a comment
Climate Mafia Strikes Again : This Time With Satellite Sea Level Data
Posted in Uncategorized
Leave a comment
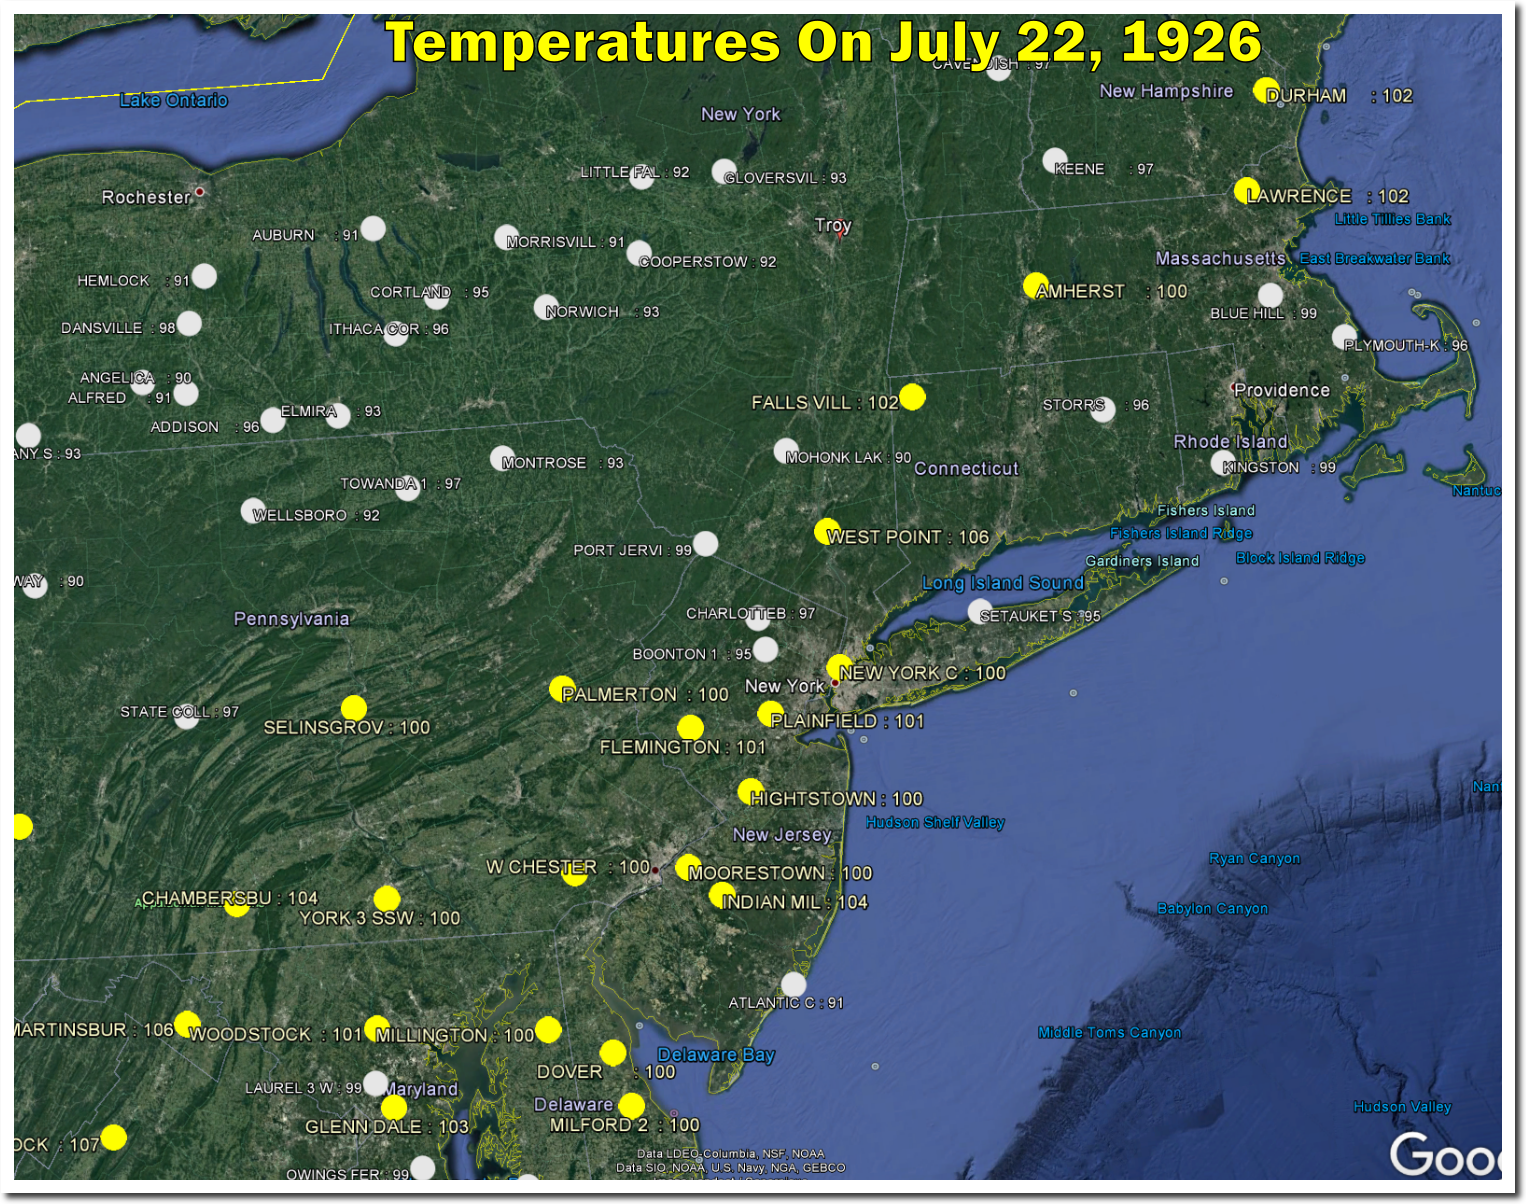
July 22, 1926 – 109 Degrees In Troy, New York
The highest temperature ever recorded in New York State was 109 degrees on this date in 1926.
This was followed shortly thereafter by the most destructive hurricane in US history, which wrecked most of Miami.
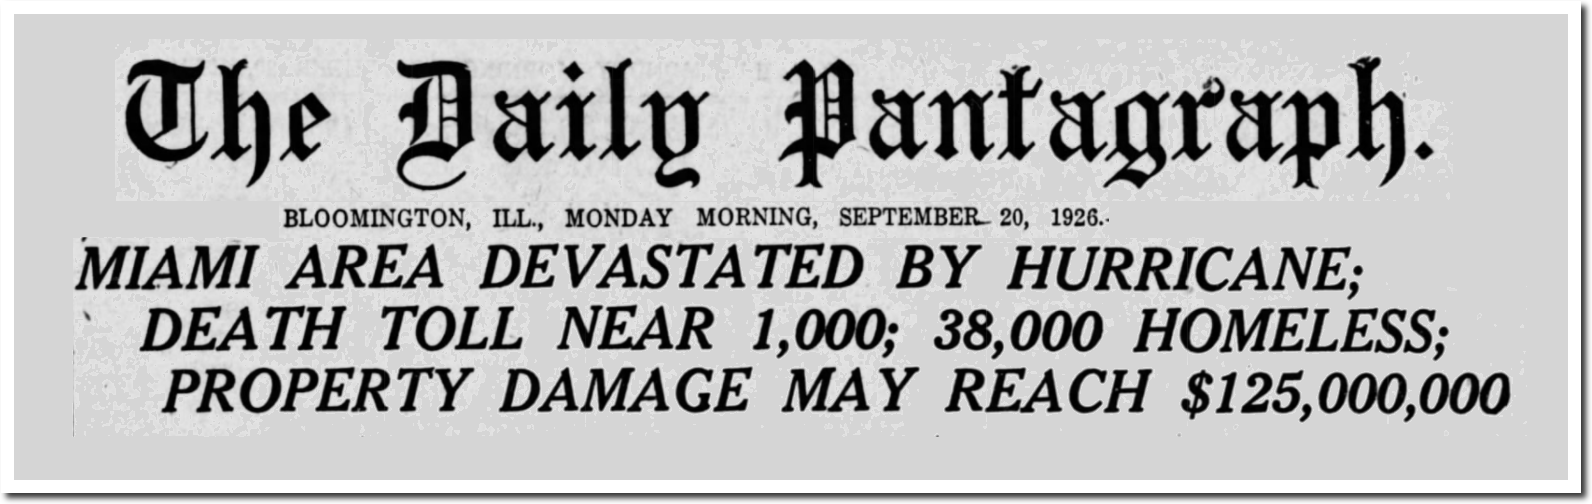

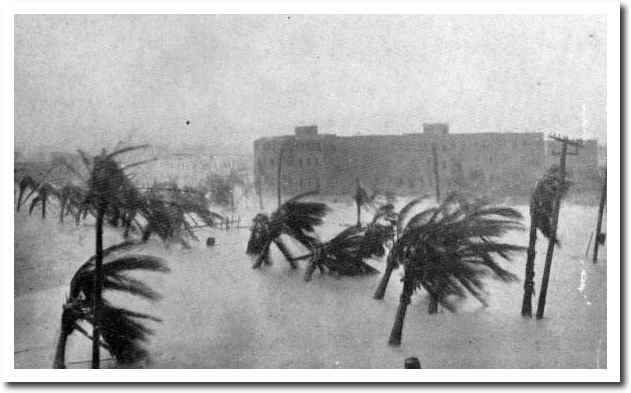
20 Sep 1926, Page 1 – The Pantagraph
Right after that came the most destructive flood in US history on the Mississippi River, which lasted for more than six months.
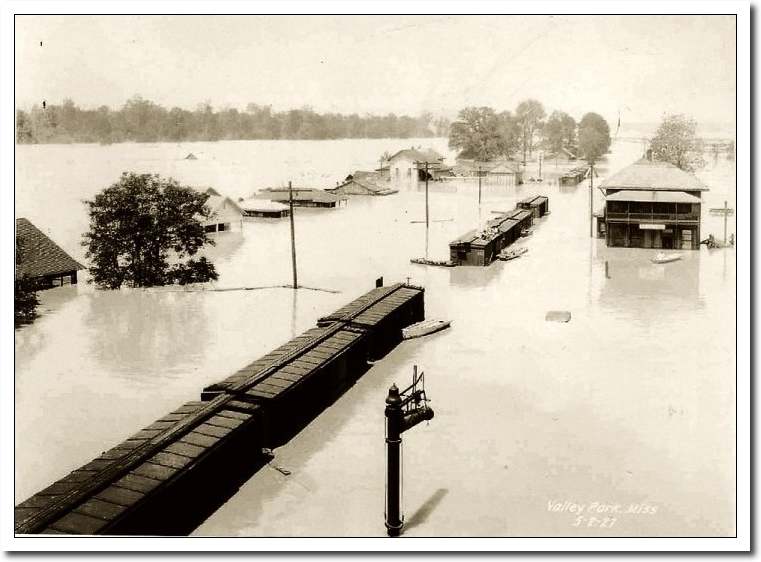

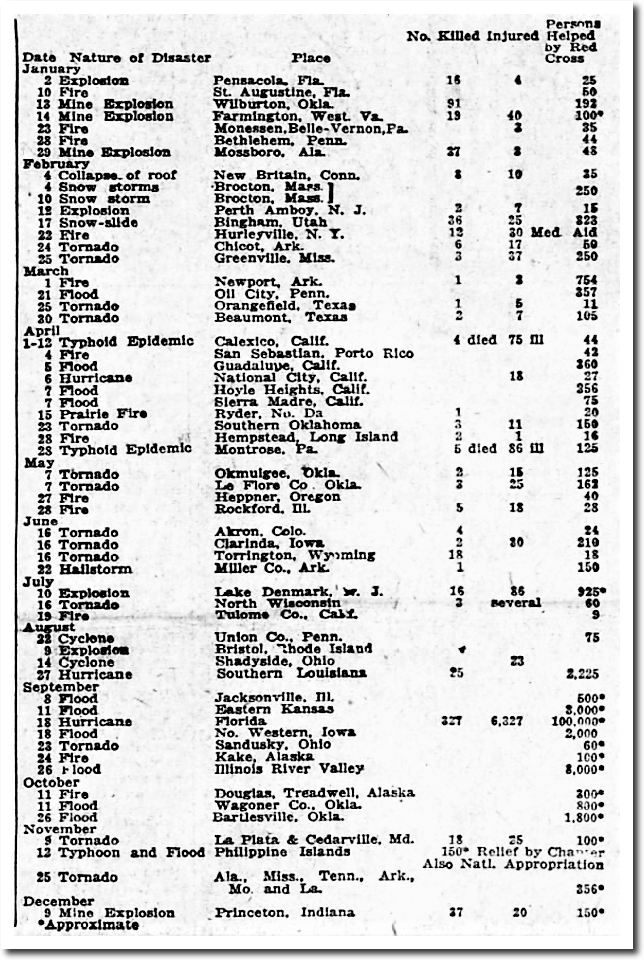
09 Jan 1927, 29 – The Morning Call
We have gotten used to very mild weather in this country, which has made the job much harder for climate snake oil salesmen. But CO2 levels were very low in 1926, and the weather was much more extreme than anything most Americans have experienced.
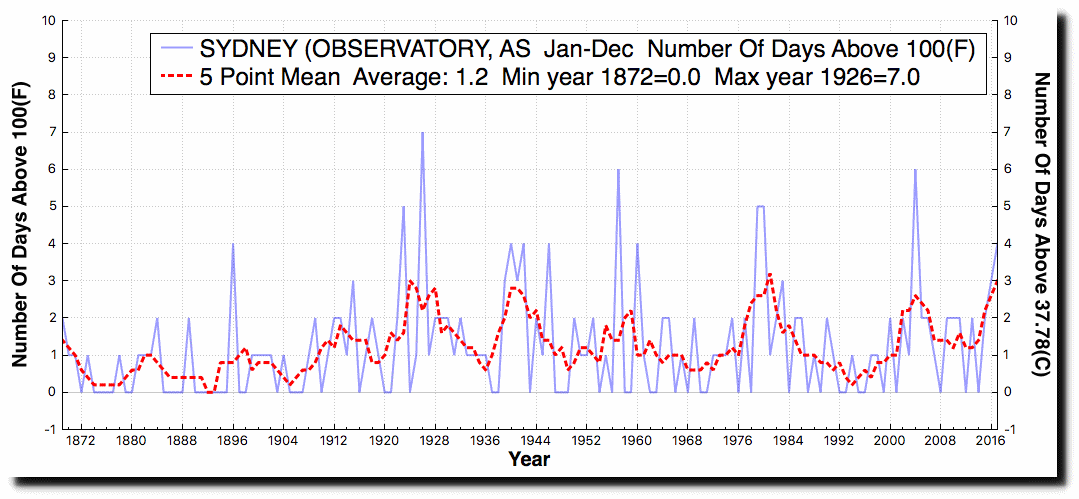
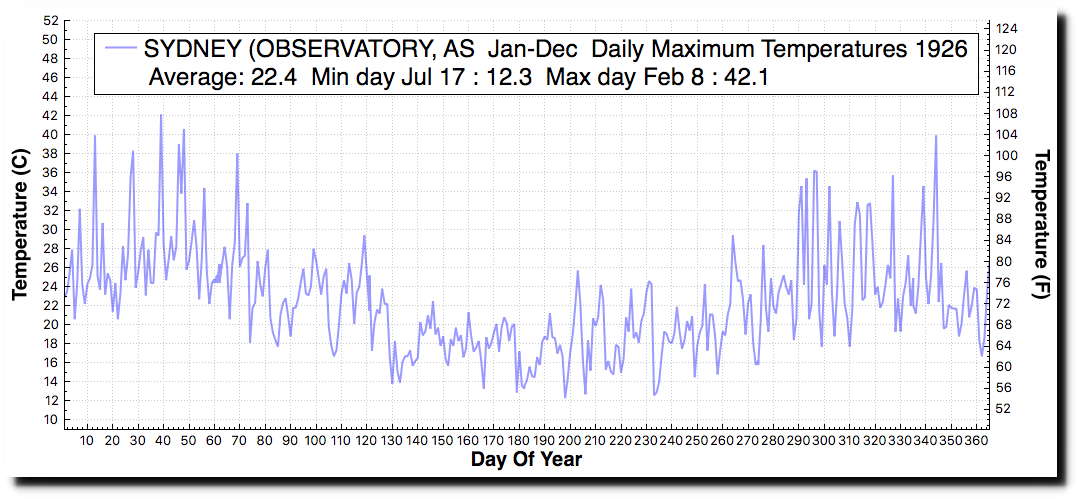
1926 was also the only year when Sydney, Australia had seven days over 100 degrees.
Posted in Uncategorized
Leave a comment
A Long History Of European Heat And Drought
Your SUV made rivers in Europe dry up in the year 1132. In 1152, it was hot enough in Europe to cook eggs in the sand. Many soldiers died from the heat in 1160, during the non-recently erased Medieval Warm Period. This article lists a long history of extreme heat, death and drought, which were all caused retroactively by your SUV.
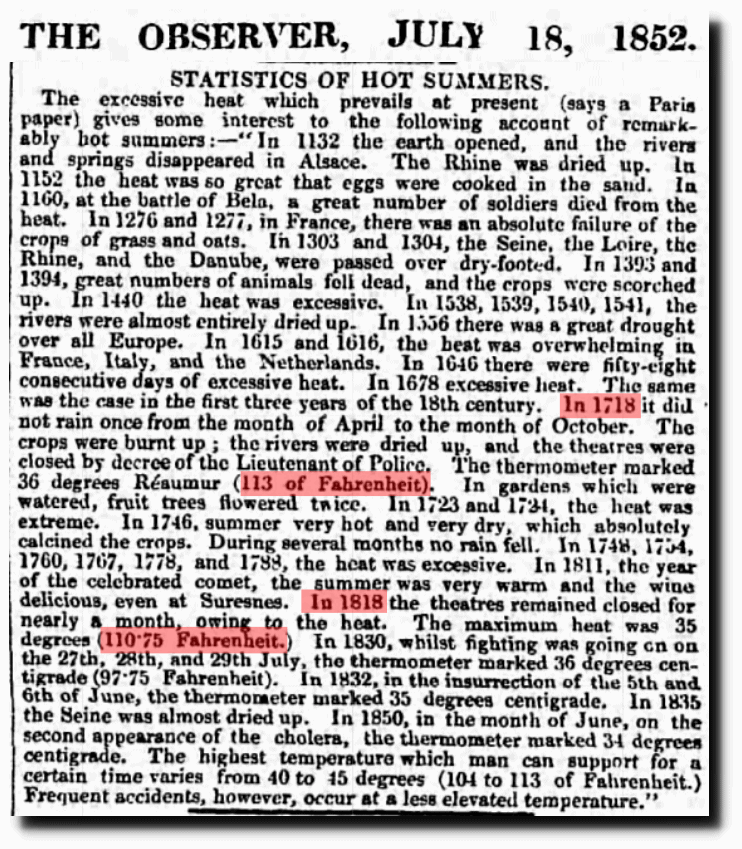
18 Jul 1852, 7 – The Observer at Newspapers.com
No worries though. Gavin Schmidt and Michael Mann will adjust the data, and bring all those people who died from the heat back to life.
Posted in Uncategorized
Leave a comment
Climate Mafia At Work On Sea Level
One week after they forced Carl Mears into compliance over satellite temperatures, the climate mafia has forced the University of Colorado into compliance over satellite sea level measurements.
The numbers didn’t add up. Even as Earth grew warmer and glaciers and ice sheets thawed, decades of satellite data seemed to show that the rate of sea-level rise was holding steady—or even declining.
Nerem’s team calculated that the rate of sea-level rise increased from around 1.8 millimetres per year in 1993 to roughly 3.9 millimetres per year today as a result of global warming.
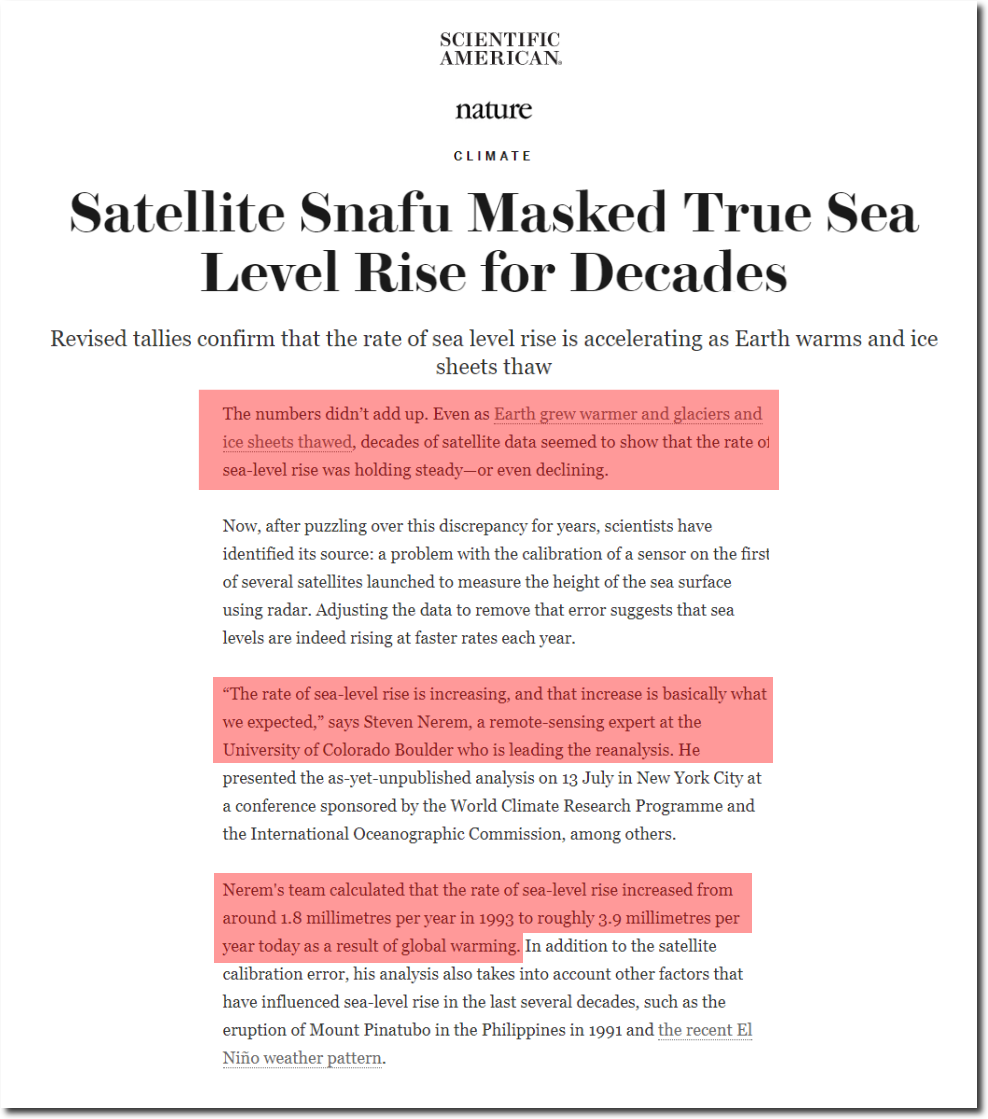
Satellite Snafu Masked True Sea Level Rise for Decades – Scientific American
The same story repeats itself over and over again. Climate scientists adjusting the data to increase the imaginary effects of global warming.
Never mind that Antarctica is gaining ice, not losing it, causing sea level to fall.
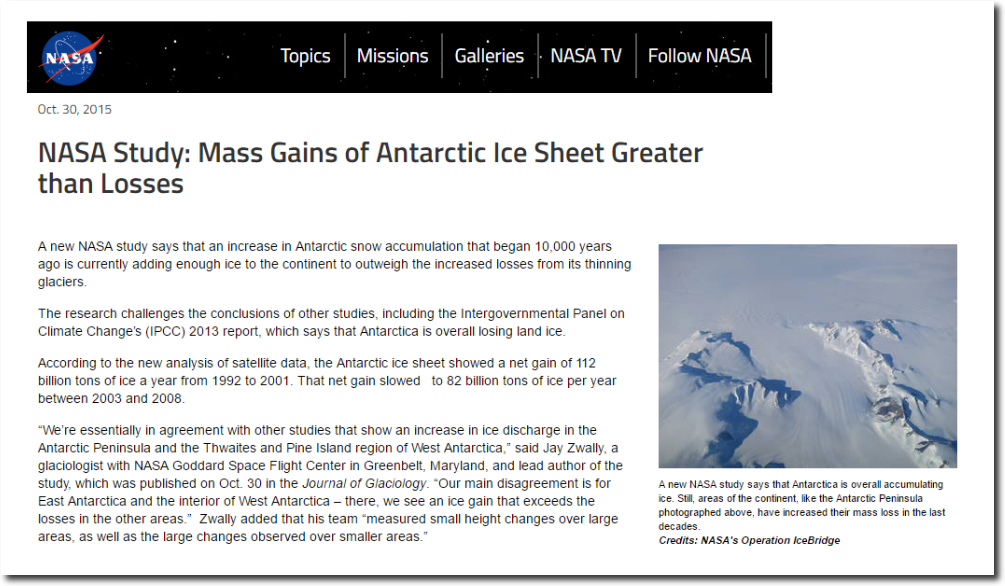
NASA Study: Mass Gains of Antarctic Ice Sheet Greater than Losses | NASA
Never mind that the surface of Greenland has gained more than 600 billion tons of ice over the past year, causing sea level to fall.
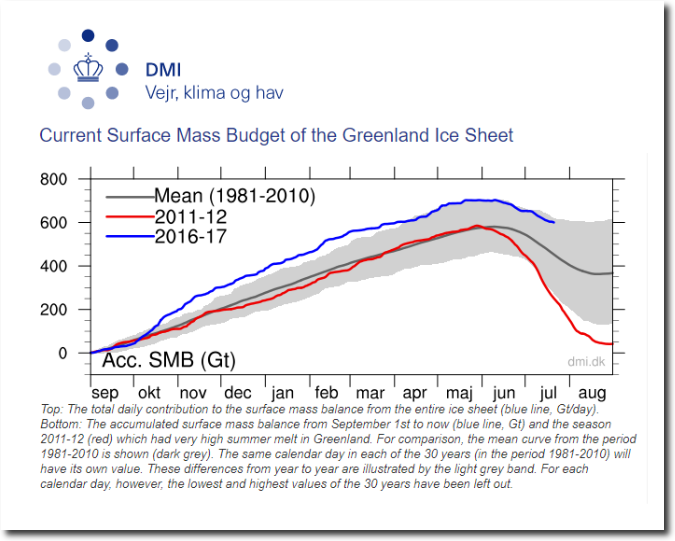
Greenland Ice Sheet Surface Mass Budget: DMI
Never mind that tide gauges don’t show any increase in the rate of sea level rise, much less a doubling.
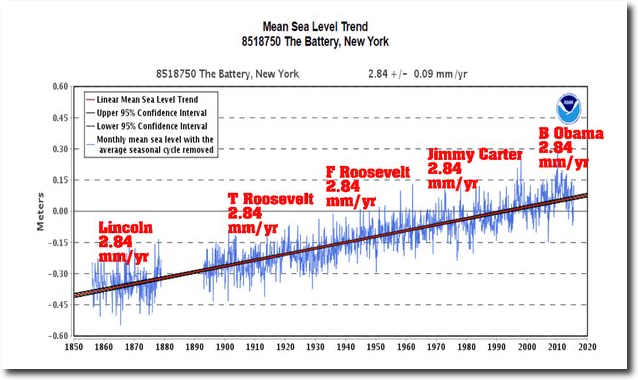
Sea Level Trends – State Selection

Sea Level Trends – State Selection
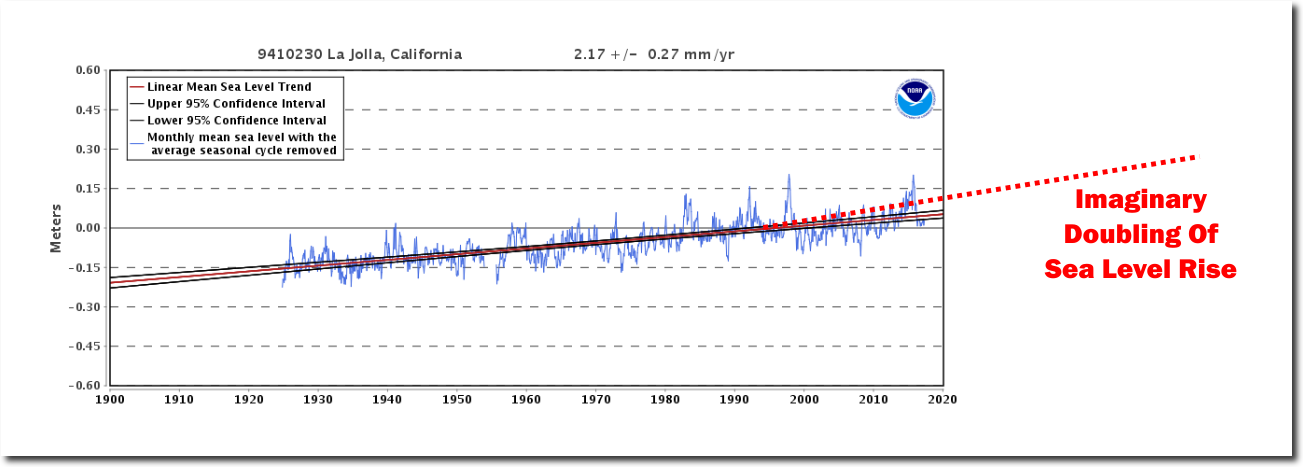
Sea Level Trends – State Selection
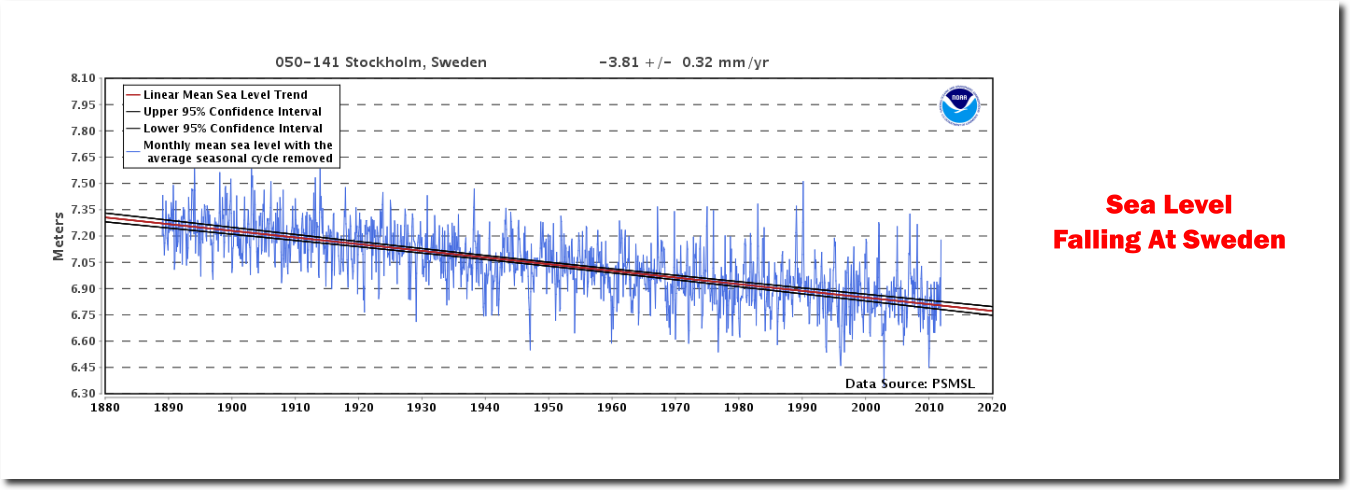
Global Sea Level Trends – Mean Sea Level Trend
The latest claims are more than double what tide gauges show.
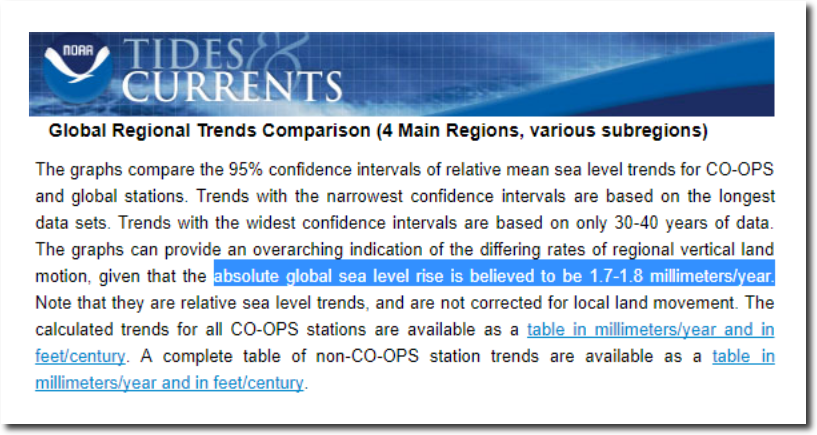
Sea Level Trends – Global Regional Trends
Ninety percent of tide gauges show less sea level rise than the latest satellite adjustments.
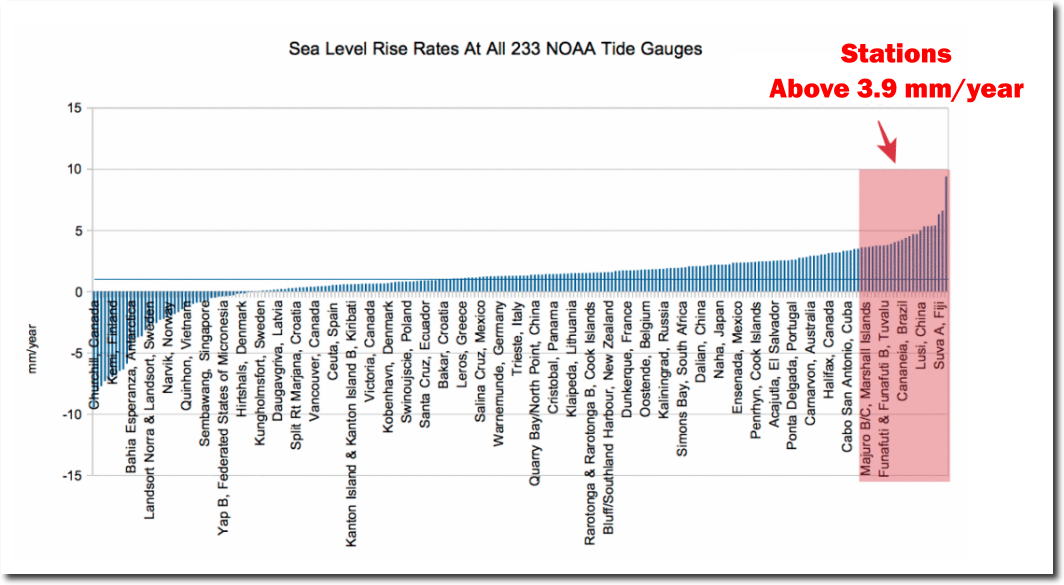
Sea Level Trends – MSL global stations trends table
The climate mafia is also at work trying to increase the rate of tide gauge sea level rise, but individual stations don’t show this increase.
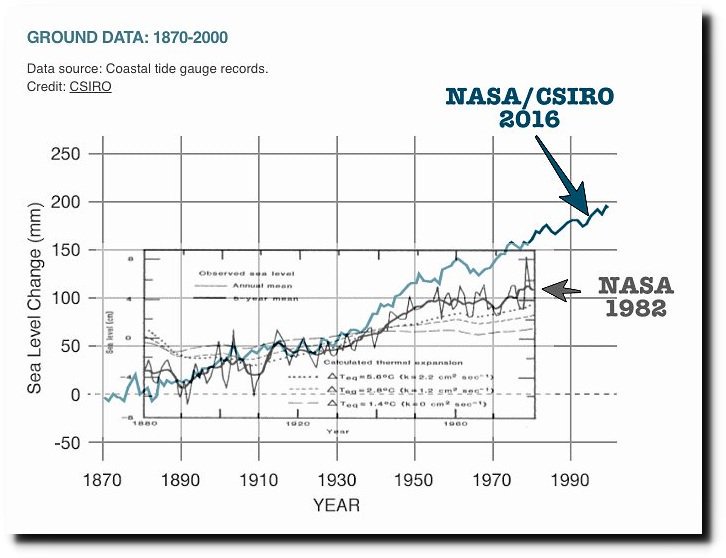
These people are not scientists – they are criminals perpetrating a multi-billion dollar fraud. They need to be called out and shut down permanently. This fraud needs to end.
Posted in Uncategorized
Leave a comment
NOAA’s Complete Fake Climate Extremes Index
“Doublethink means the power of holding two contradictory beliefs in one’s mind simultaneously, and accepting both of them.”
- George Orwell 1984
The EPA has this graph on their website, showing that the worst US heatwaves (by far) occurred during the 1930’s.
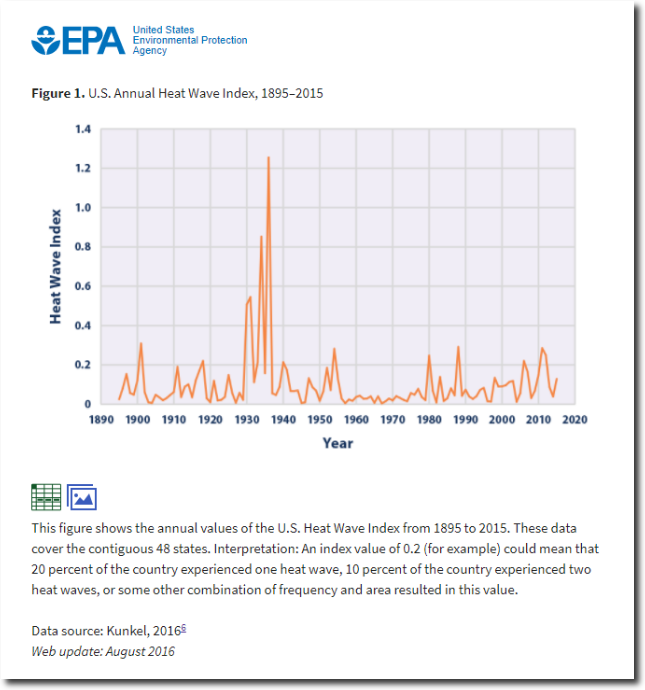
But in classic Orwellian doublespeak, the EPA has another graph claiming the US experiences more unusually hot summer temperatures (the definition of heatwaves) than in the 1930’s.

The two claims are mutually exclusive, and trace back to NOAA’s Climate Extremes Index (CEI) which shows that summer maximum temperatures in 2012 were hotter than in 1936.
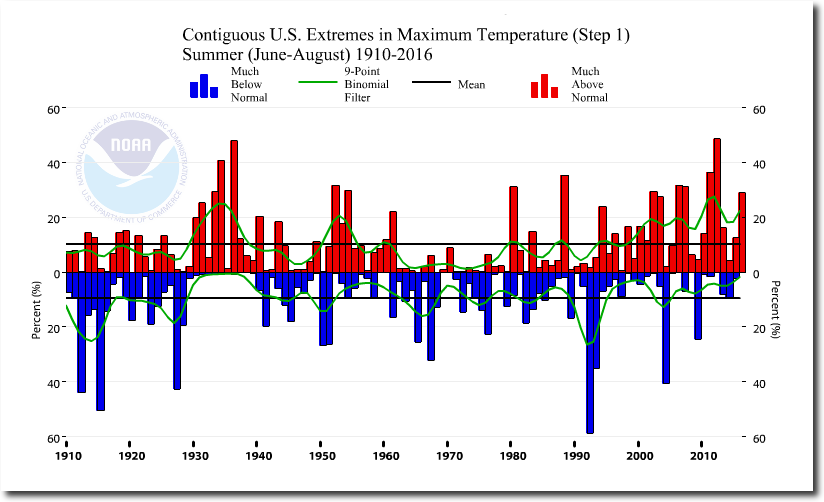
If you have been following my blog, you know that this claim is 100% fraudulent. The 1930’s were much hotter than recent years, and the frequency of heatwaves has plummeted. Below I have compiled all possible tests of this metric, and every single one of them shows that the 1930’s were much hotter than any recent years – agreeing with the first EPA graph.
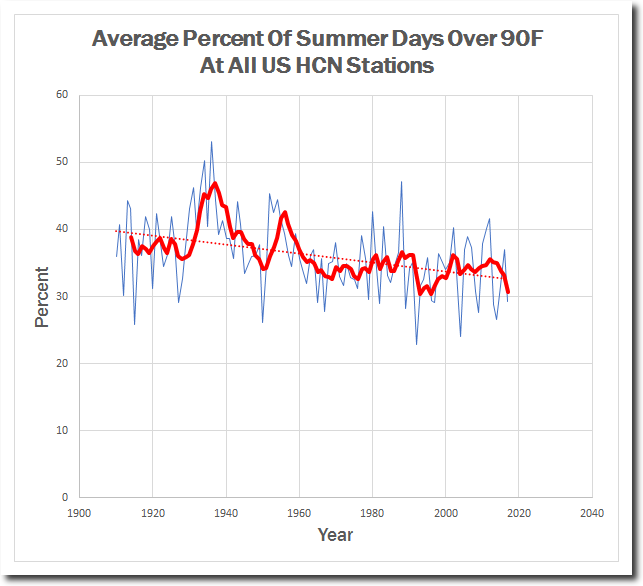
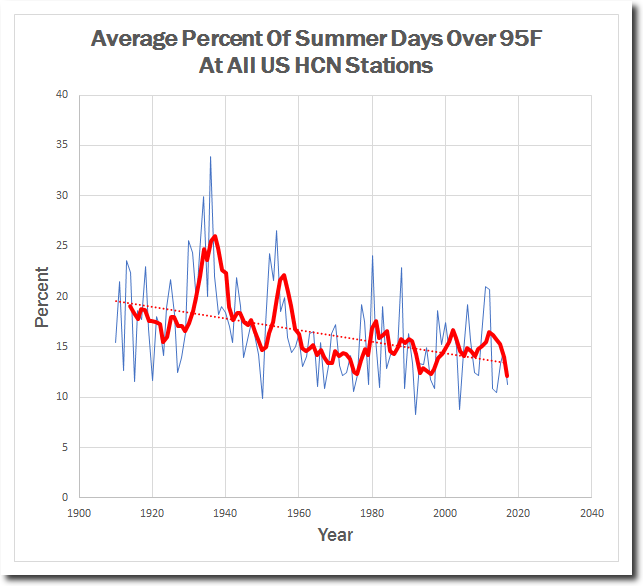

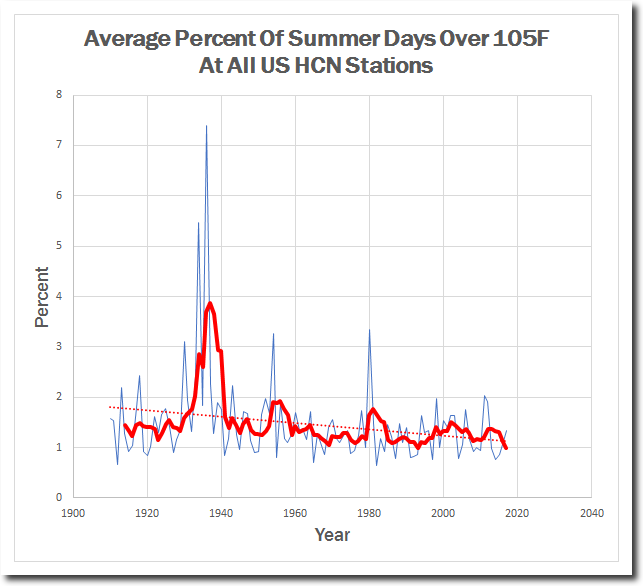
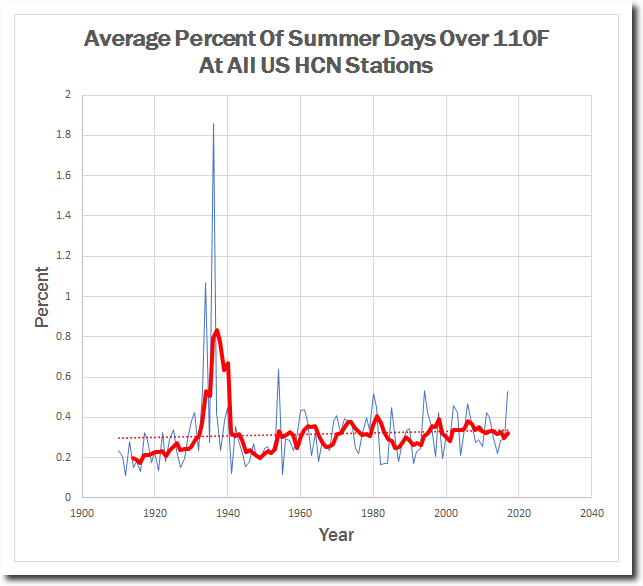
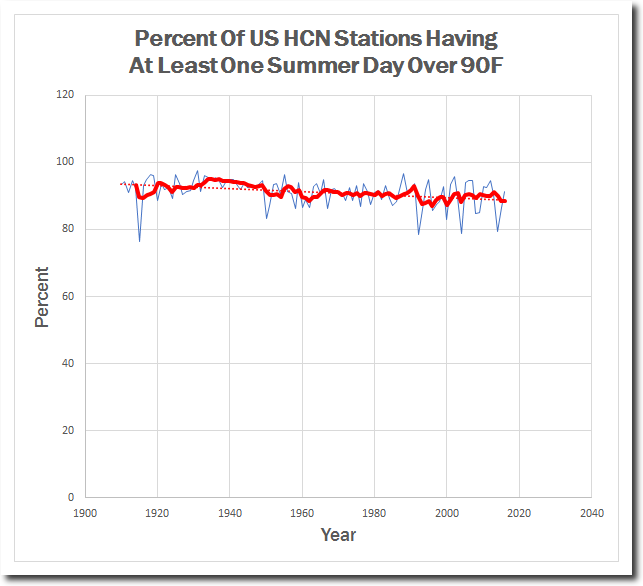

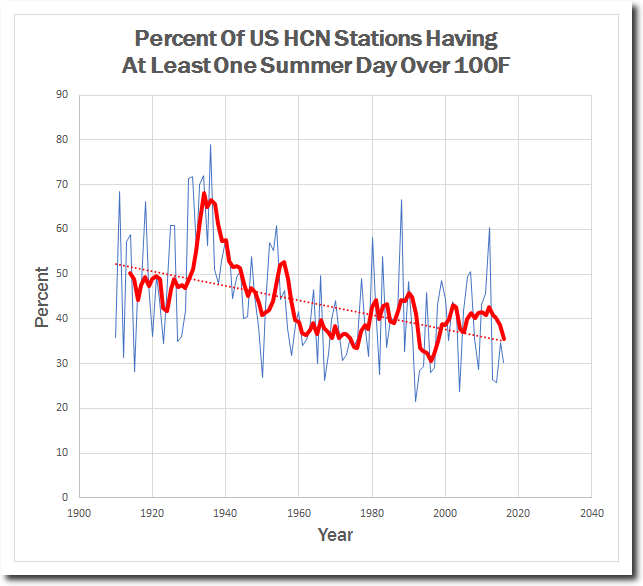
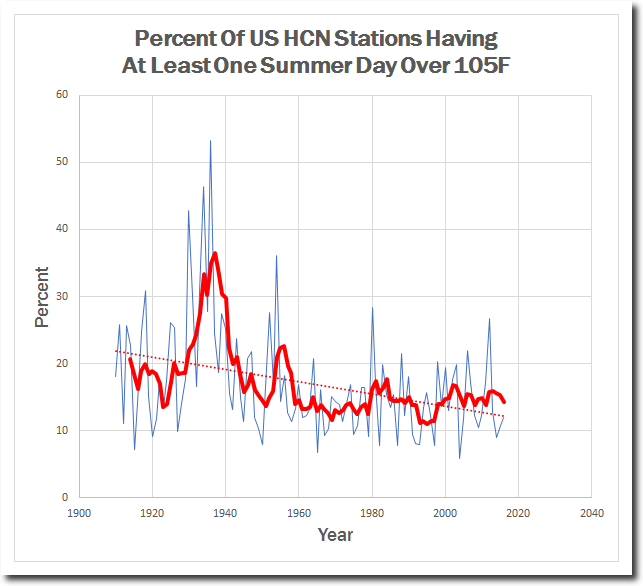
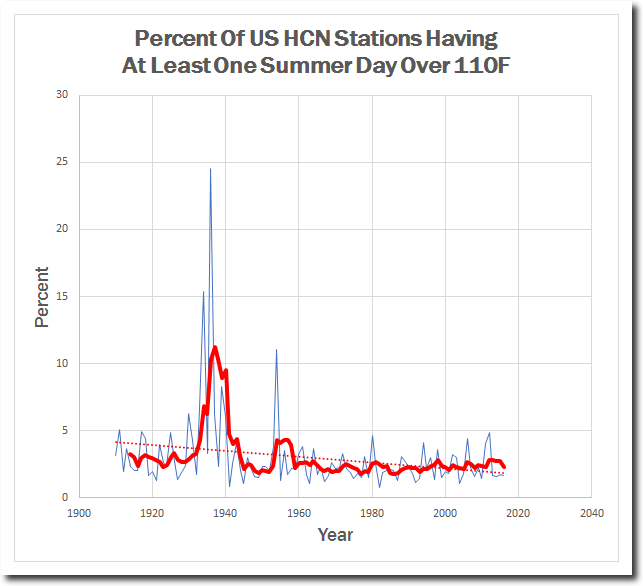
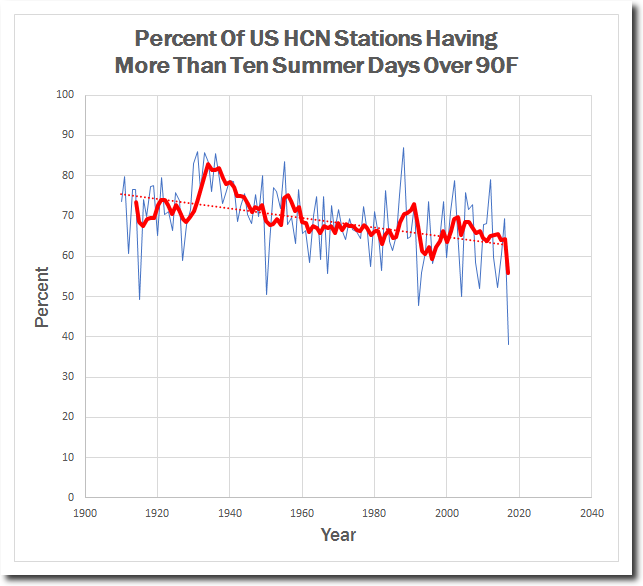
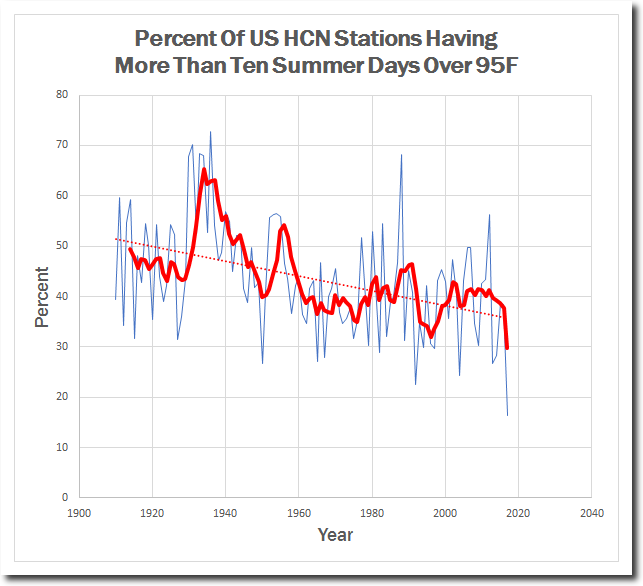
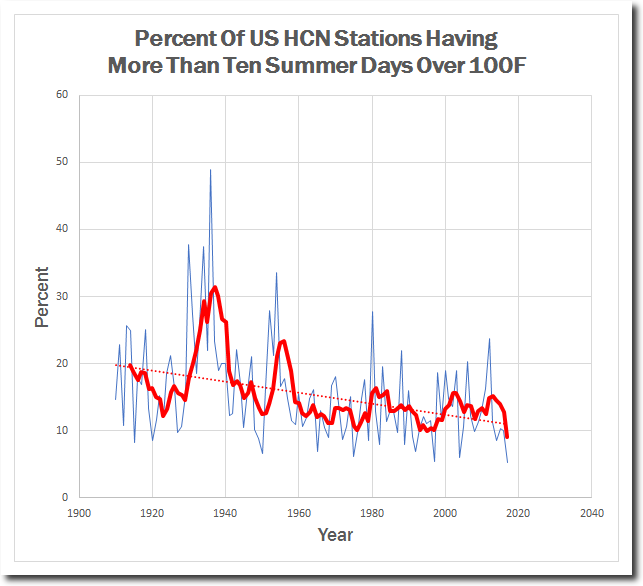
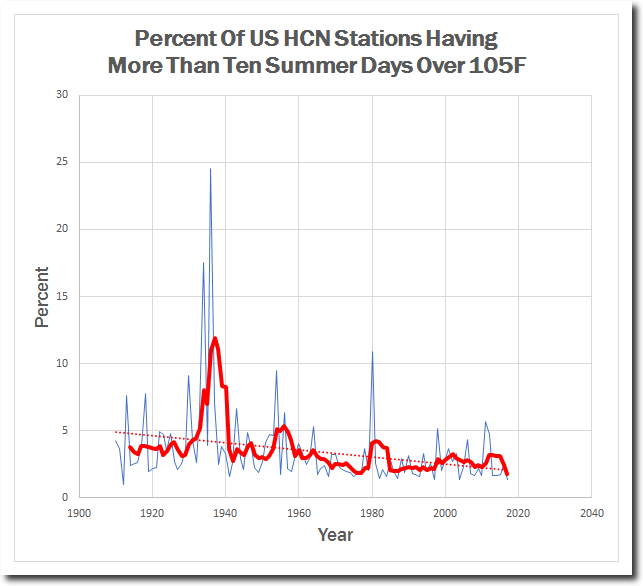
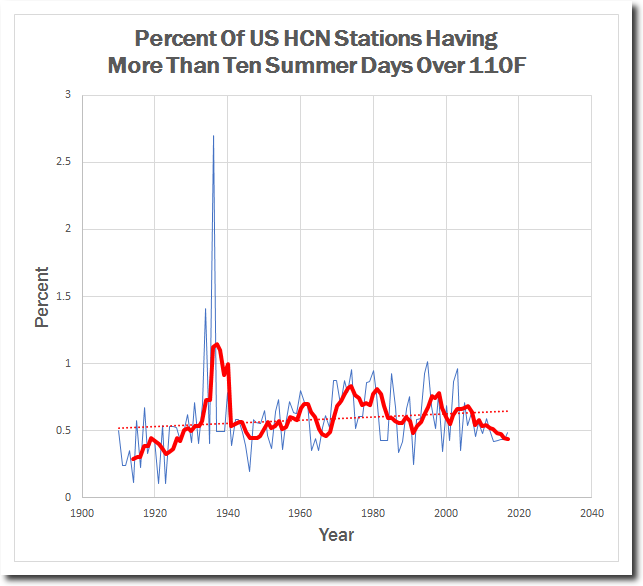
Heatwaves in the 1930’s were more intense, more widespread, and of longer duration. The NOAA Climate Extremes Index is completely fraudulent, and forms the basis of the George W. Bush Administration’s wildly fraudulent Climate Assessment.
The most likely explanation for this fake data is that they use tampered USHCN data which cools the past.
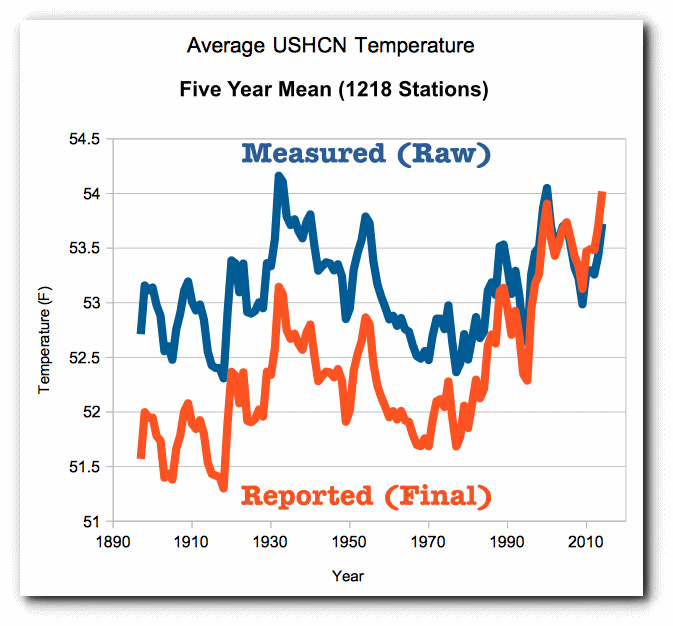
The smoking gun is that a number of the graphs I posted should not have been affected by any of the USHCN adjustments, like the one below.
This is just one more example of straight up climate fraud by the US government.
Posted in Uncategorized
Leave a comment
More Arctic Sea Ice Than 1971
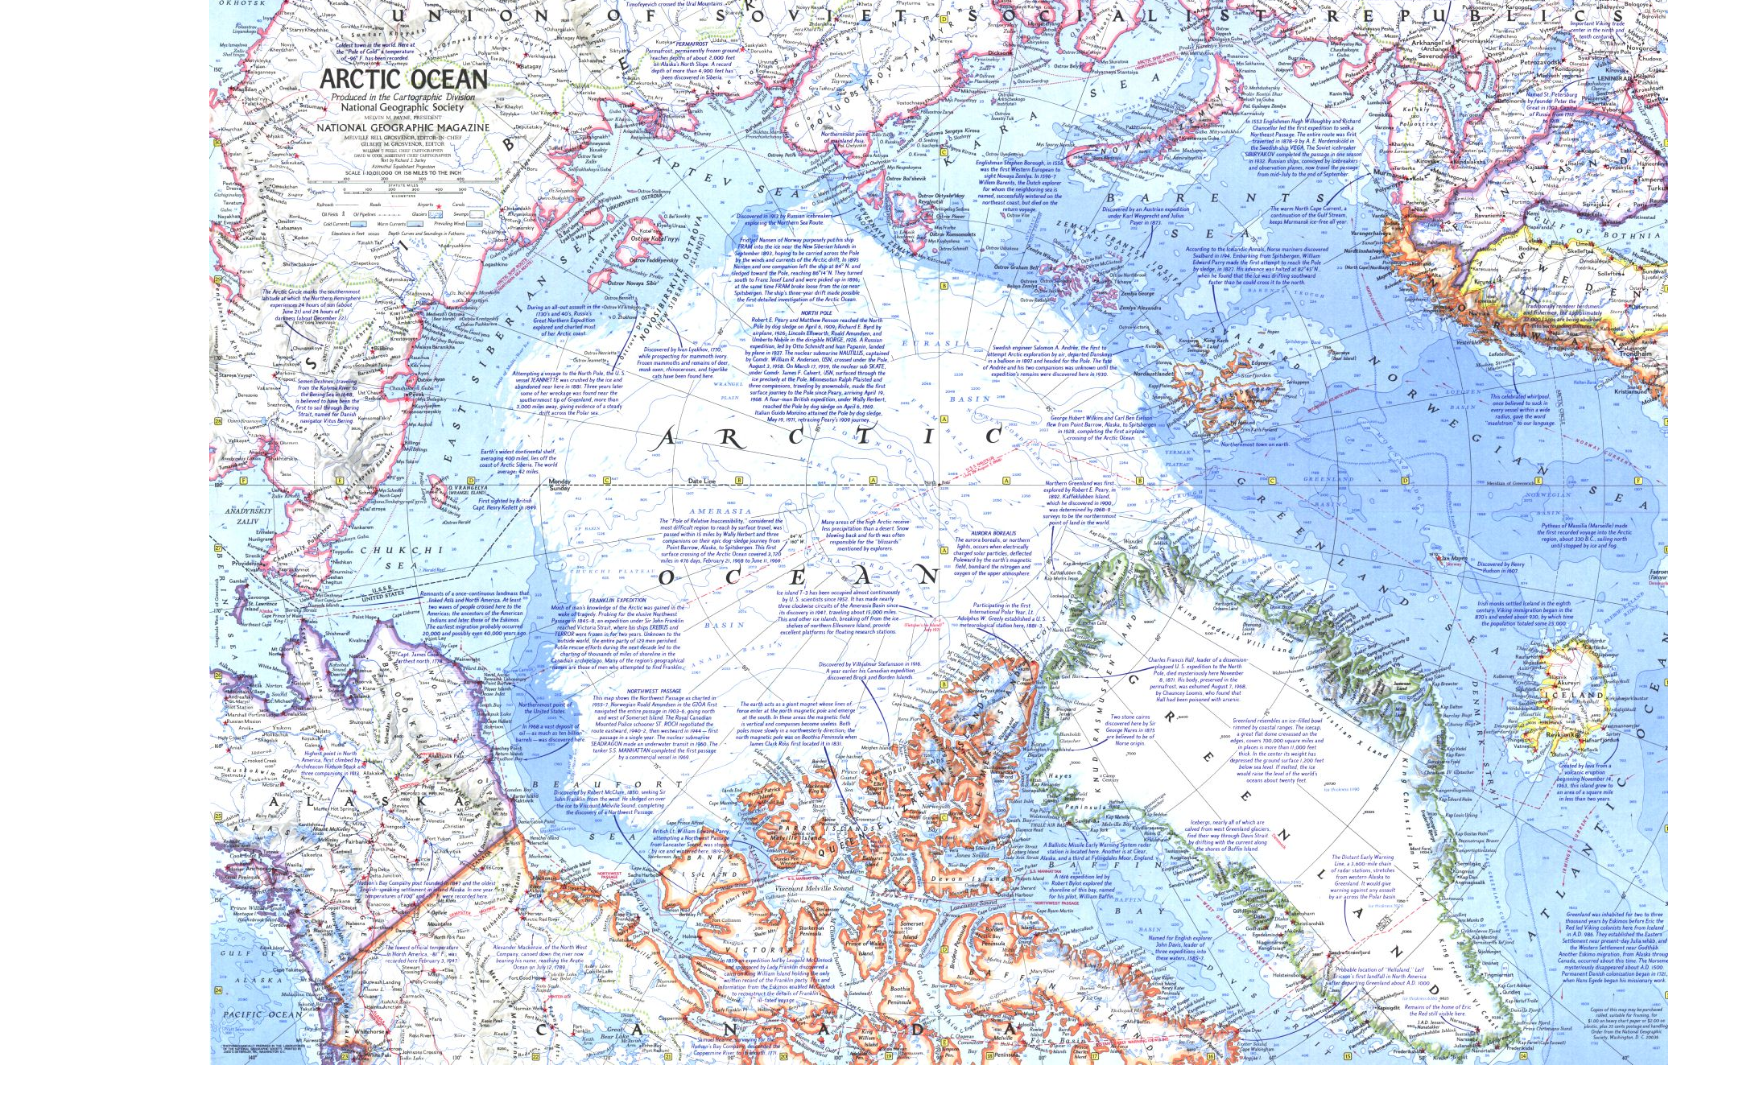
National Geographic published this map of Arctic sea ice extent in 1971
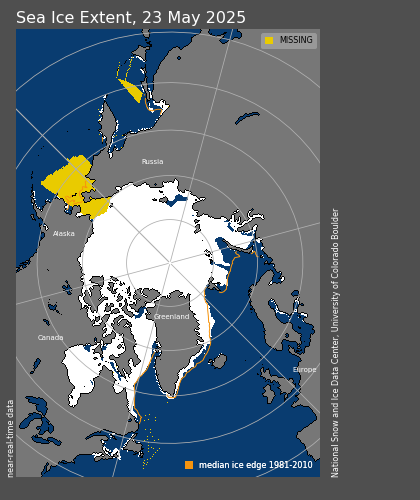
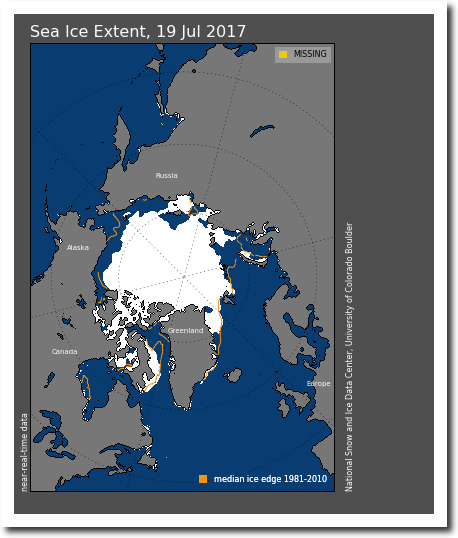
This map is current sea ice extent.
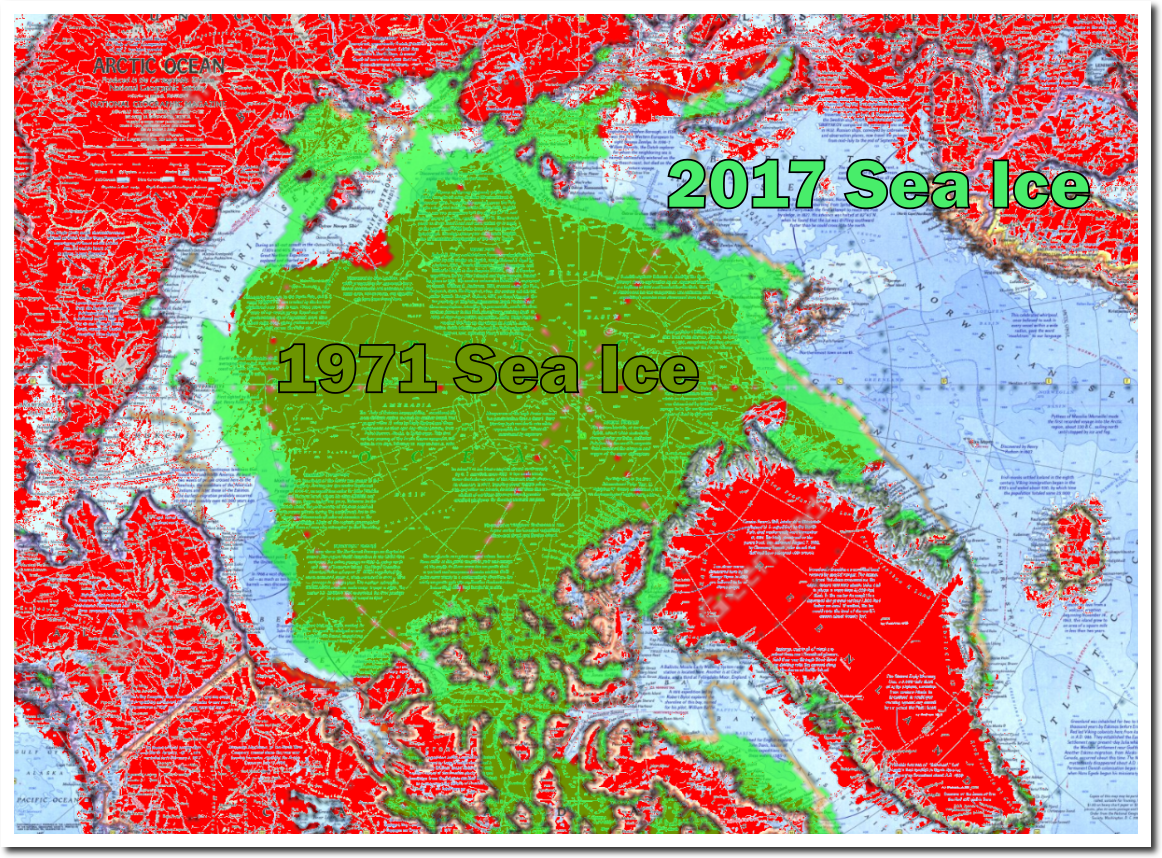
I overlaid the images at the same scale. The 1971 edge is shown in brown. The current edge is shown in green. As you can see, the current edge extends quite a bit further than the 1971 edge. The edge will shrink some over the remainder of the short melt season, but cold air in the Chukchi and Beaufort Seas will minimize melt for the next few weeks.
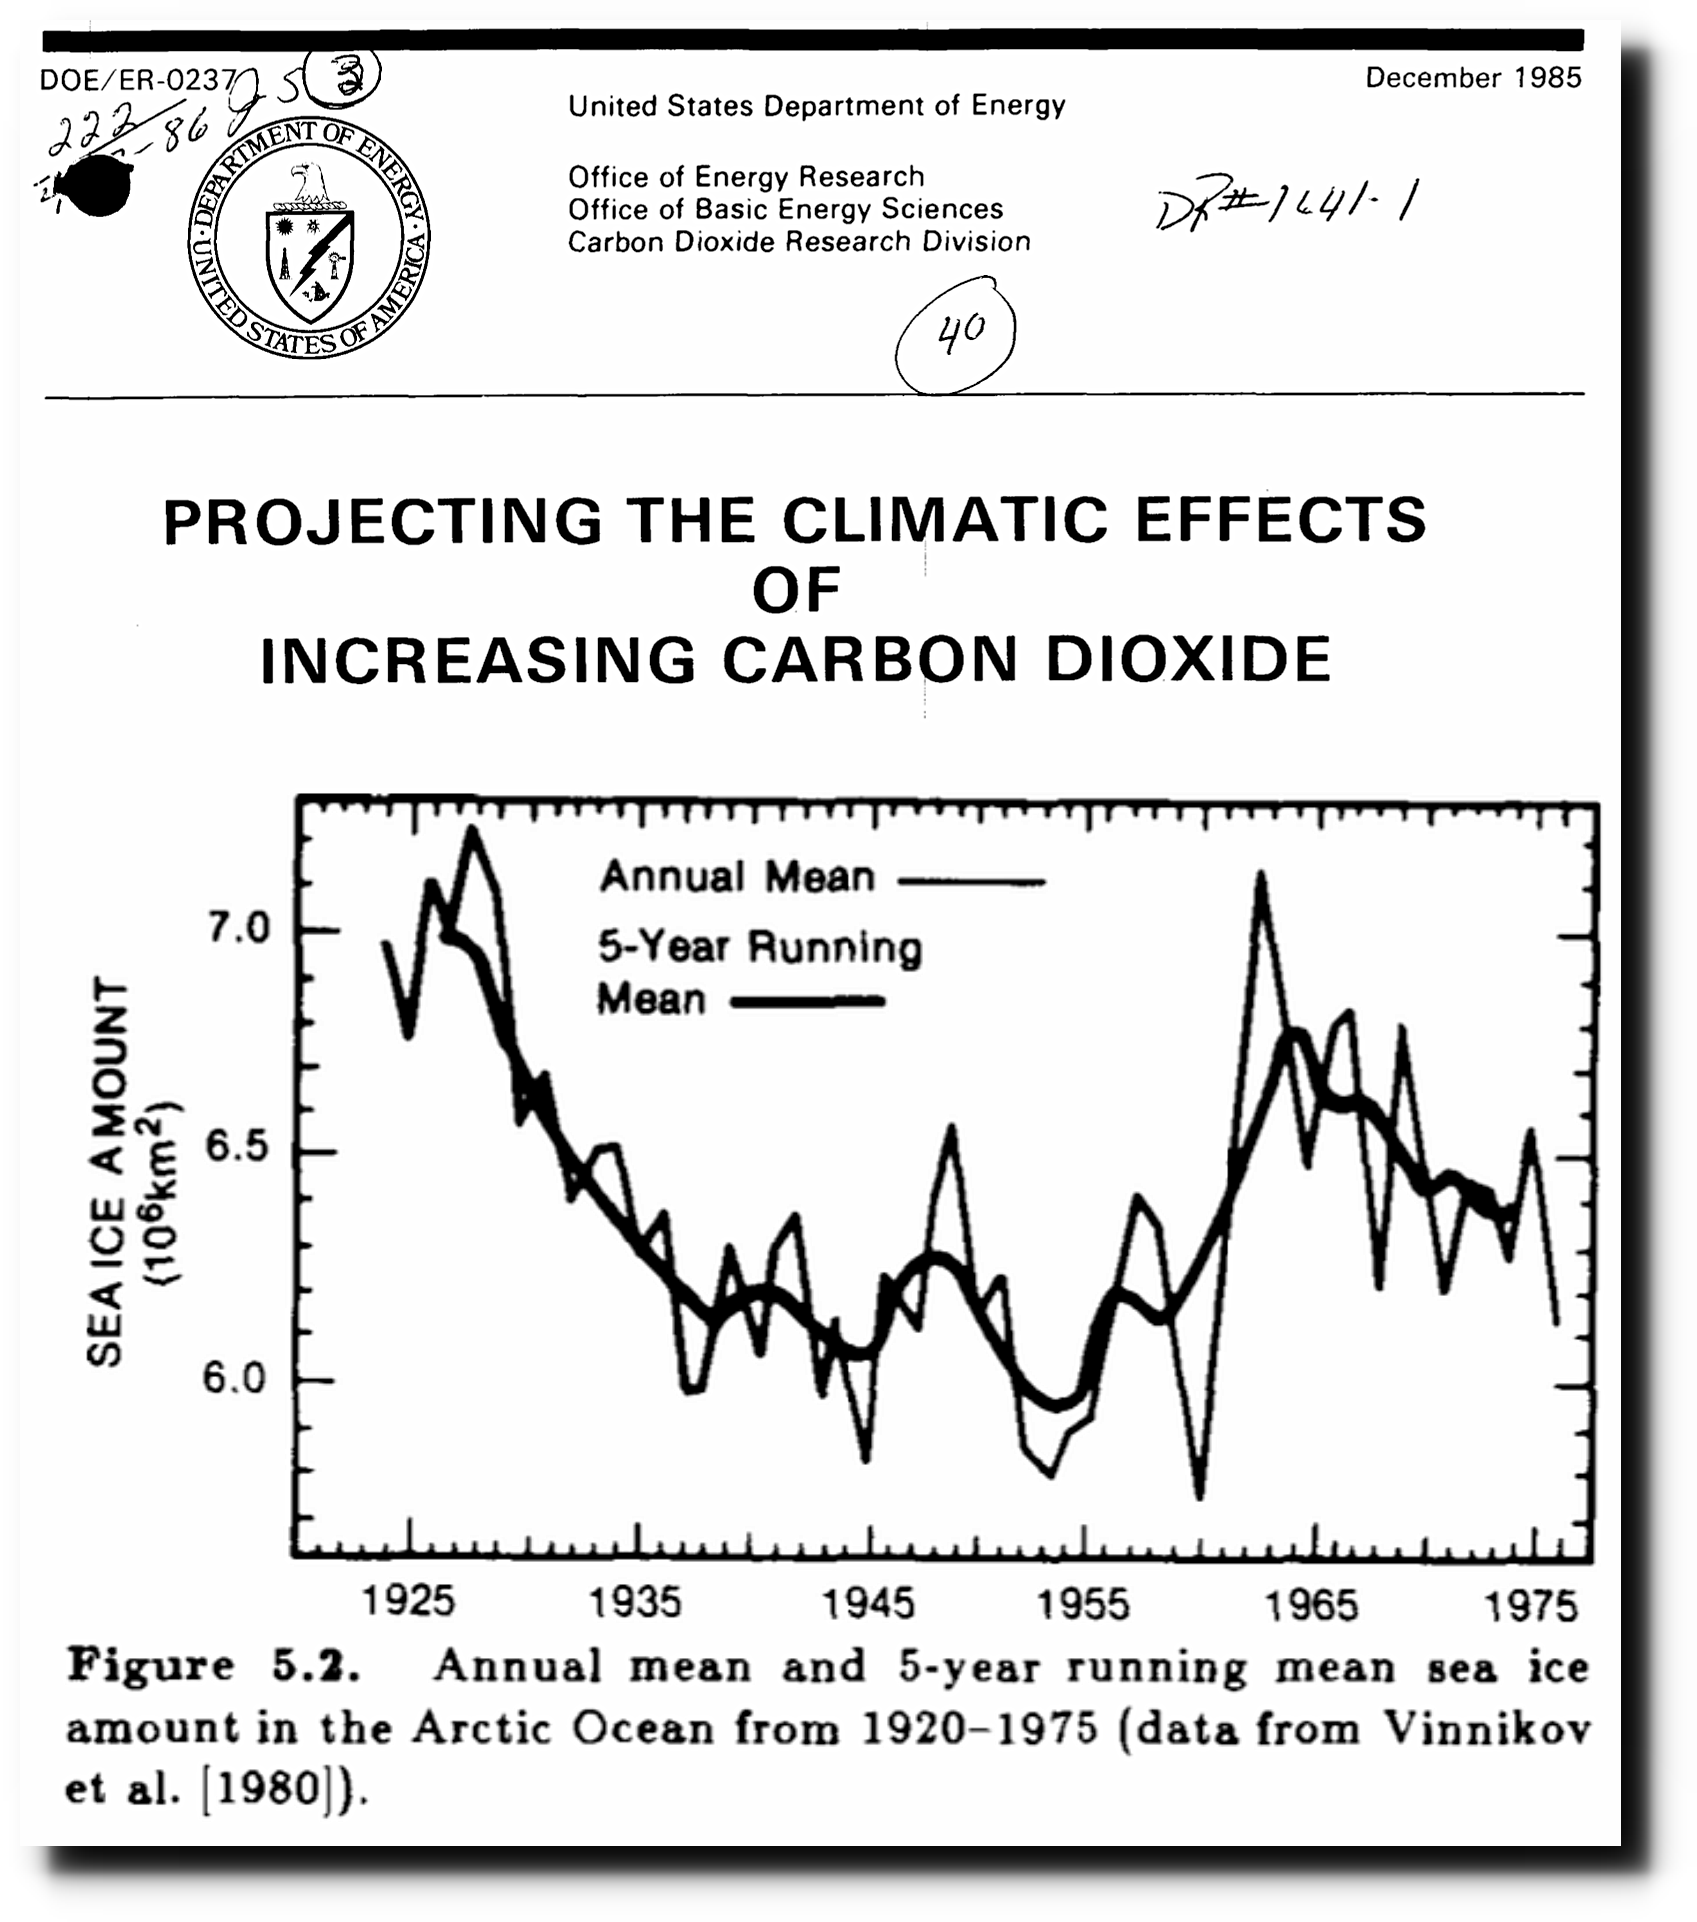
This map is consistent with data from the 1985 DOE report “Projecting the climatic effects of increasing carbon dioxide” – which showed low ice extent prior to the 1979 peak where fake climate scientists always start their graphs.
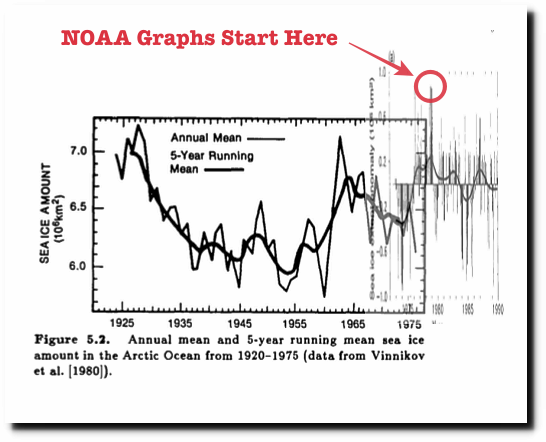
Arctic Sea Ice Fraud | The Deplorable Climate Science Blog
Newspaper accounts from the 1950’s confirmed that sea ice extent and thickness was low.
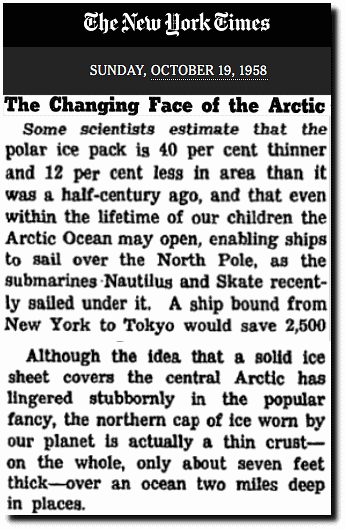
The Changing Face of the Arctic; The Changing Face of the Arctic
The mainstream press won’t report this, because they aren’t interested in facts or science.
Posted in Uncategorized
Leave a comment