









Disrupting the Borg is expensive and time consuming!
Google Search
-
Recent Posts
- One Atomic Bomb Per Hour
- New Video : Analyzing Oil And Gas
- Is Antarctica Melting?
- High Speed Analysis And Visualization
- El Nino To The Rescue?
- Fake News Update
- Growth Of Antarctic Sea Ice
- 65 Years Of Progress!
- El Nino To The Rescue?
- Worst March Drought On Record
- ChartGL Process Control Demo
- The Biggest Money Laundering Scam
- Drought In The Headwaters Of Lake Powell
- Unrealistic Expectations Of Water Availability
- Did Bill Gates Do This?
- Worst March Drought On Record In The US
- The Real Hockey Stick Graph
- Analyzing The Western Water Crisis
- Gaslighting 1924
- “Why Do You Resist?”
- Climate Attribution Model
- Fact Checking NASA
- Fact Checking Grok
- Fact Checking The New York Times
- New Visitech Features
Recent Comments
- conrad ziefle on One Atomic Bomb Per Hour
- Timo, Not that one on One Atomic Bomb Per Hour
- Bob G on One Atomic Bomb Per Hour
- Crispin Pemberton-Pigott on One Atomic Bomb Per Hour
- william on 65 Years Of Progress!
- arn on One Atomic Bomb Per Hour
- Gordon Vigurs on One Atomic Bomb Per Hour
NASA Climate – Destroyers Of Science And History
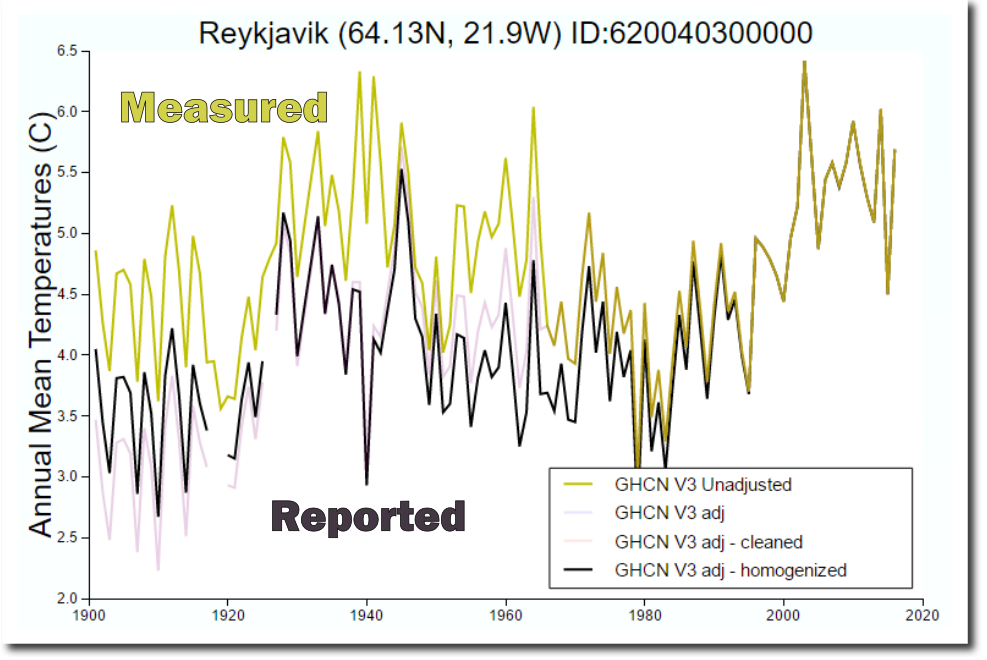
Measured temperatures in Iceland show a cyclical pattern, with the late 1930’s warmer than the present. The measured data doesn’t fit NASA’s theory about CO2 driving climate, so they cool past temperatures to create the appearance of a warming trend.
Data.GISS: GISS Surface Temperature Analysis
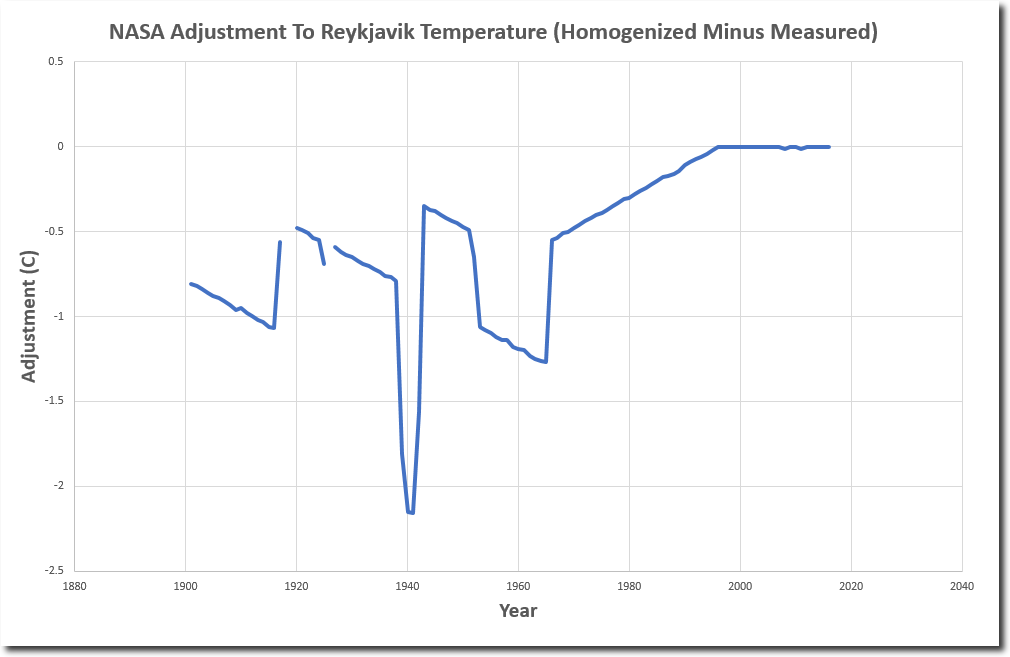
Temperatures around 1940 are cooled more than two degrees centigrade.
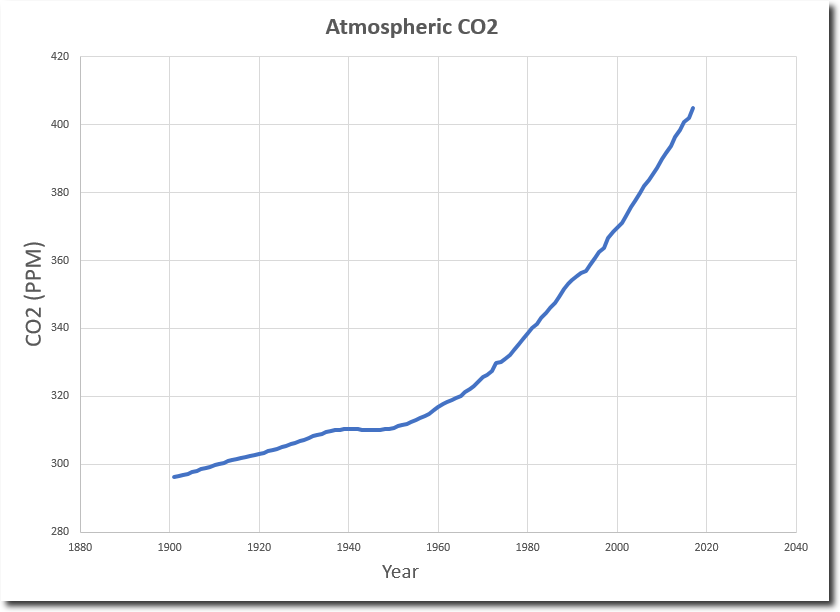
NASA wants temperatures to track atmospheric CO2, which has been rising exponentially since abut 1940.
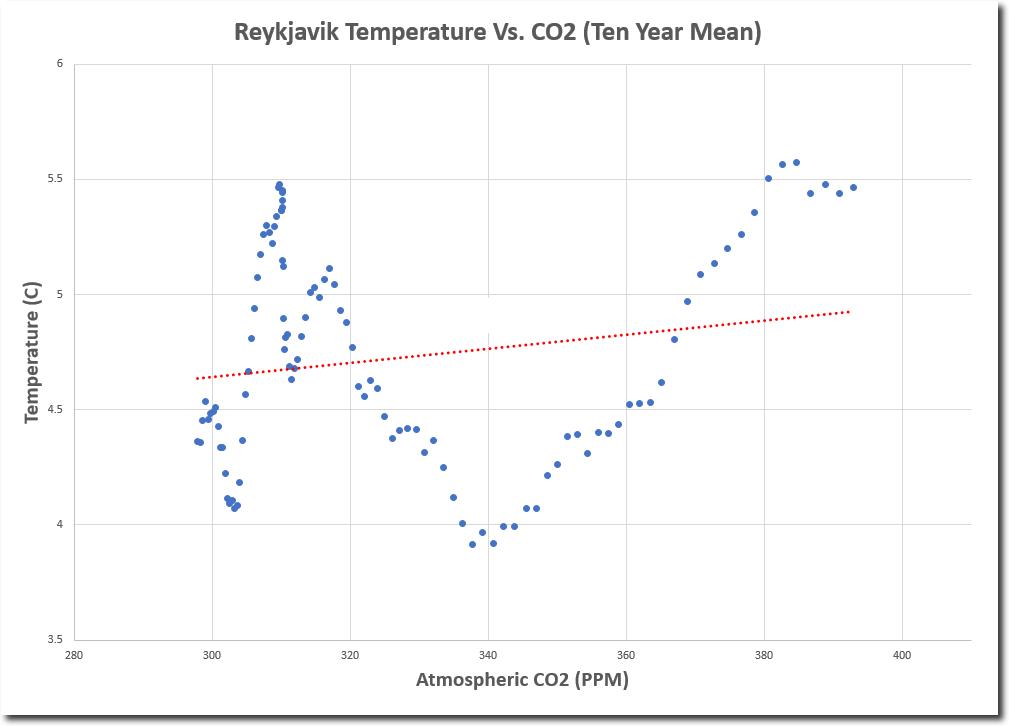
Iceland temperatures show essentially no correlation with CO2, so NASA changes the measured temperatures to bring them closer in line with theory.
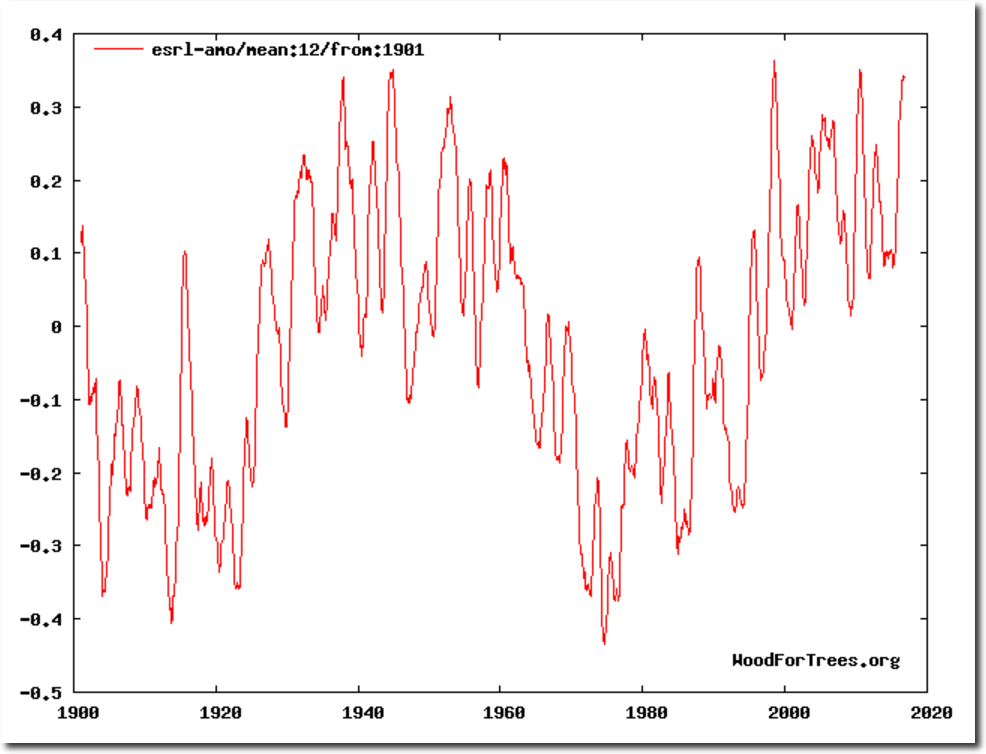
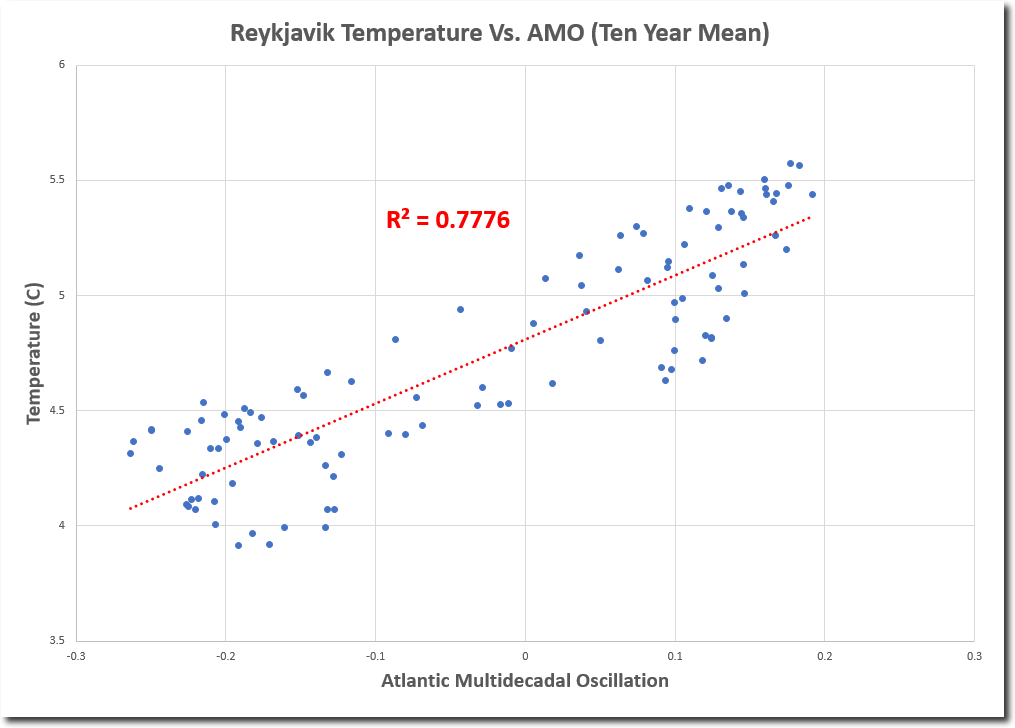
If the climate people at NASA were actual scientists, they would look for a real explanation of the cyclical behavior of temperatures in Iceland – rather than tampering with data to match their theory. The Atlantic Multidecadal Oscillation (AMO) is an ocean circulation pattern which closely matches the cyclical behavior seen in Iceland temperatures.
Wood for Trees: Interactive Graphs
The correlation between Iceland temperatures and CO2 is essentially non-existent, but correlation with the AMO is excellent.
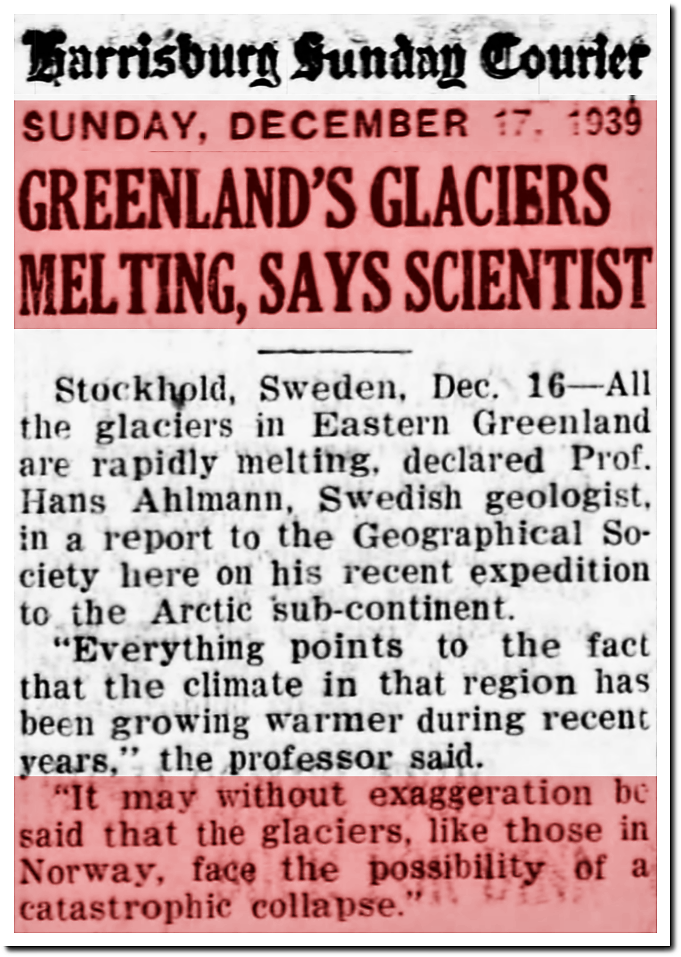
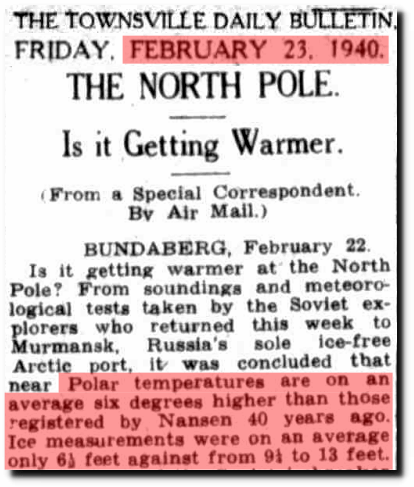
We have other physical evidence that the time around 1940 was as warm or warmer than now in the Arctic. NASA data tampering has no justification.
17 Dec 1939, Page 15 – Harrisburg Sunday Courier
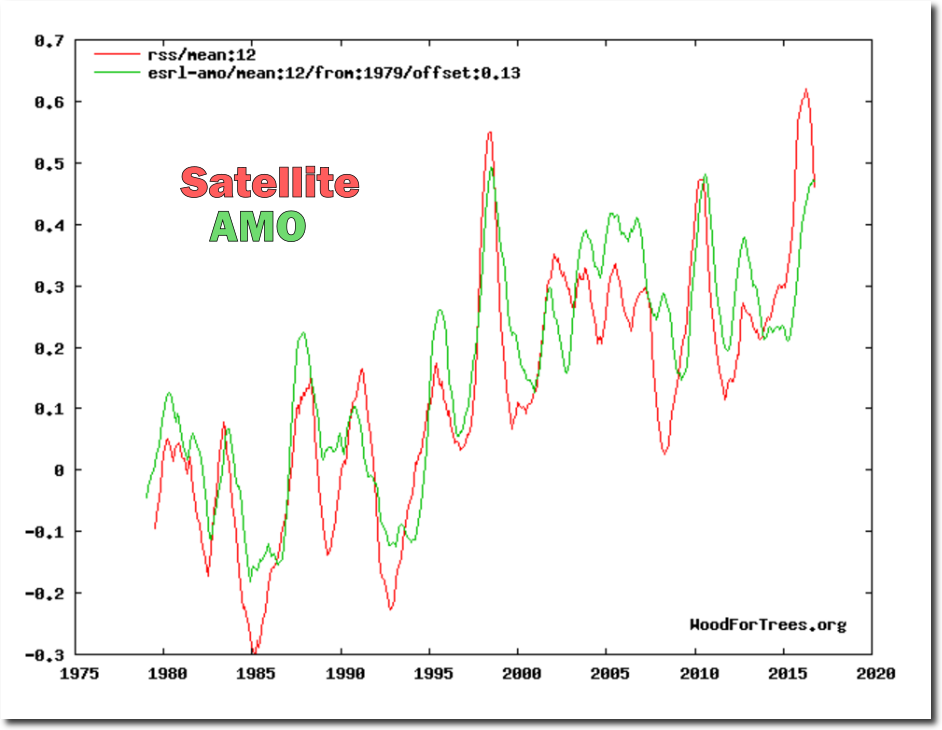
It should be obvious to any serious scientist that NASA doesn’t understand climate, and that they are committing massive, unprecedented fraud by tampering with the data. But this story is much larger than the Arctic. Atmospheric temperatures for the entire planet closely match the AMO.
Which means that Earth is likely to start cooling again soon.
Wood for Trees: Interactive Graphs
This is why Gavin Schmidt at NASA is ramping up his data tampering every month. More and more fraud is required to hide the decline.
Posted in Uncategorized
Leave a comment
More Spectacular Fraud At Climate Central
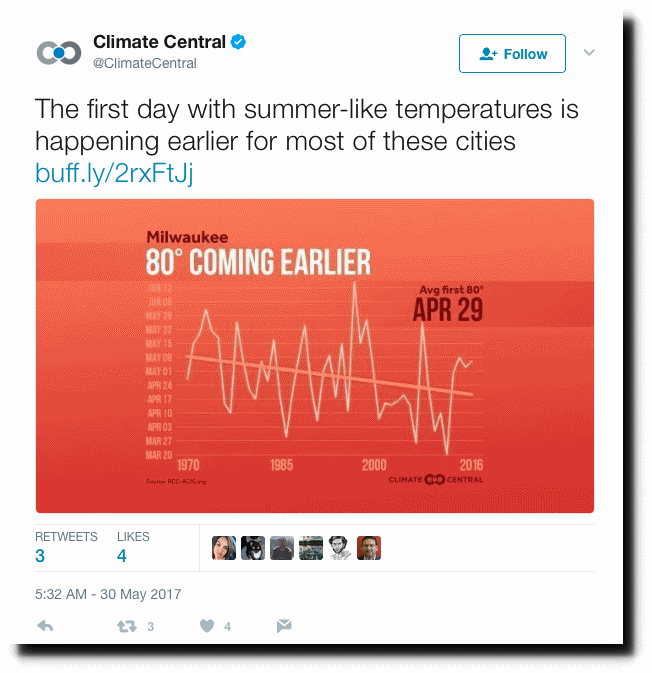
Nobody tells more blatant lies about climate than Heidi Cullen’s Climate Central. Here is a whopper. They claim that 80 degree days are coming earlier at Milwaukee, and start their graph during the cold 1970’s – as if there isn’t any data from before 1970.
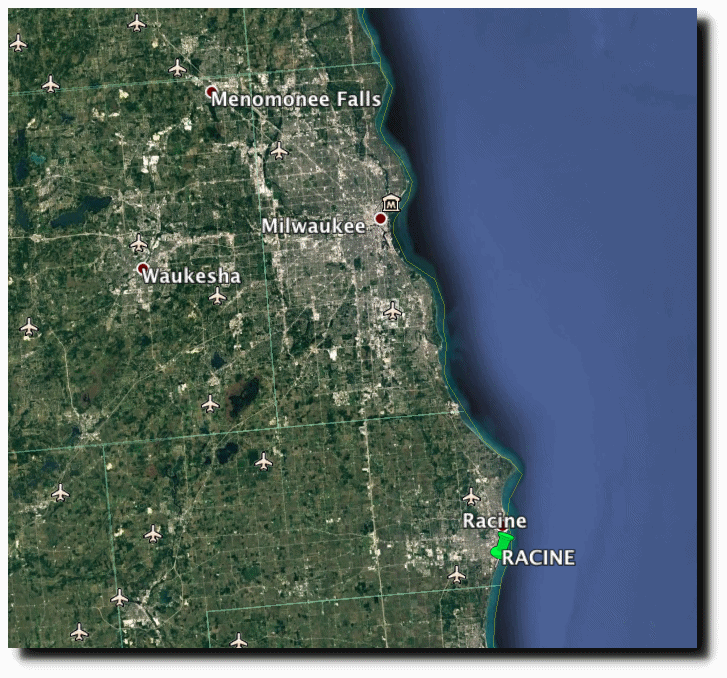
Let’s check their claim out. The closest USHCN station to Milwaukee is at Racine.
The trend is the exact opposite of what Climate Central claims. The first 80 degree day is coming much later than it used to. It was 80 degrees in Racine on March 27, 1910 and March 27, 1945. The latest first 80 degree day was in 2013, when Racine didn’t reach 80F until June 24.
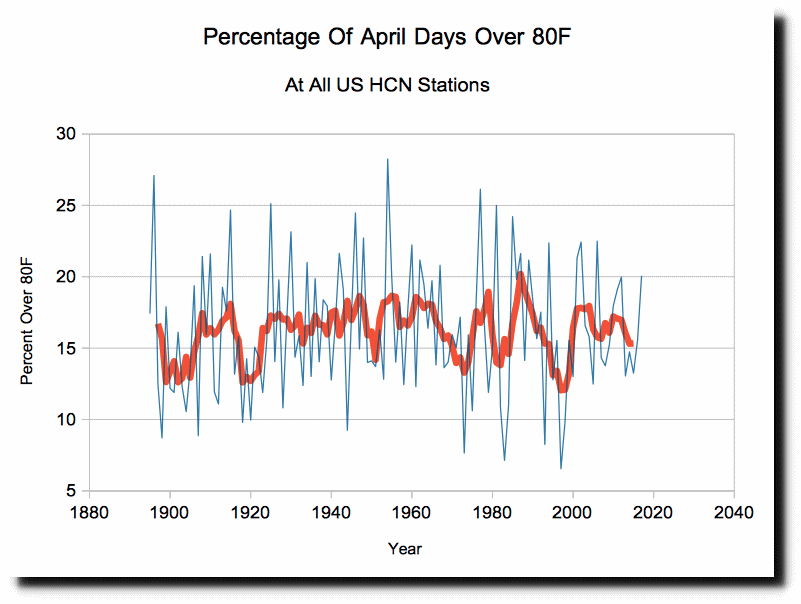
For the entire US, there is no trend in the frequency of April 80 degree days, which peaked in 1954 and 1910.
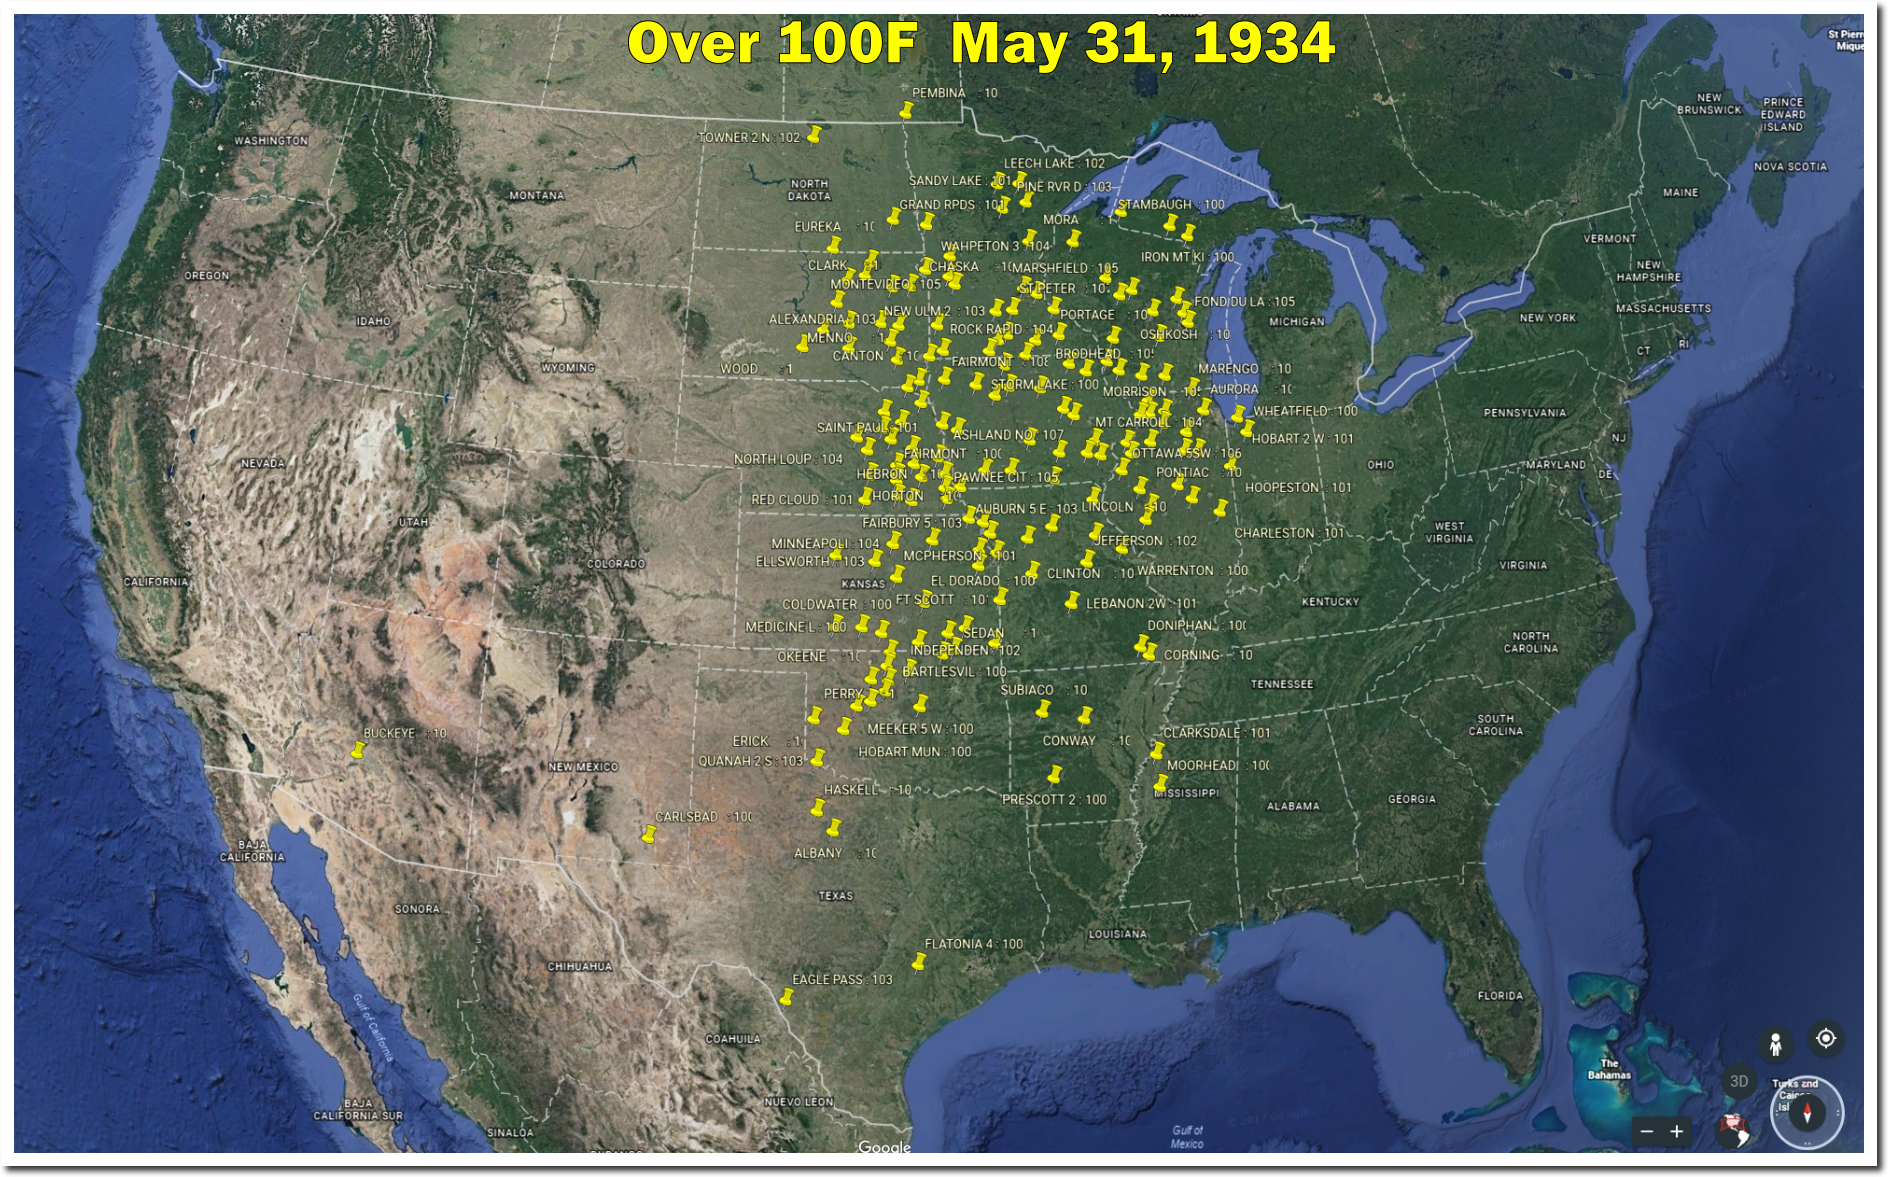
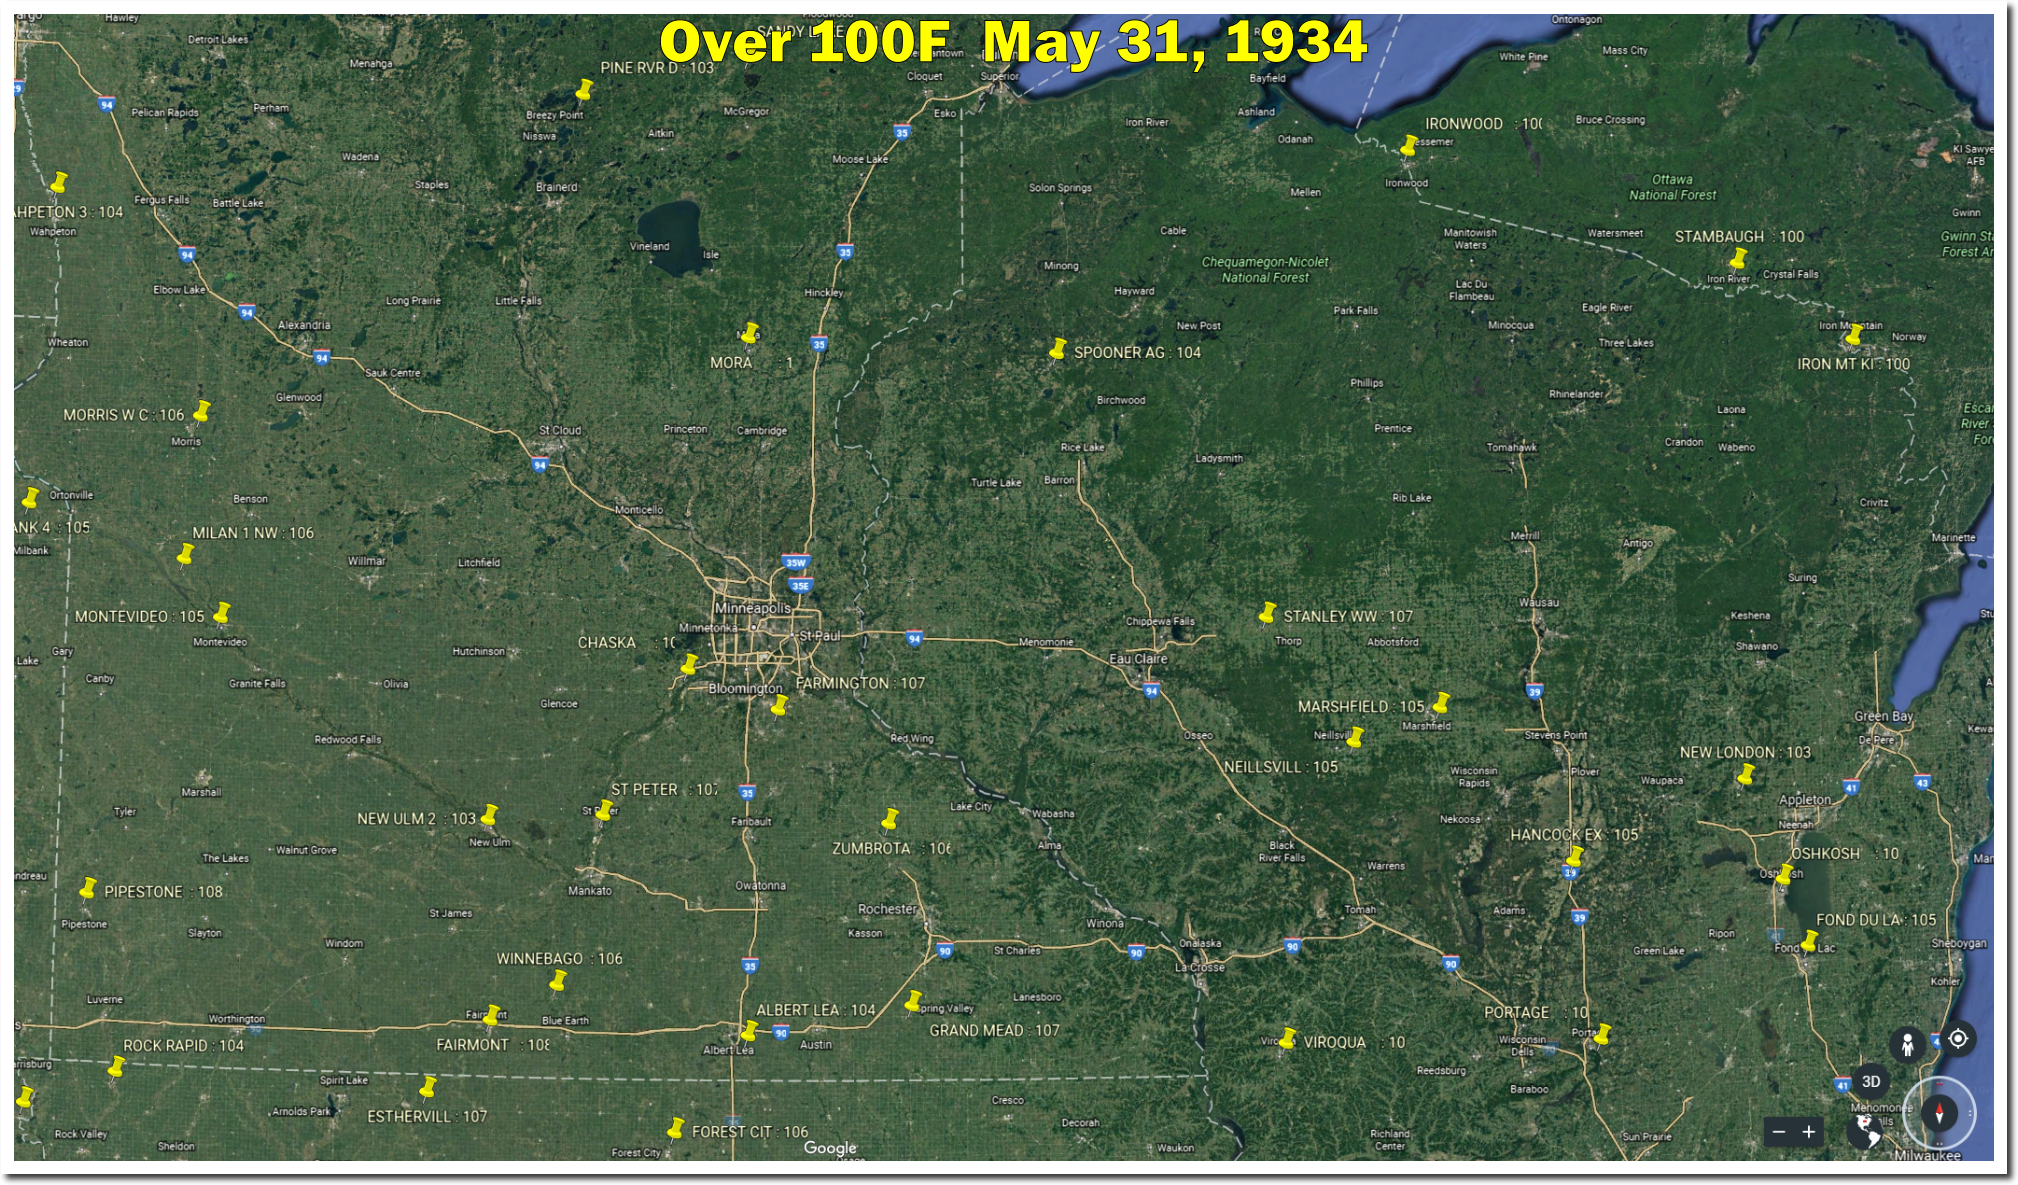
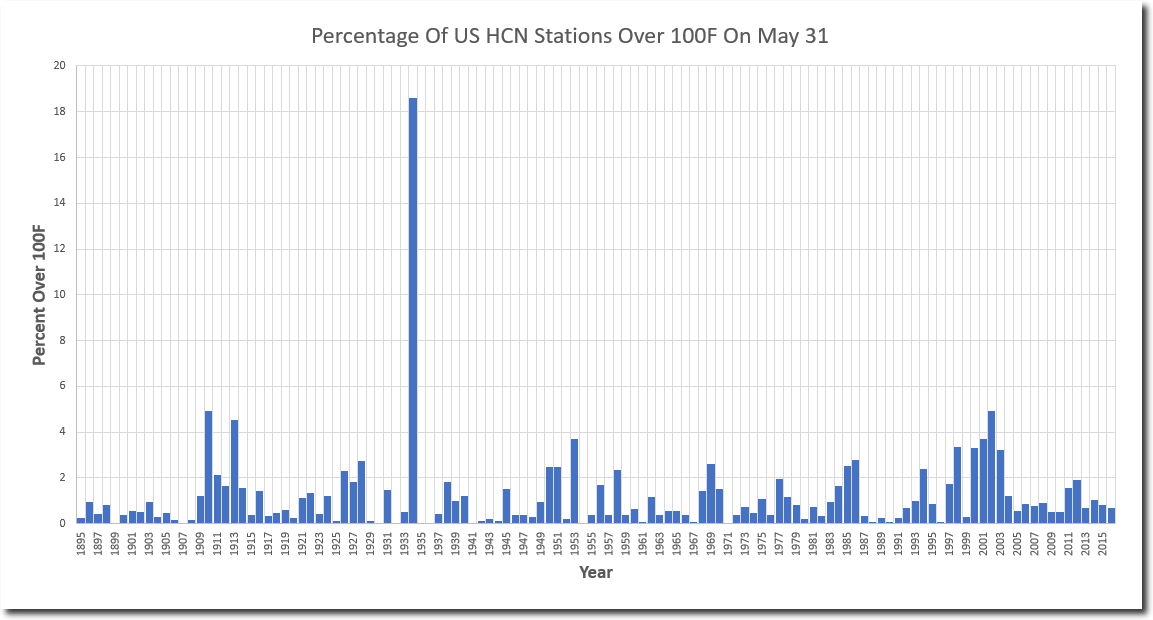
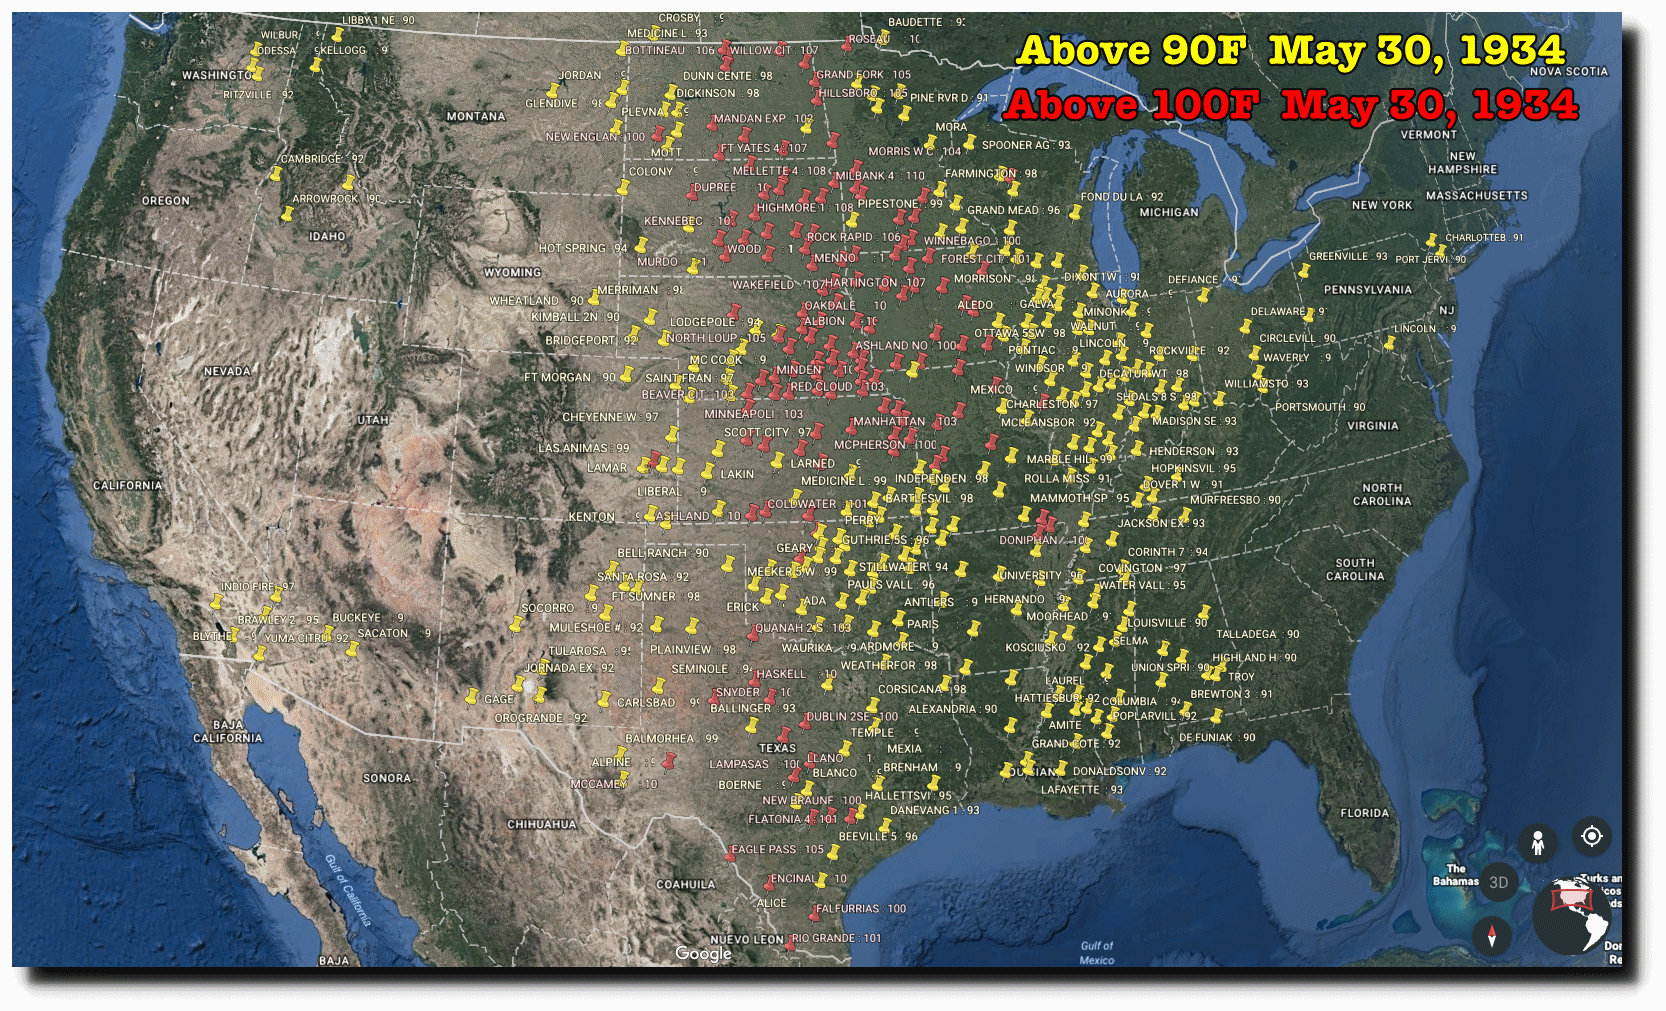
Climate Central couldn’t have picked a worse day to publish this fraud. On this date in 1934, half of the US was over 90F, and much of the Midwest was over 100F. Medford, Wisconsin was 101F on May 30, 1934. Their forecast high today is 53F – almost 50 degrees cooler. Langdon, North Dakota was 111 degrees on this date in 1934.
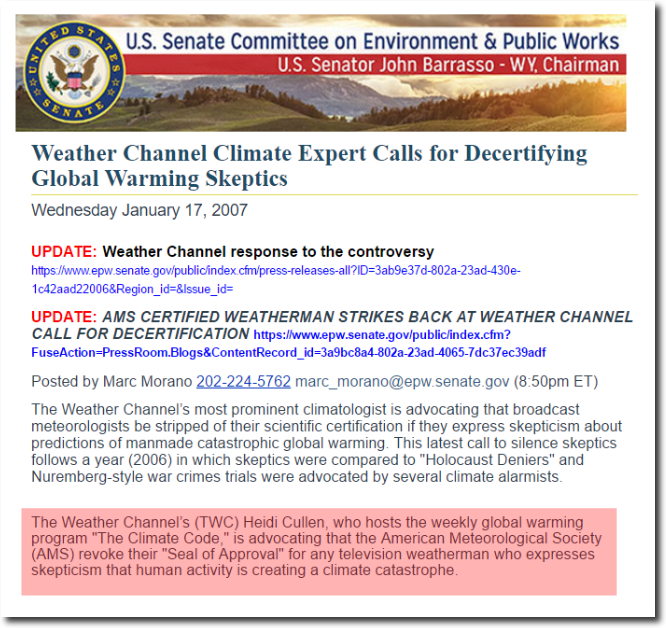
This sort of spectacular and blatant fraud by Heidi Cullen is typical, who ten years ago wanted to decertify any meteorologist who didn’t go along with her fraud.
Weather Channel Climate Expert Calls for Decertifying Global Warming Skeptics
Posted in Uncategorized
Leave a comment
November 9, 2016 – Celebrating In Canberra!
President Trump’s supporters in Australia are counting on him dumping the fake Paris “climate” treaty.
Posted in Uncategorized
Leave a comment
Think Of The Little Ones
Carbon pollution from the Valmont power plant is a major contributor to the permanent drought in Colorado.
If you look into the eyes of these animals grazing next to Kevin Trenberth’s National Center for Atmospheric Research, you can see their deep concerns about global warming, and the permanent drought.
Posted in Uncategorized
Leave a comment
New Video : “Arctic Fake News”
You can see all of my videos on my YouTube channel https://www.youtube.com/c/TonyHeller
Posted in Uncategorized
Leave a comment


