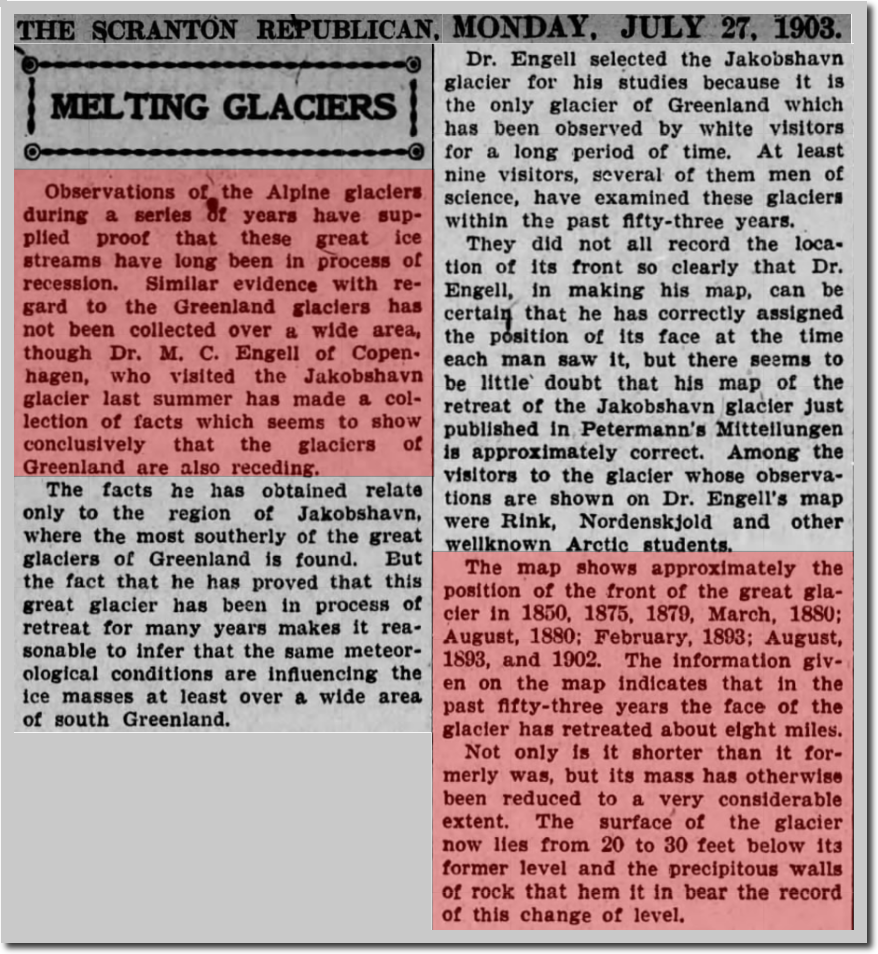
A massive, unprecedented heatwave and drought was in progress on June 1, 1934. Government climate experts don’t talk about this sort of thing, because it wrecks their extreme weather scam.
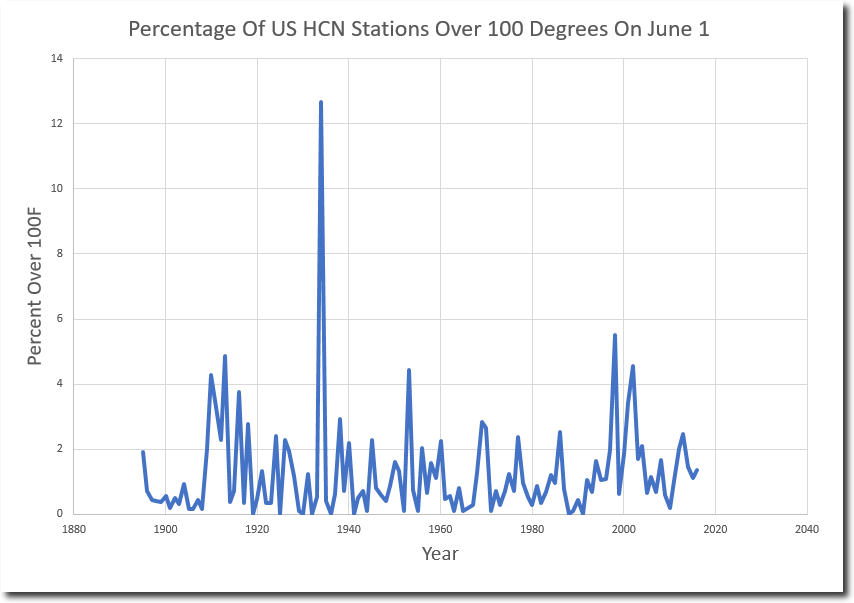
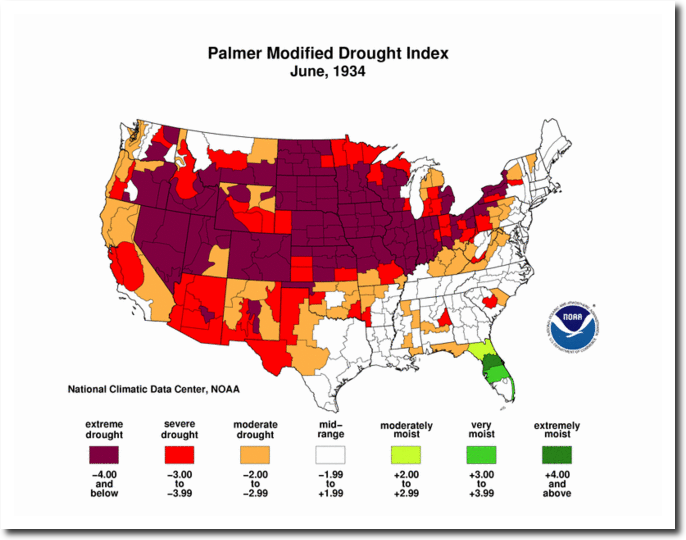
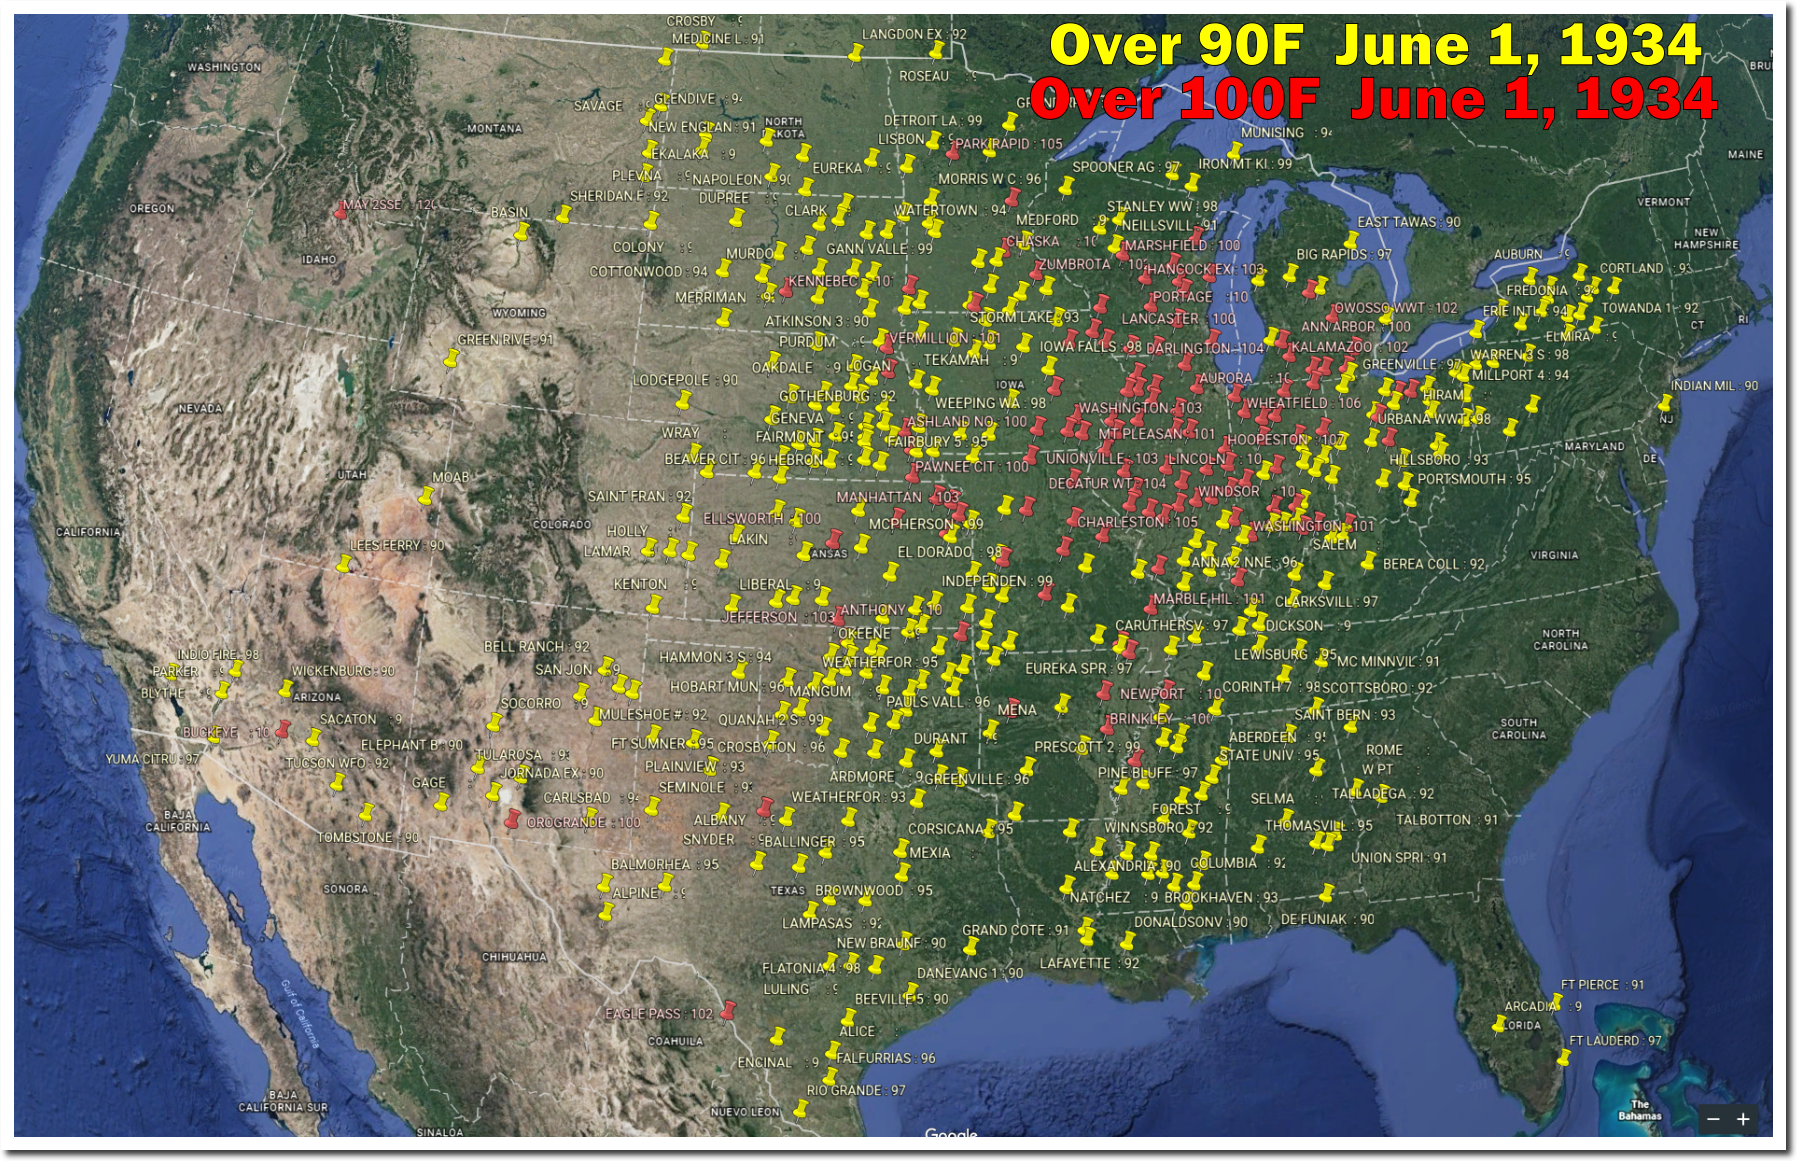
A massive, unprecedented heatwave and drought was in progress on June 1, 1934. Government climate experts don’t talk about this sort of thing, because it wrecks their extreme weather scam.
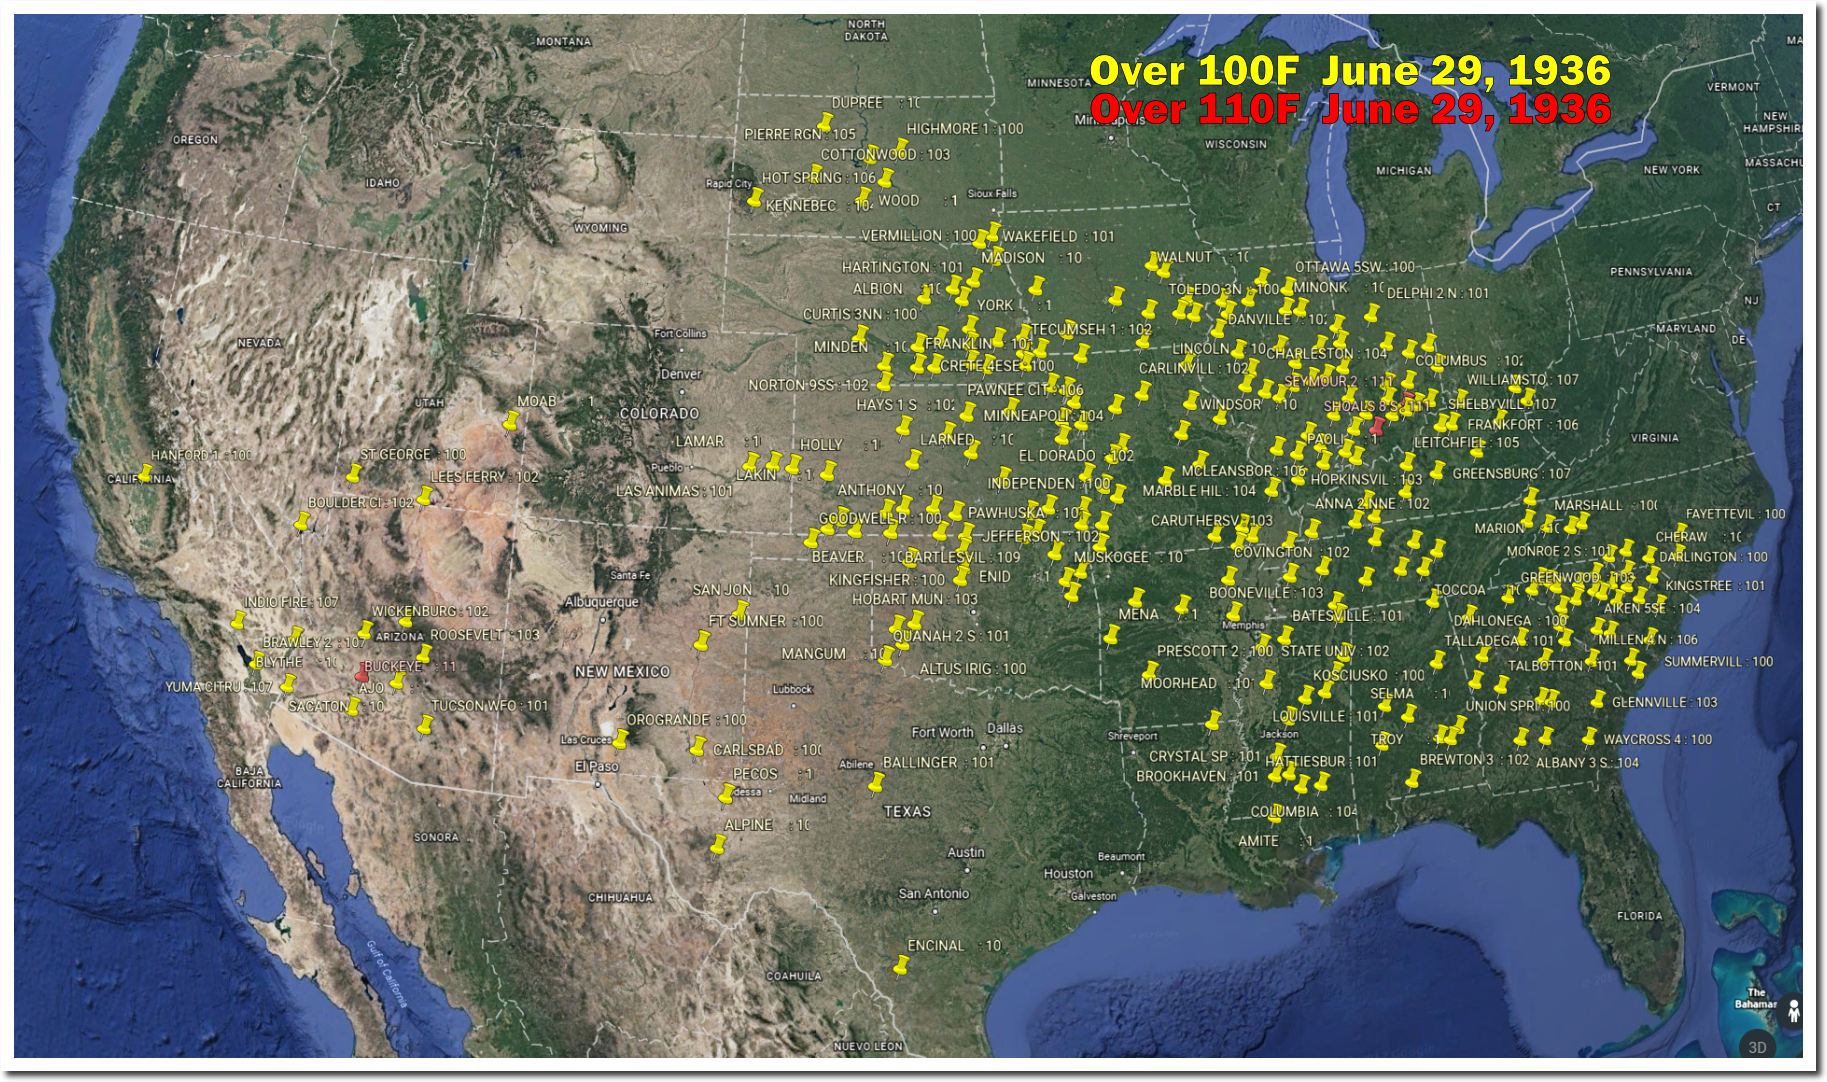
On June 29, 1936 one third of the US was over 100 degrees, with Seymour and Shoals, Indiana being the hottest places in the US at 111 degrees. Weather that hot is incomprehensible now, and has been for 60 years.
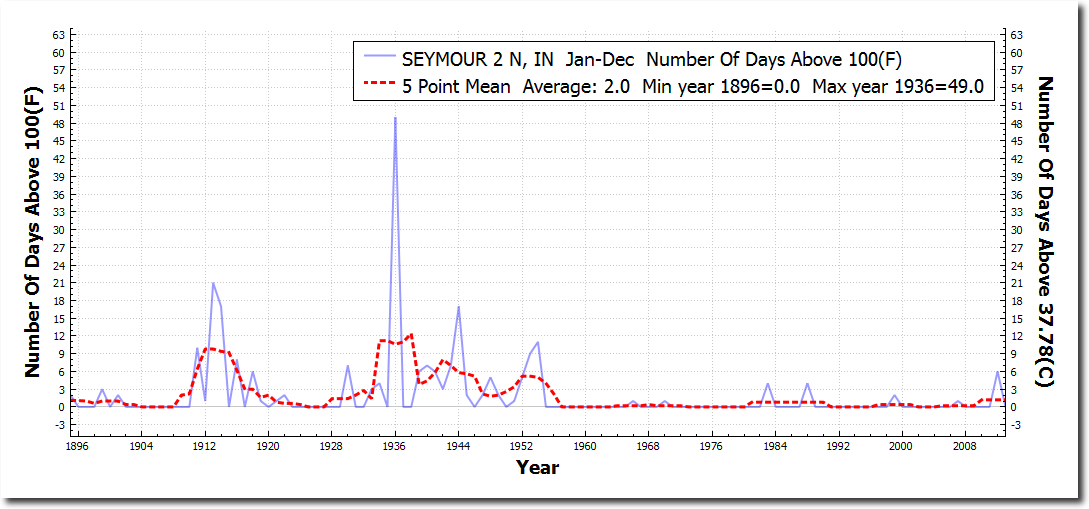
People who claim the Midwest is getting hotter are criminals, not scientists. There is zero evidence to back that up.
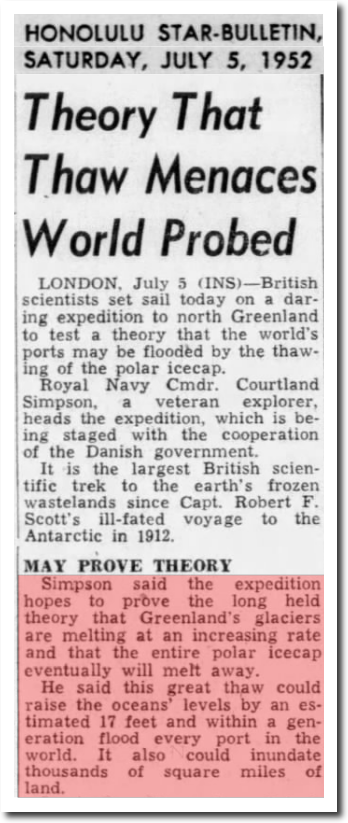
Scientists recycle the same climate scams generation after generation, century after century.
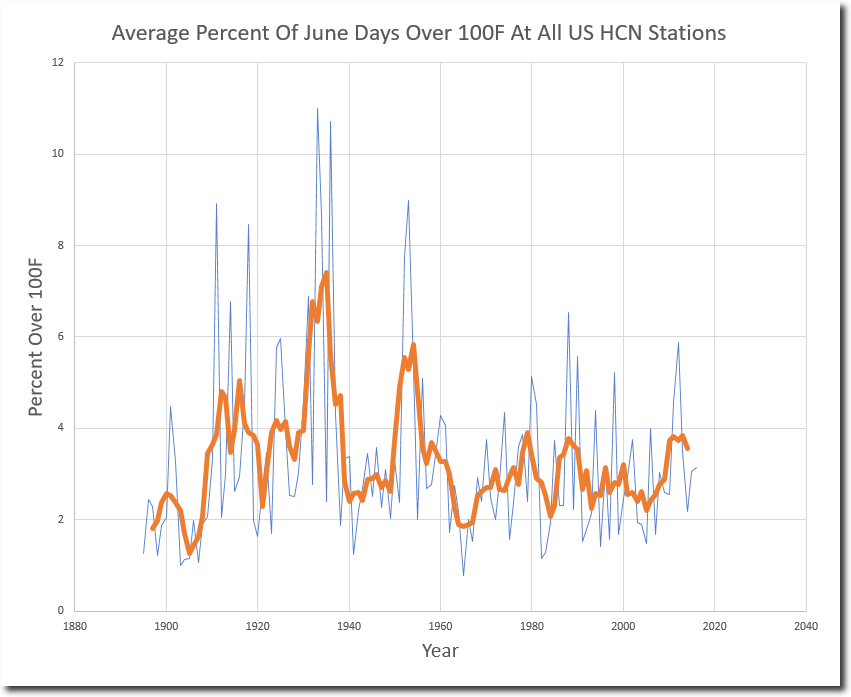
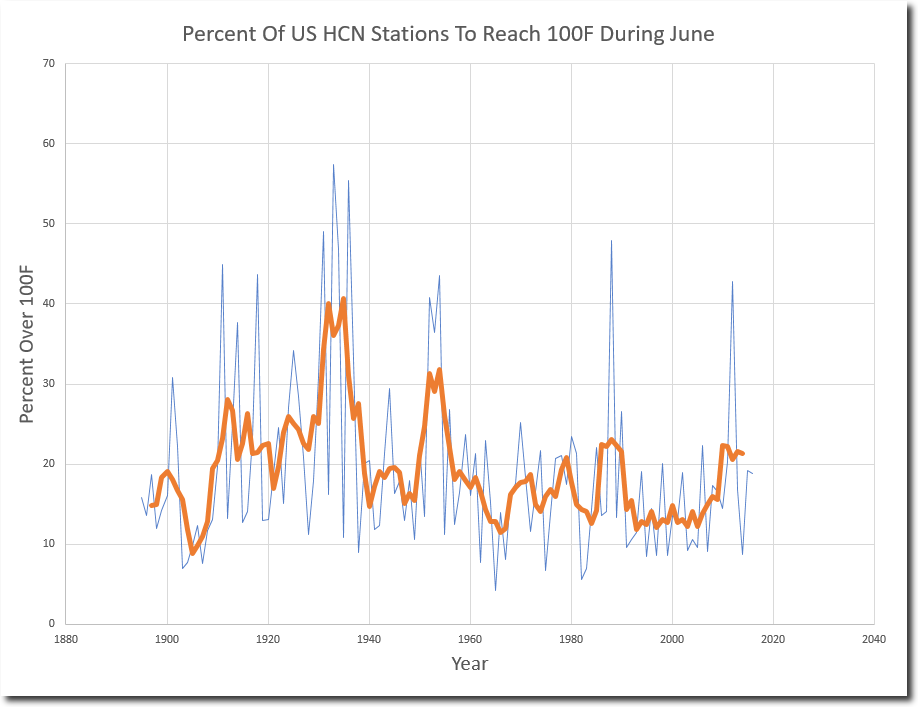
The area and duration of heatwaves in the US during June used to be much higher prior to 60 years ago. One hundred degree days during June were more than twice as common during the 1930’s as they are now, with 1933, 1936, 1934, 1954, 1911 and 1916 being the hottest years.
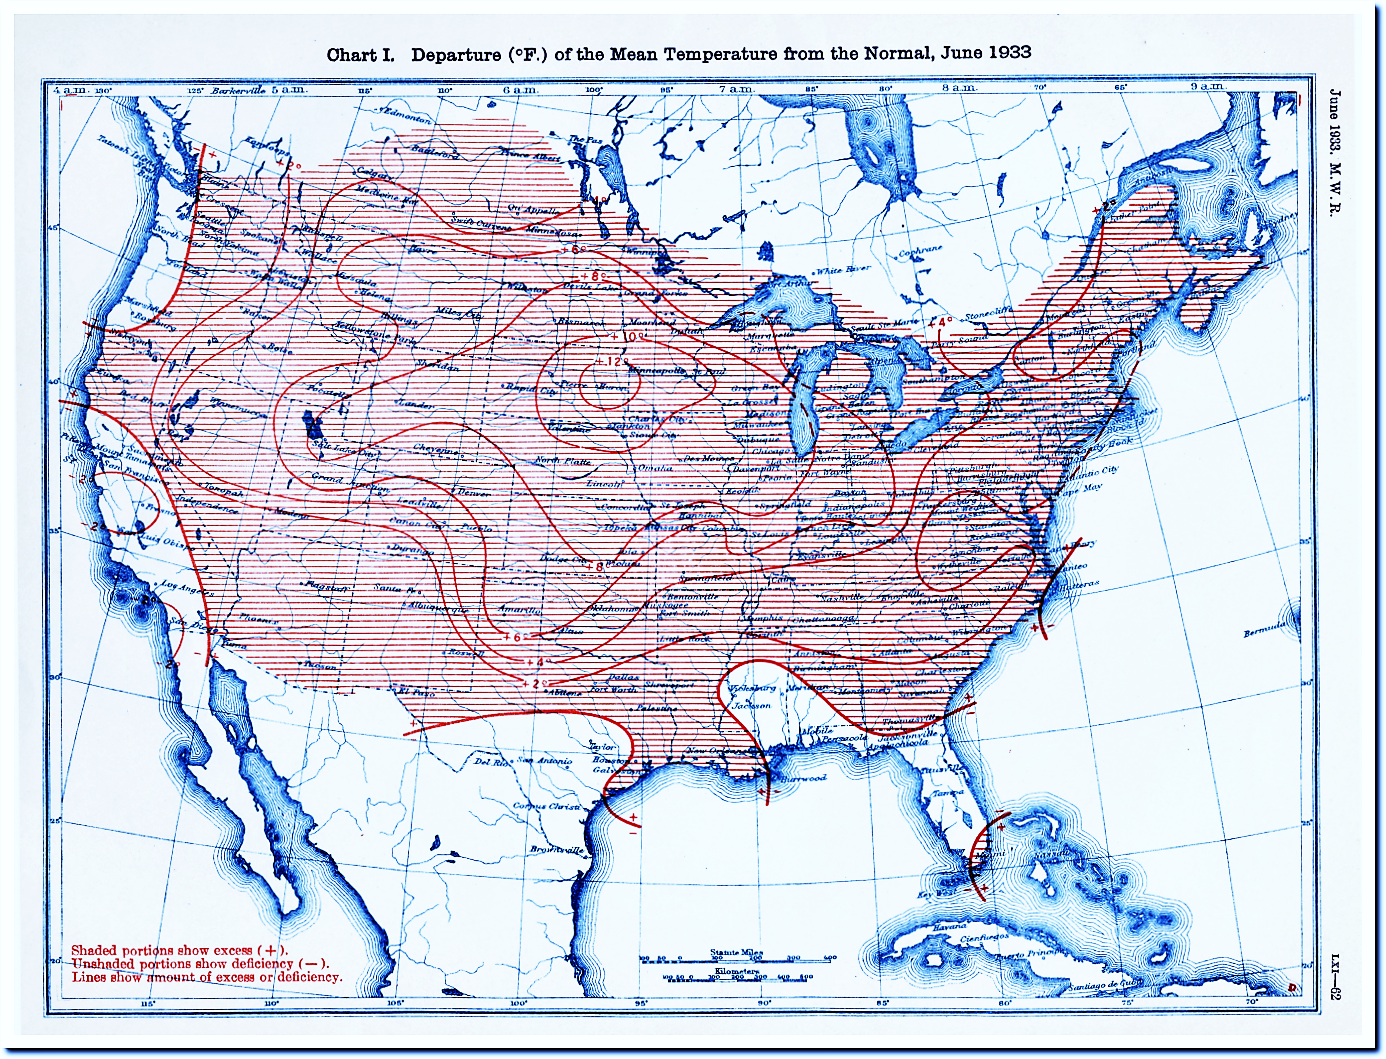
Almost the entire US was far above normal during June, 1933 – with parts of the Dakotas and Minnesota being an incredible 12 degrees above normal.
This is of course the exact opposite of what you hear from government climate scientists, who are paid to lie about the climate and tamper with data.
Jun. 29, 1989 10:49 PM ET UNITED NATIONS (AP)
A senior U.N. environmental official says entire nations could be wiped off the face of the Earth by rising sea levels if the global warming trend is not reversed by the year 2000.

Word is that President Trump is keeping his campaign promise and will bail the US out of the fake and disastrous Paris “Climate” Treaty. Progressives will predictably start blaming all bad weather on the President, like they blamed witches for bad weather in the 16th century.
Never mind that their hero, James Hansen, agrees with Trump that the treaty is a scam.

Measured temperatures in Iceland show a cyclical pattern, with the late 1930’s warmer than the present. The measured data doesn’t fit NASA’s theory about CO2 driving climate, so they cool past temperatures to create the appearance of a warming trend.
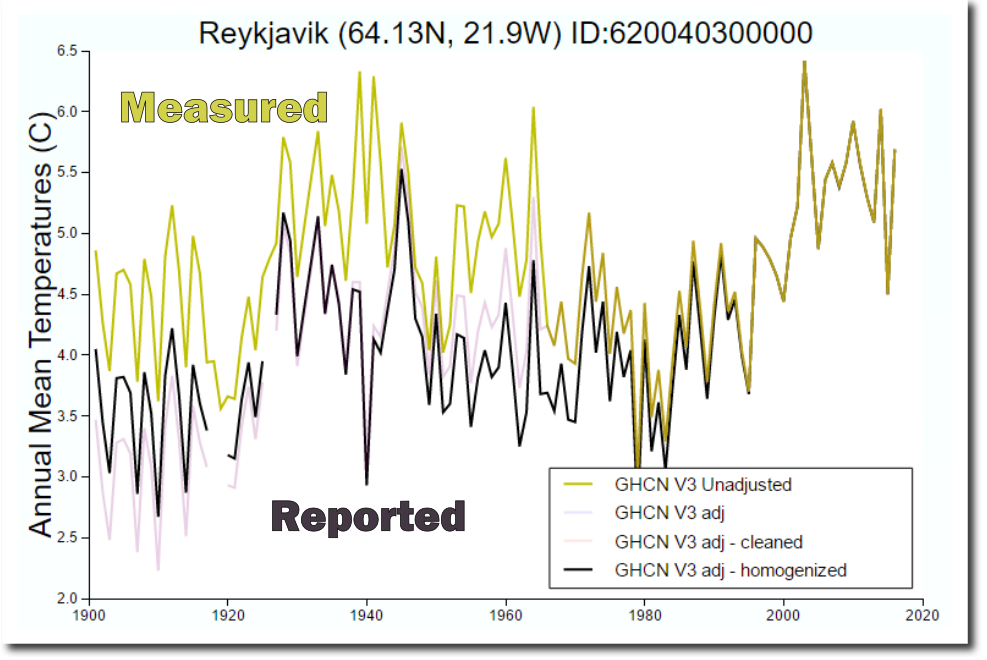
Data.GISS: GISS Surface Temperature Analysis
Temperatures around 1940 are cooled more than two degrees centigrade.
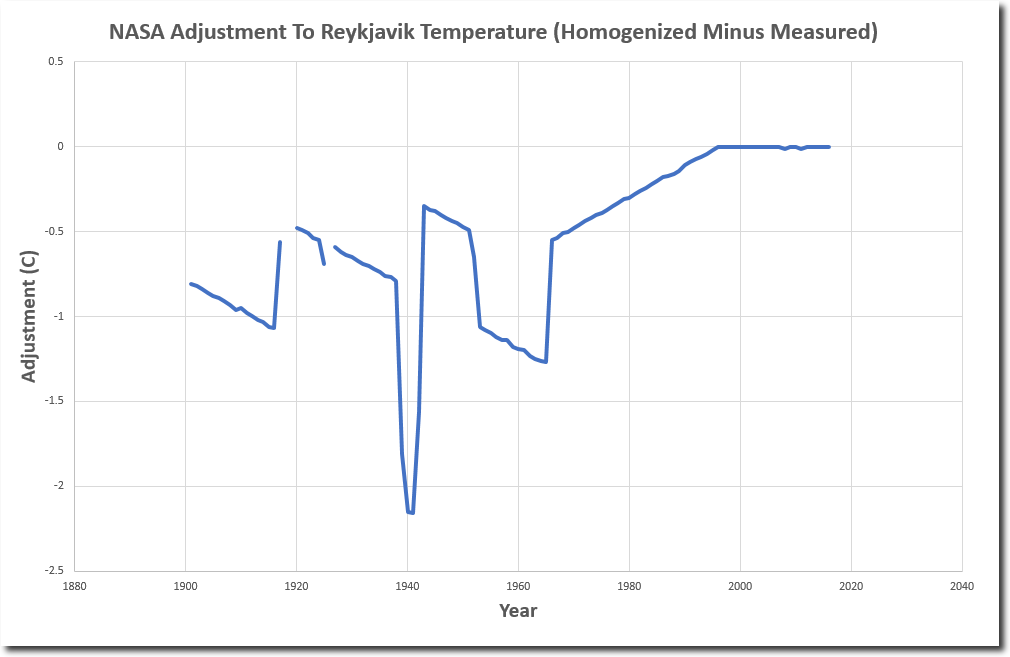
NASA wants temperatures to track atmospheric CO2, which has been rising exponentially since abut 1940.
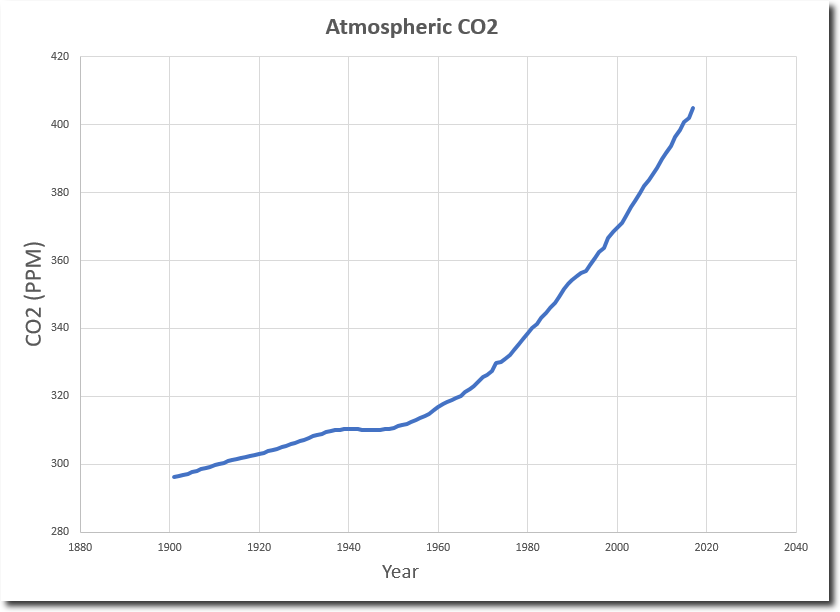
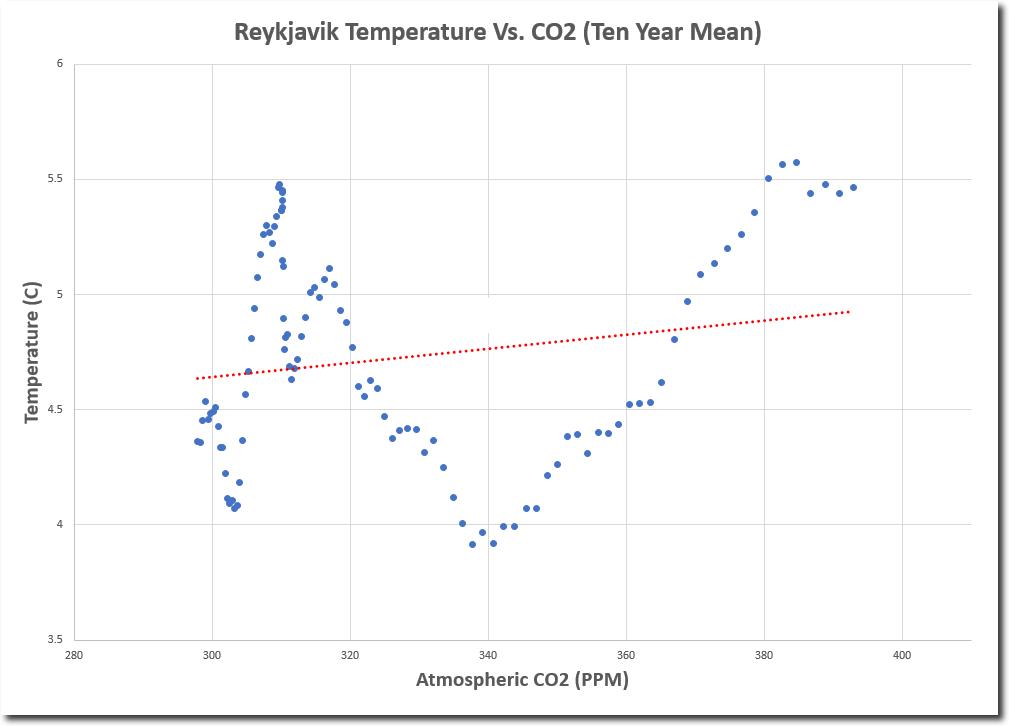
Iceland temperatures show essentially no correlation with CO2, so NASA changes the measured temperatures to bring them closer in line with theory.
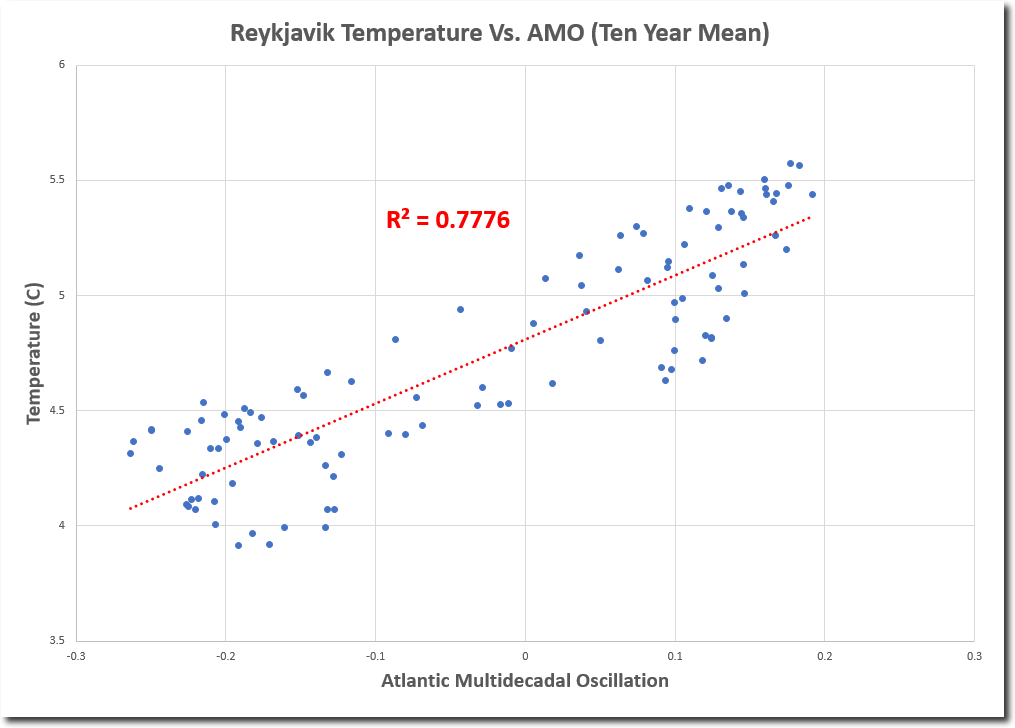
If the climate people at NASA were actual scientists, they would look for a real explanation of the cyclical behavior of temperatures in Iceland – rather than tampering with data to match their theory. The Atlantic Multidecadal Oscillation (AMO) is an ocean circulation pattern which closely matches the cyclical behavior seen in Iceland temperatures.
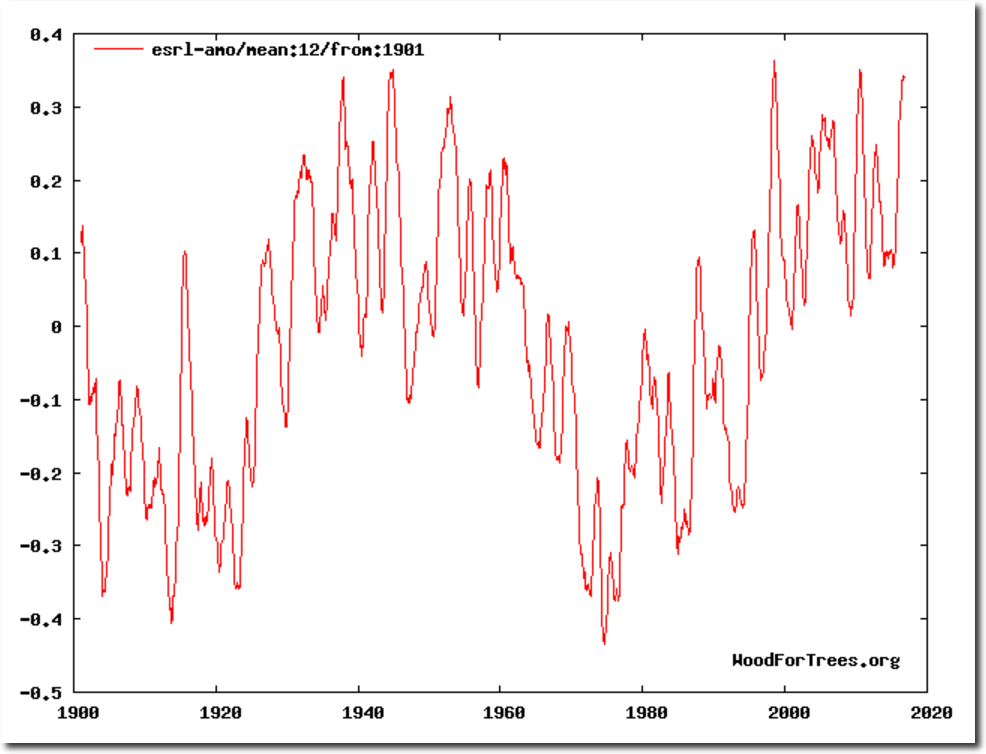
Wood for Trees: Interactive Graphs
The correlation between Iceland temperatures and CO2 is essentially non-existent, but correlation with the AMO is excellent.
We have other physical evidence that the time around 1940 was as warm or warmer than now in the Arctic. NASA data tampering has no justification.
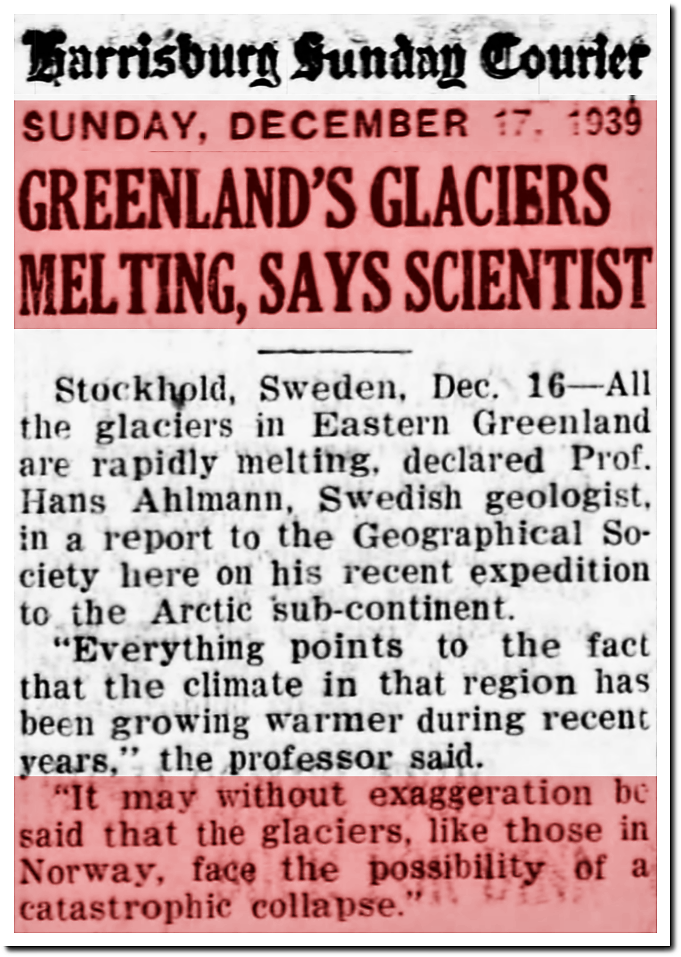
17 Dec 1939, Page 15 – Harrisburg Sunday Courier
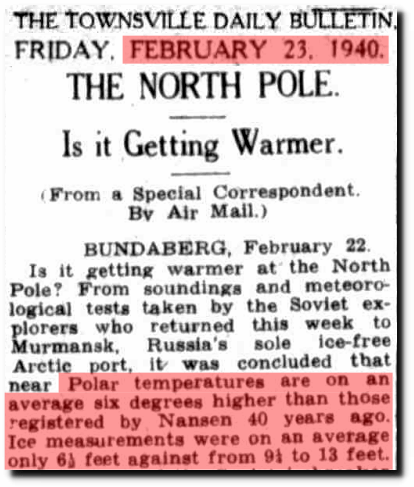
It should be obvious to any serious scientist that NASA doesn’t understand climate, and that they are committing massive, unprecedented fraud by tampering with the data. But this story is much larger than the Arctic. Atmospheric temperatures for the entire planet closely match the AMO.
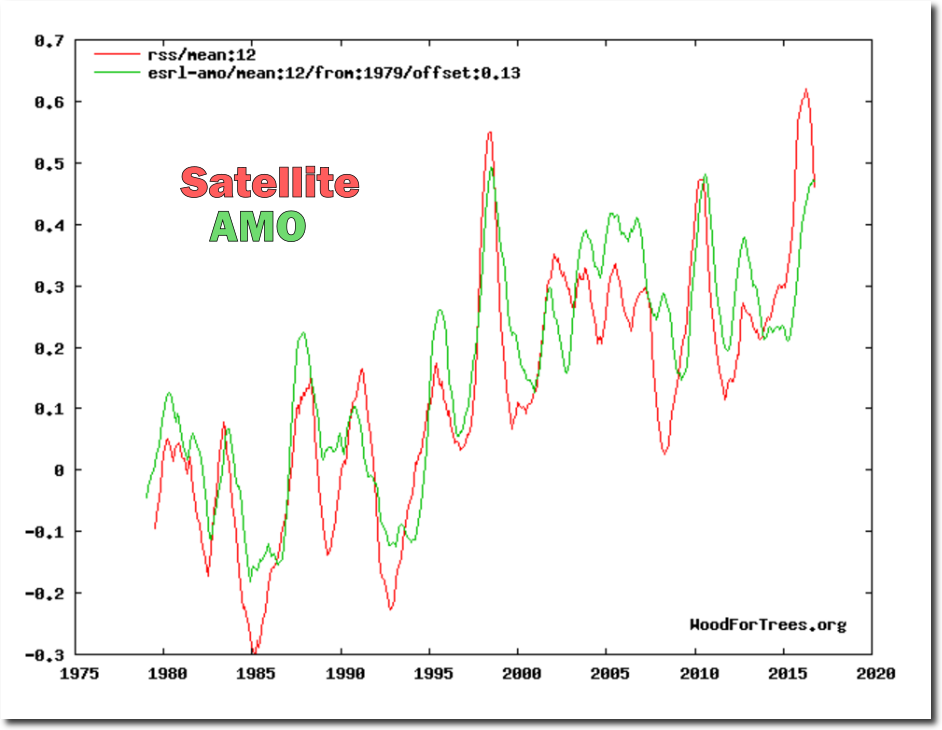
Which means that Earth is likely to start cooling again soon.
Wood for Trees: Interactive Graphs
This is why Gavin Schmidt at NASA is ramping up his data tampering every month. More and more fraud is required to hide the decline.