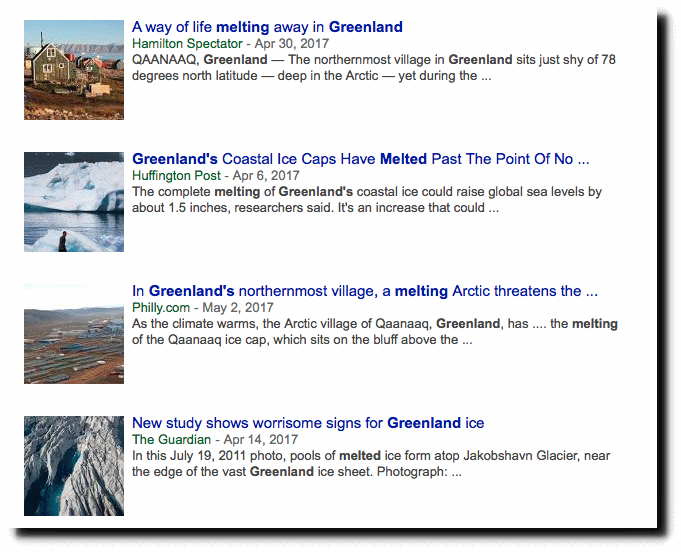
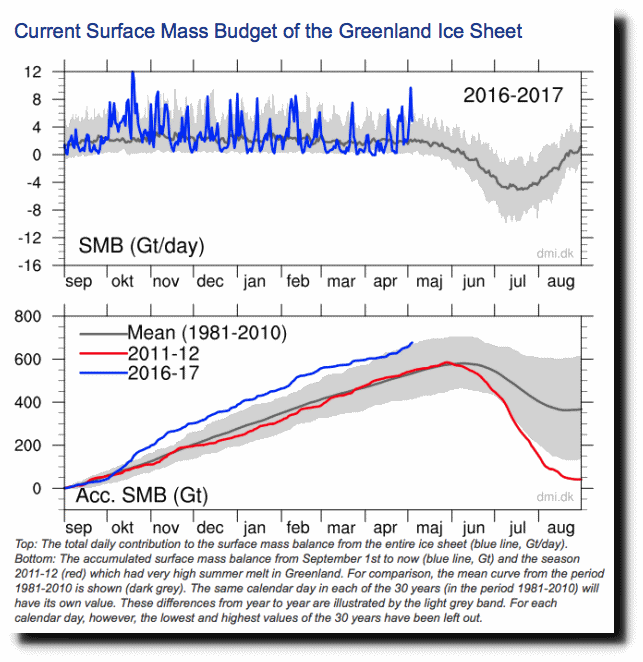
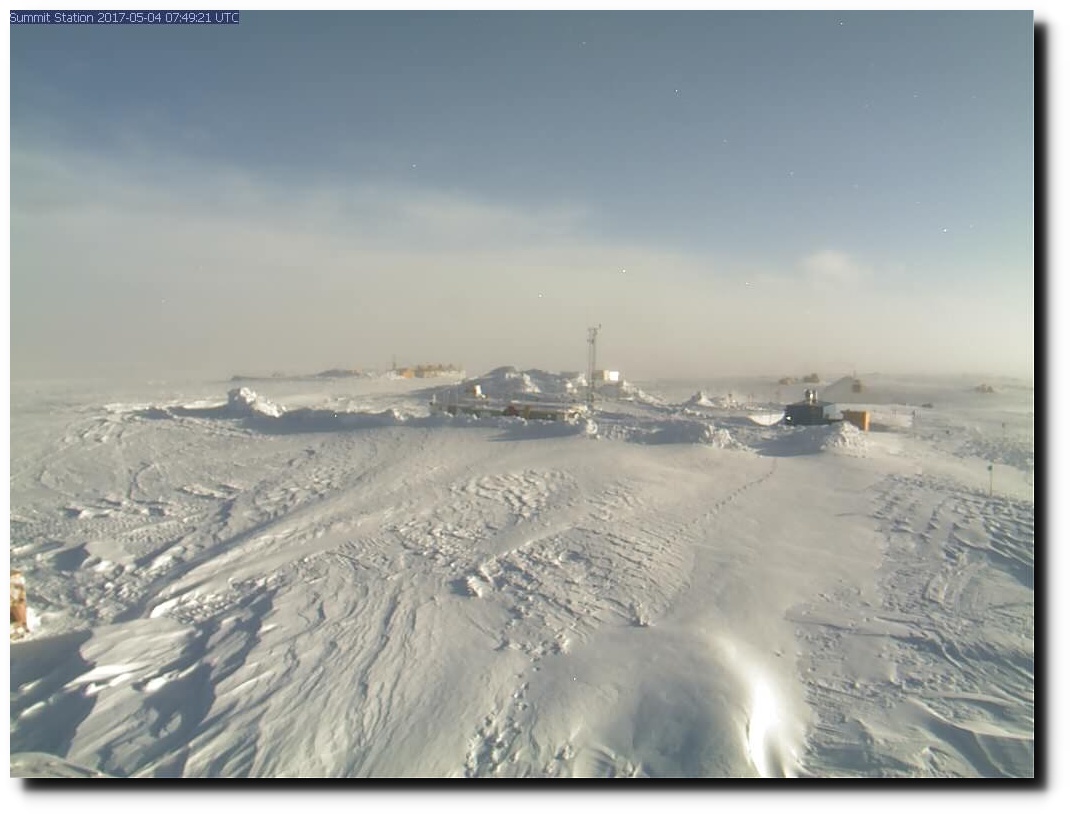
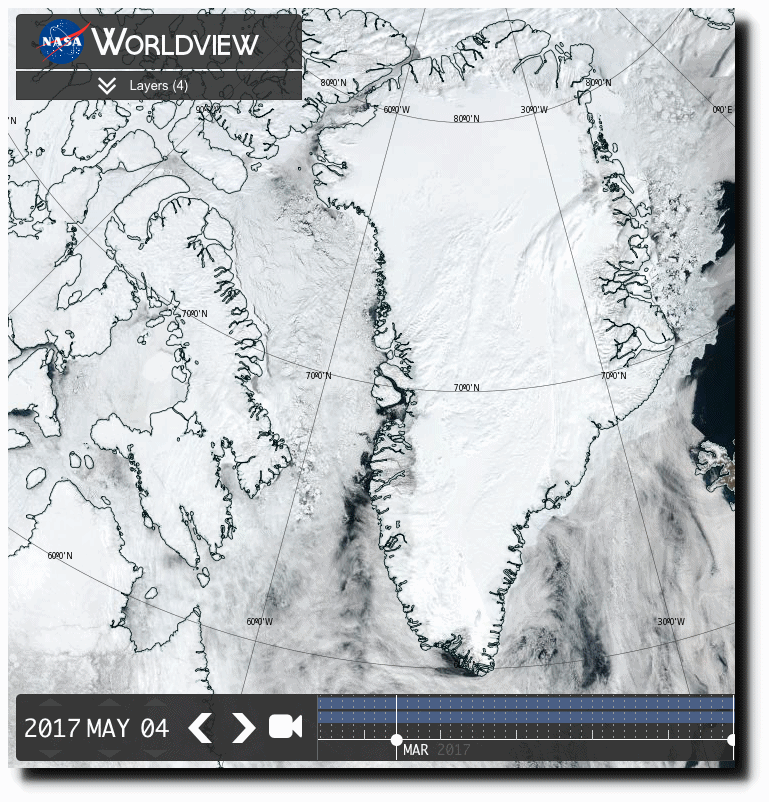
I fly over Greenland regularly. The ice sheet looks almost exactly the same as it did 20 years ago. The claims of Greenland melting are 97% nonsense, just like everything else the press and government climate scientists say.
“Who controls the past controls the future. Who controls the present controls the past.”
? George Orwell, 1984
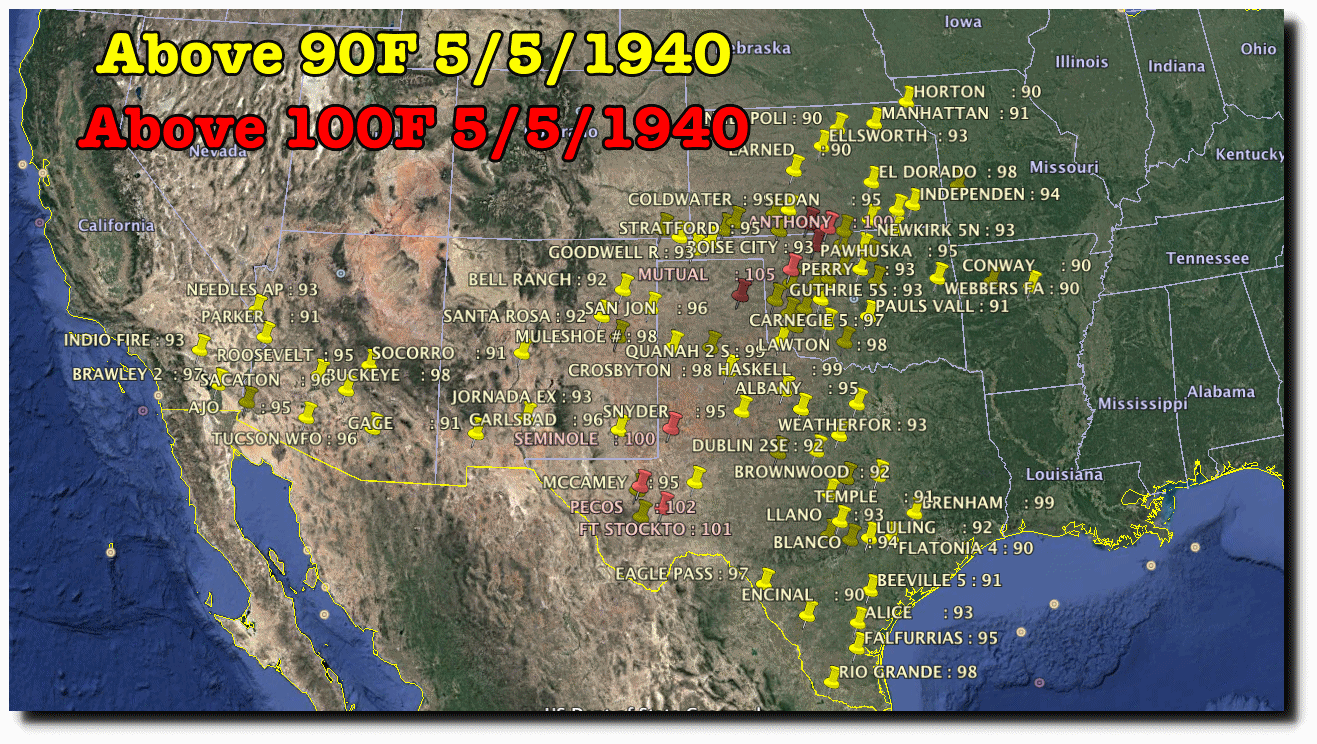
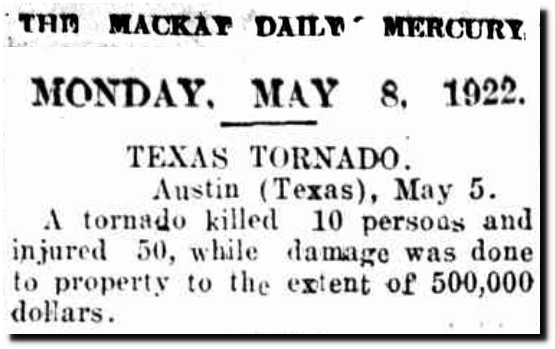
On this date in 1940, there were 100 degree temperatures in Kansas, Oklahoma and Texas. About 25 degrees warmer than today’s forecasts.
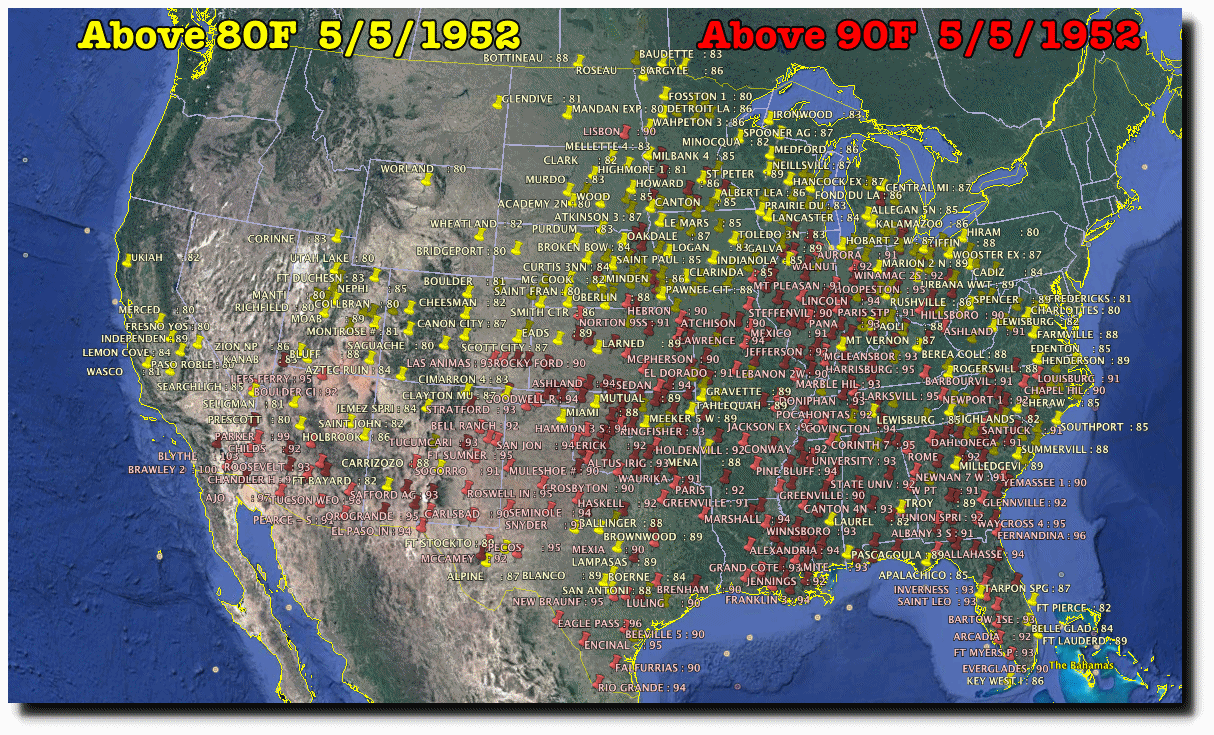
On this date in 1952, it was 90 degrees in Michigan, Minnesota and Montana, about 30 degrees warmer than today’s forecast.
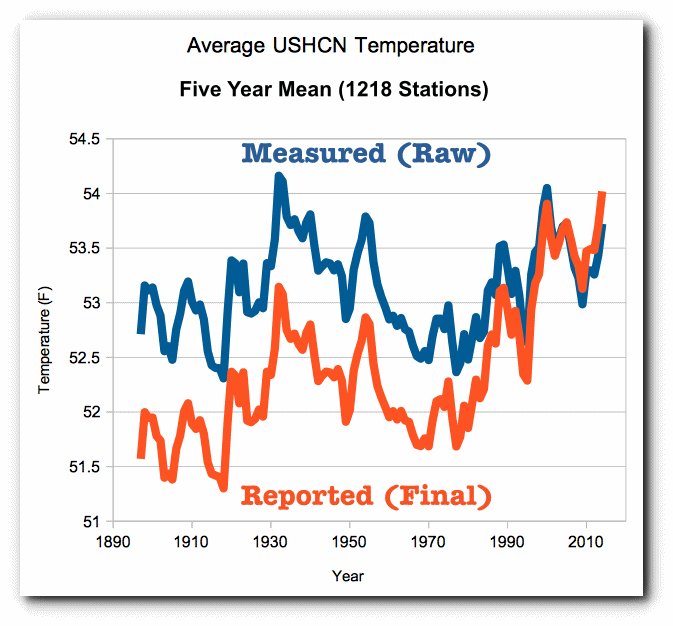
People believe fake news about global warming, because they don’t know how hot it was in the past. And the reason people don’t know how hot the past was, is because government agencies erase the hot past. Just like Orwell predicted.
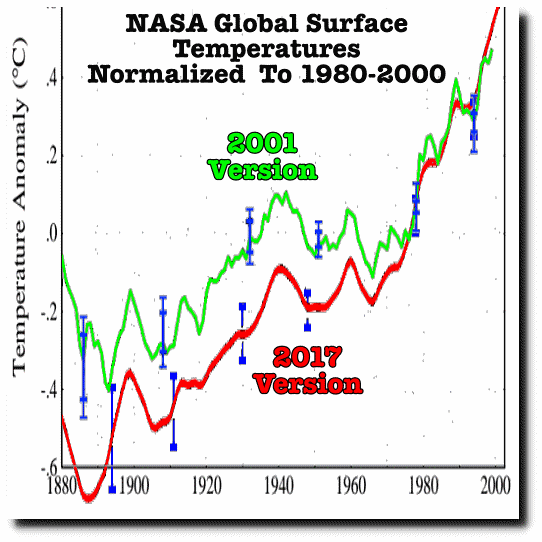
NASA not only hides the past heat, but they regularly alter data far outside their own 95% confidence error bars – shown in blue.
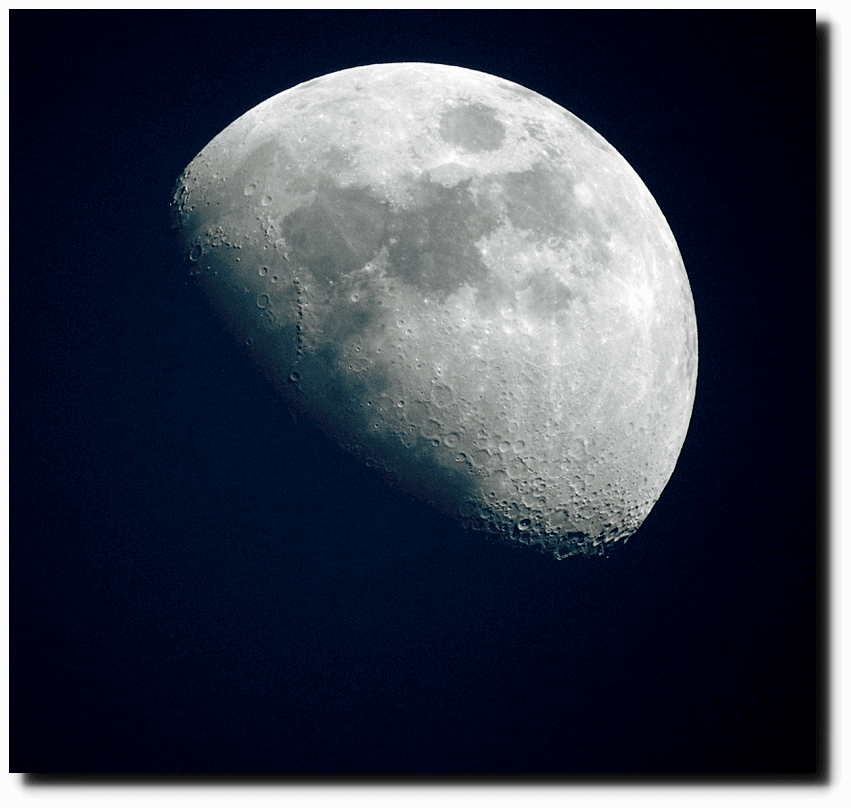
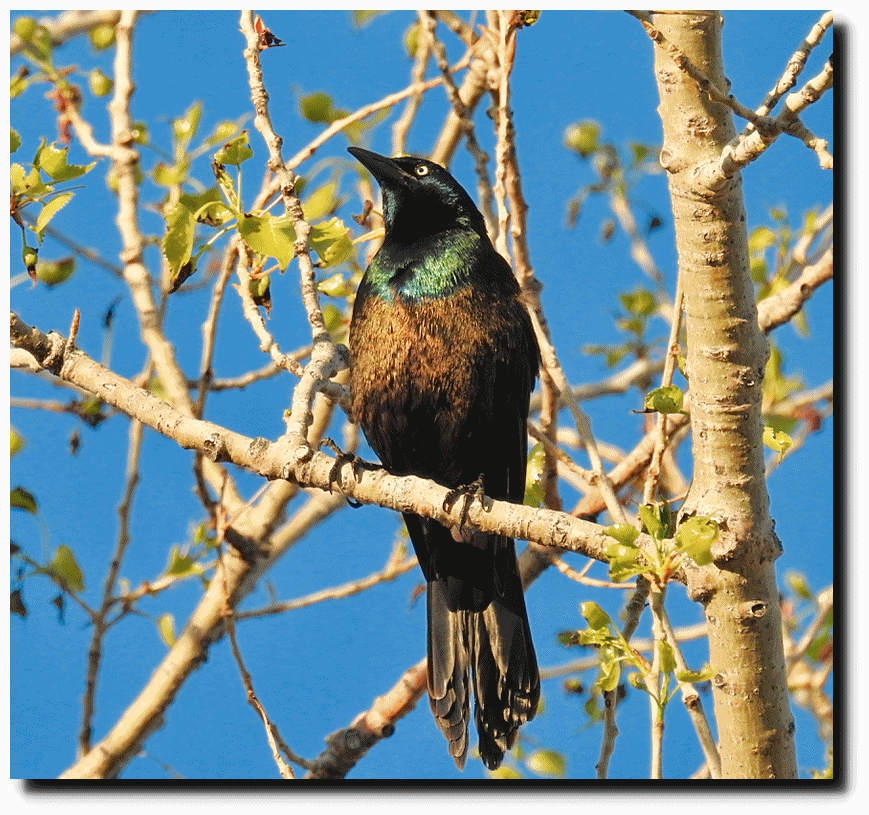
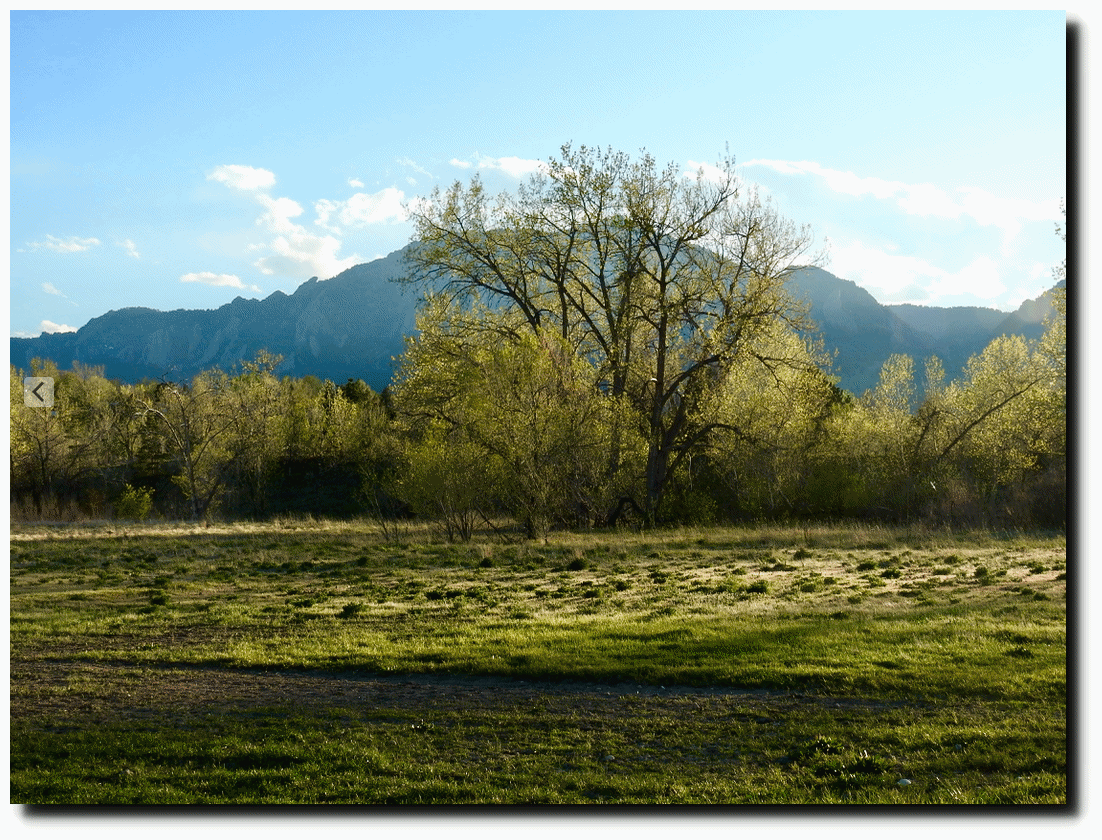
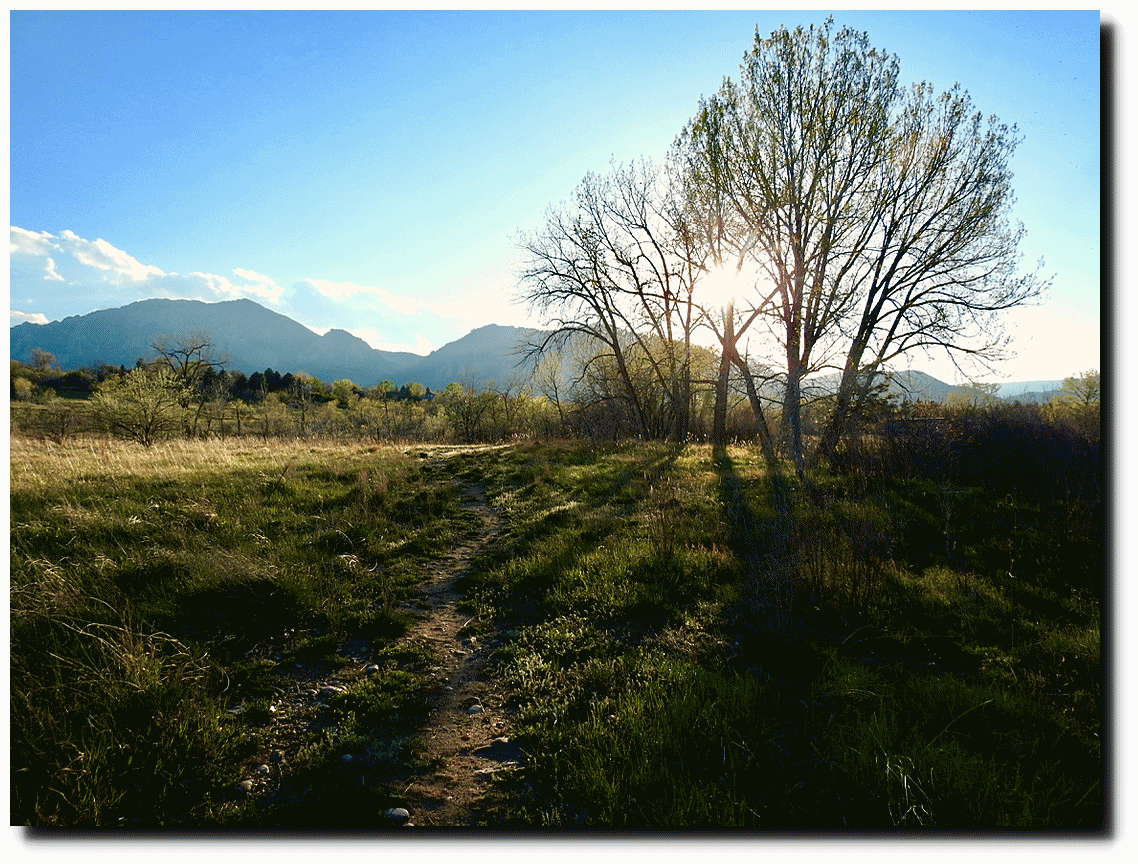
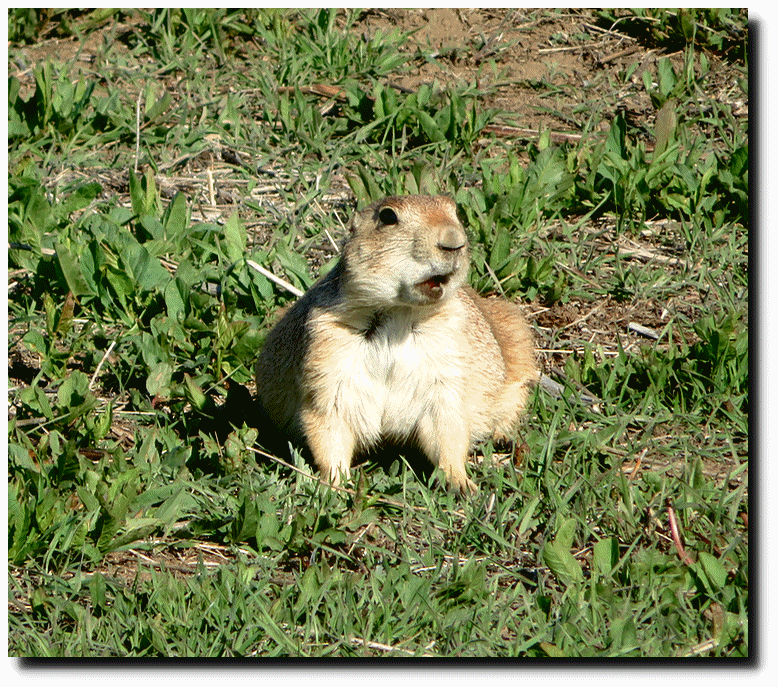
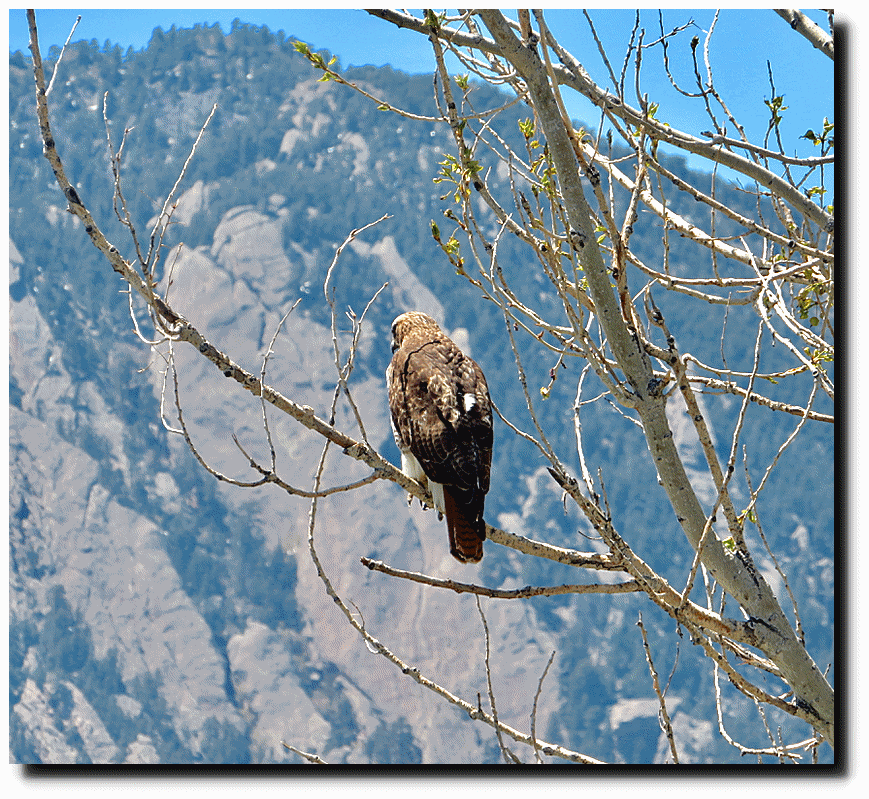
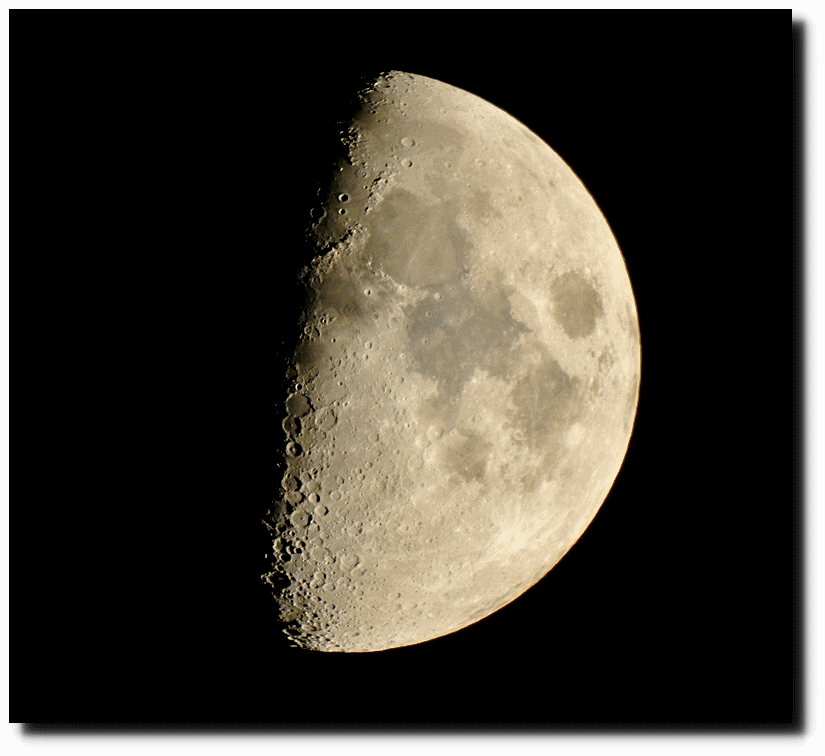
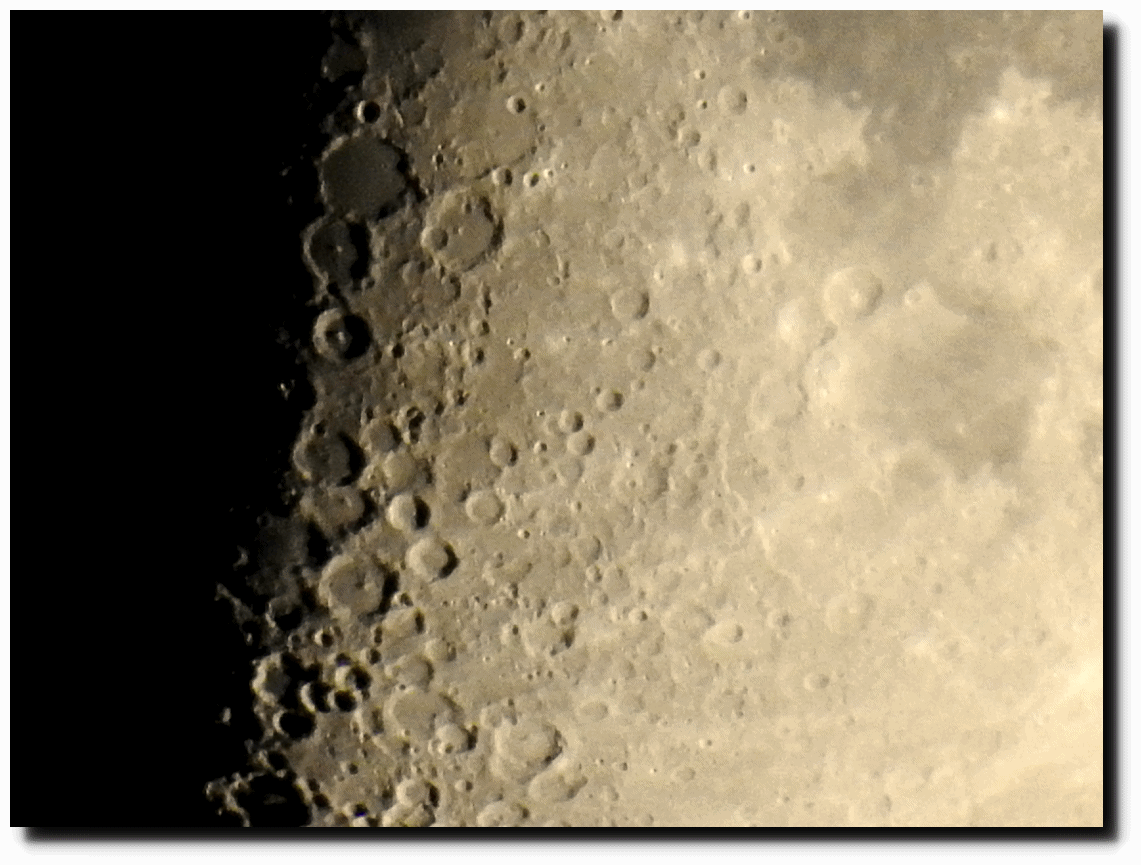
I just took these with my Nikon P900, while walking the dogs in the South Boulder Wetlands this afternoon – which the City of Boulder and the University of Colorado want to destroy.
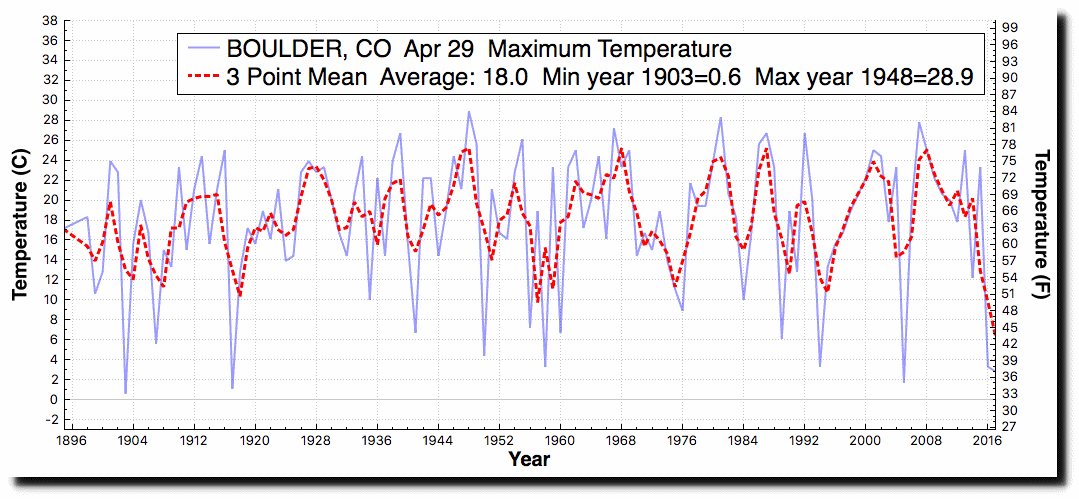
April 29 was the 4th coldest on record here in Boulder. Last year was 5th coldest. It was the first time we ever had two consecutive cold April 29th’s in a row.
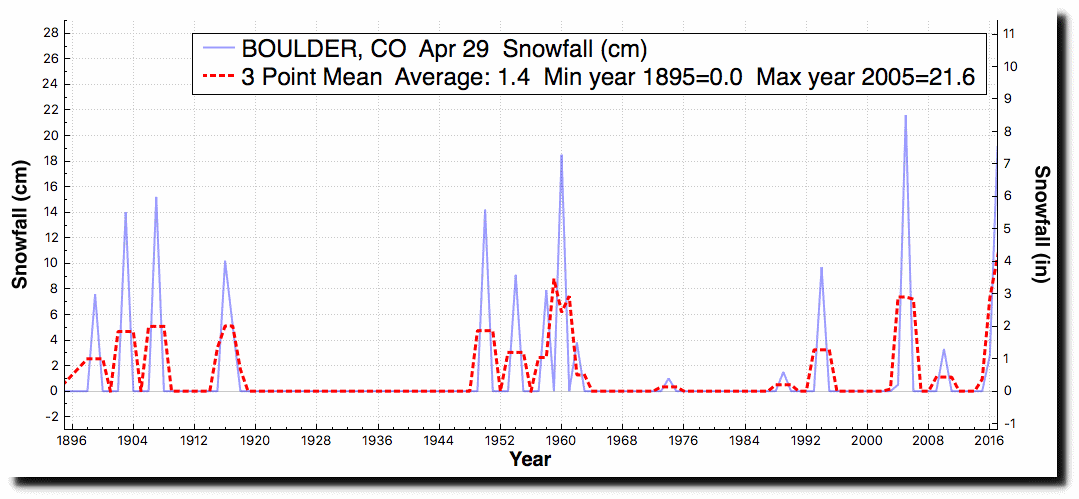
We had 8 inches of snow on April 29, second largest April 29 snow on record. It snowed last year too.
Last year I attended a meeting of the Boulder Clean Power Plan at the University of Colorado. People there said they were very traumatized by climate change. I asked a prominent educator how she perceived the local climate was changing. The only thing she could think of was :
Well it seems like it snows more in the Spring than it used to.
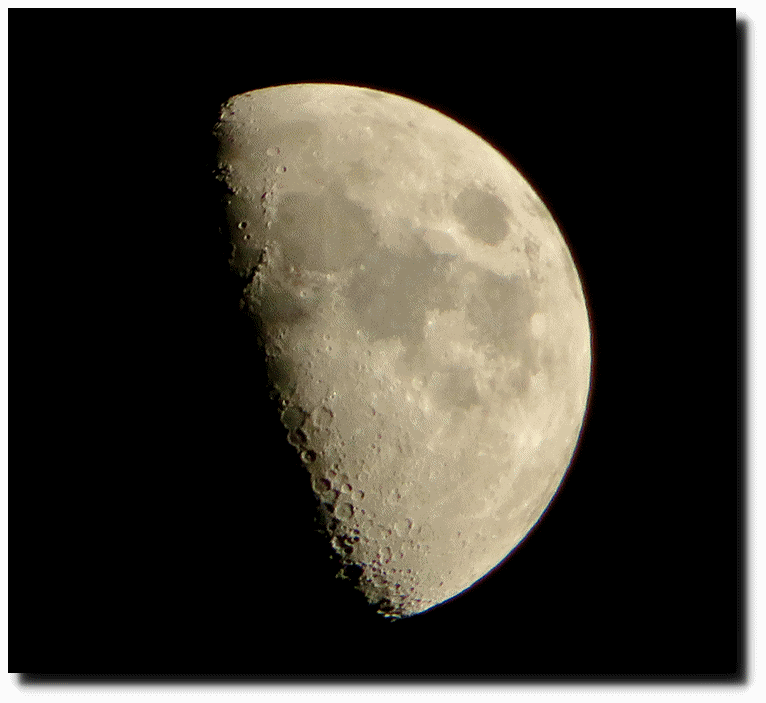
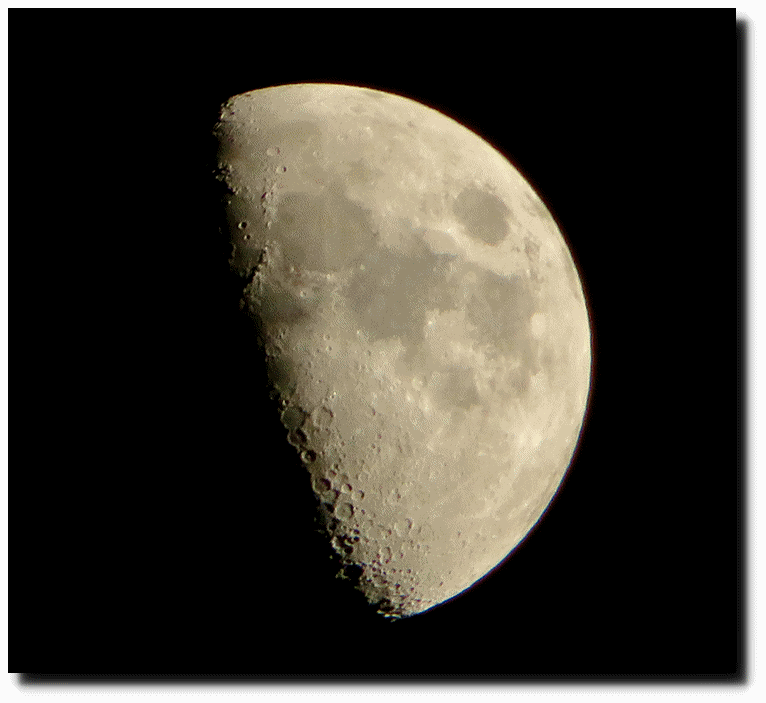
I just took this picture with a Canon SX-720 pocket camera.
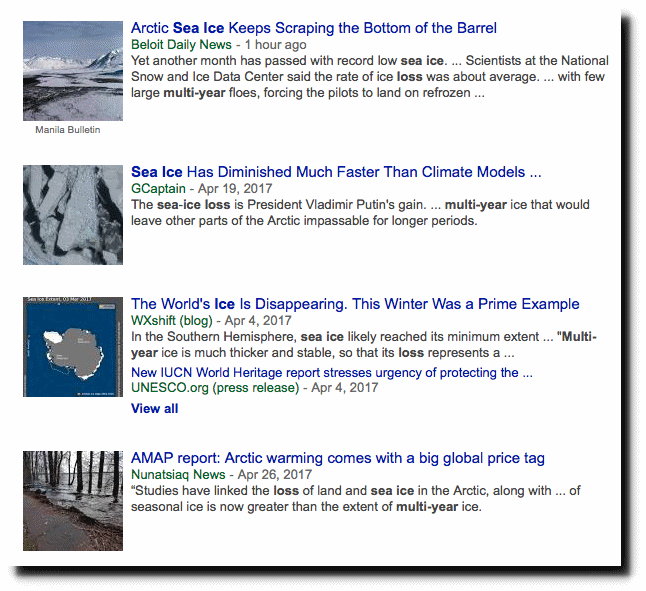
The fake news press continues to bombard the public with claims that Arctic multi-year sea ice is disappearing. As recently as one hour ago.
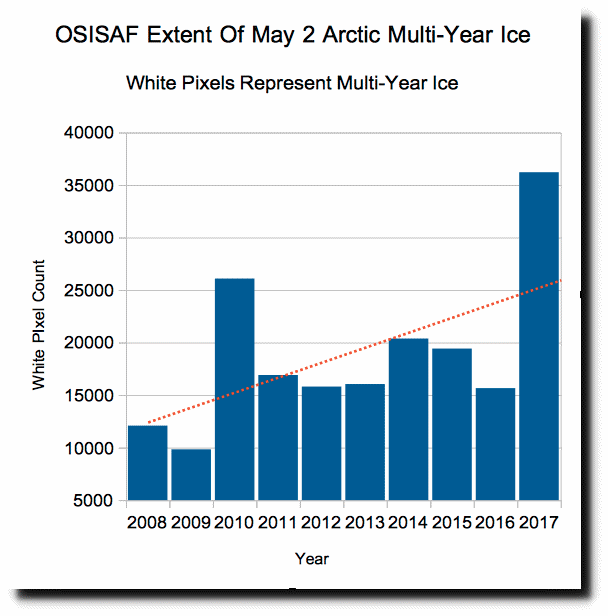
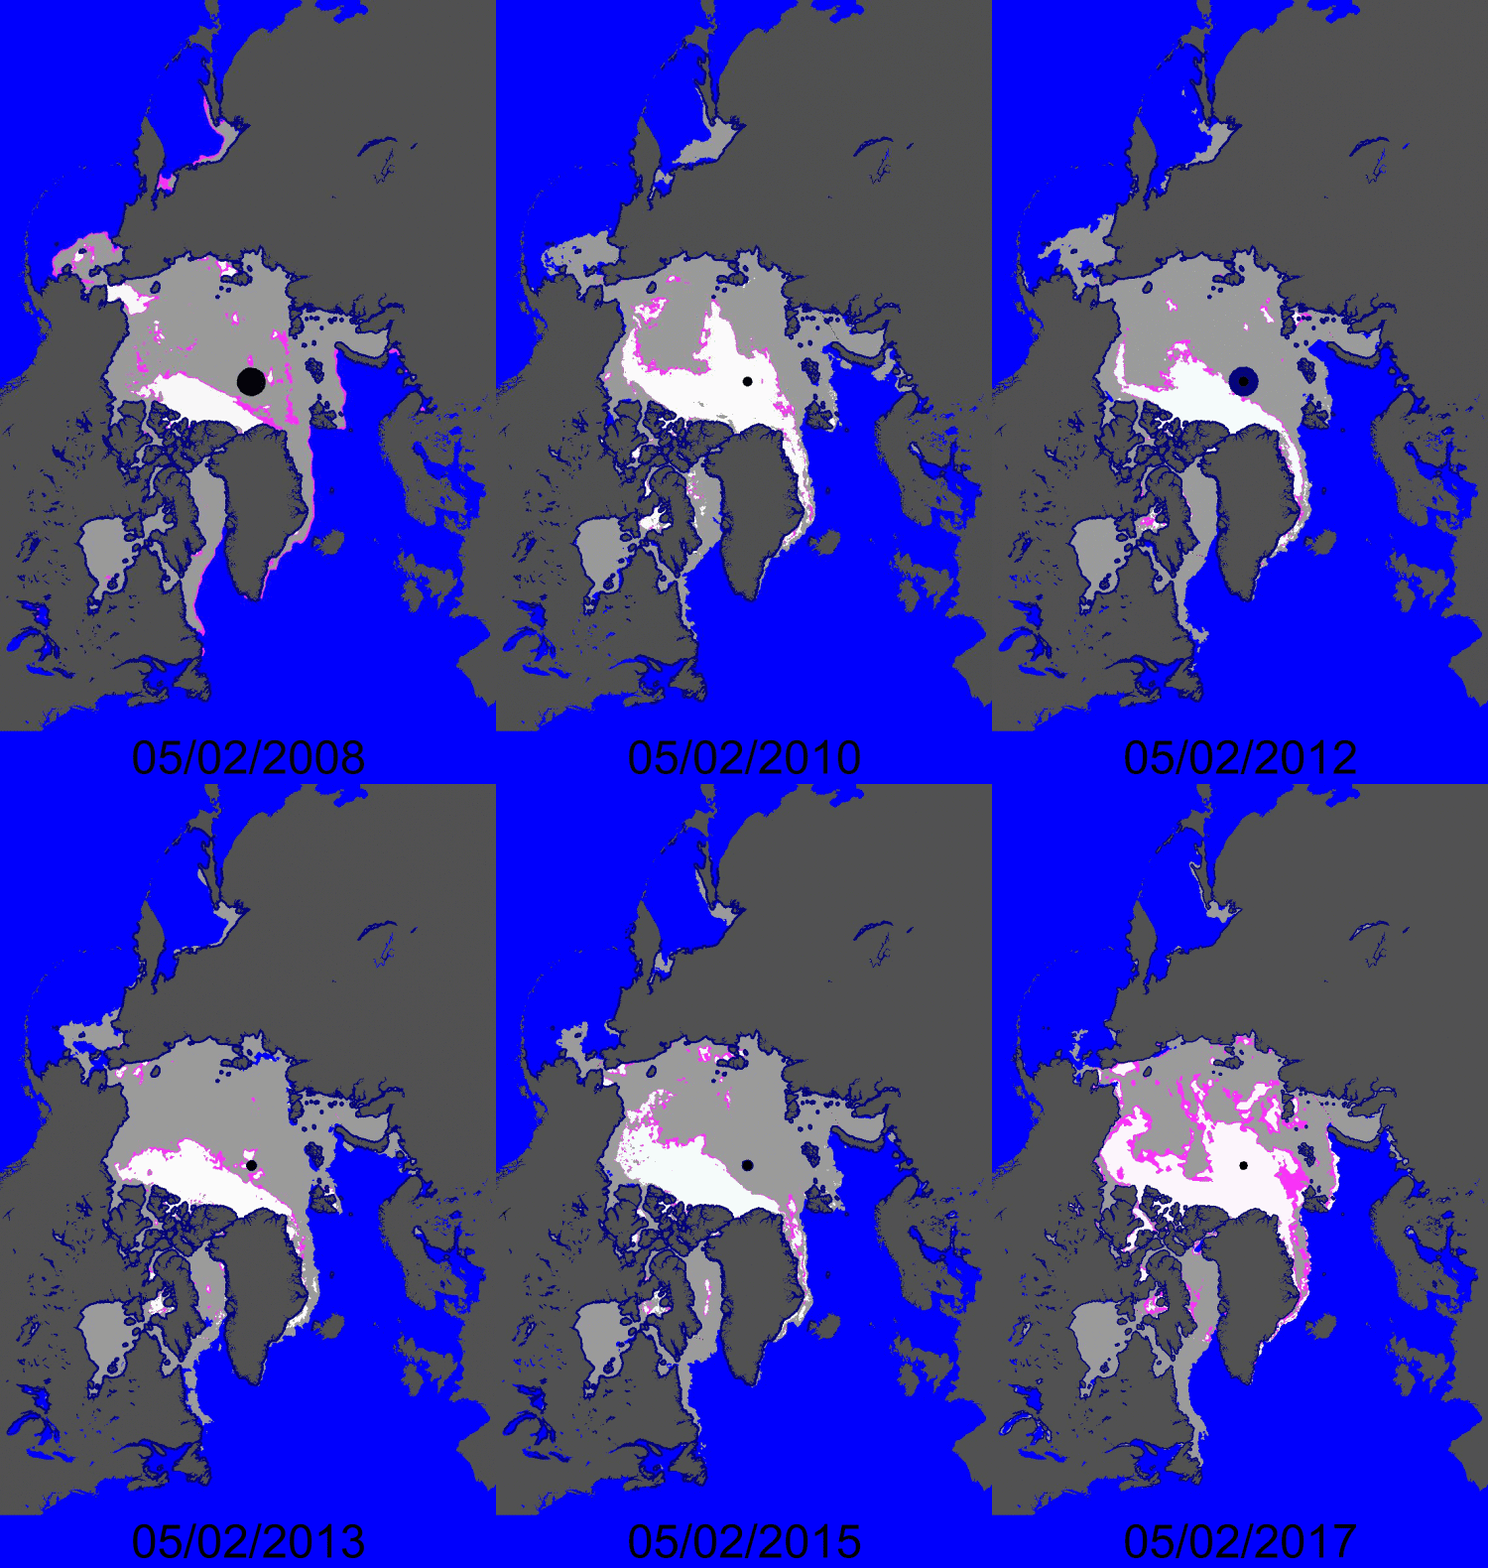
As with almost everything else reported by the press about climate, the claims are completely fraudulent. The coverage of multi-year sea ice has tripled since 2008.
This animation shows the huge increase in the areal coverage of multi-year ice.
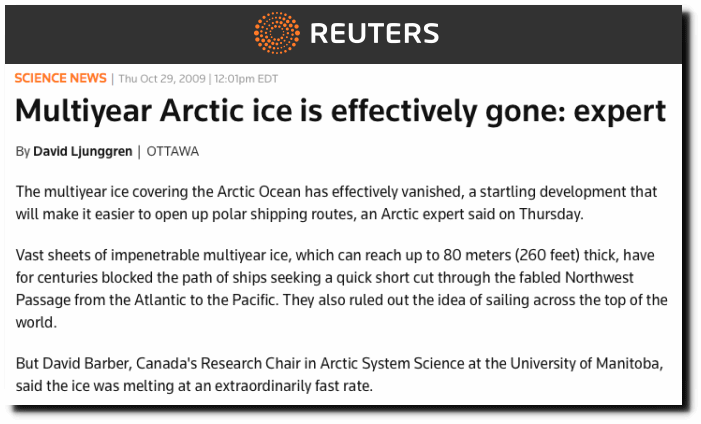
In 2009, experts announced that Arctic sea ice was “effectively gone.” Since then, the coverage of multi-year sea ice has more than tripled, and experts say it is “disappearing.”
You can reproduce my work on a Linux, Mac or Cygwin system using this script. On the other hand, you can’t reproduce the work of government climate scientists, because they are doing propaganda, not science.
#!/bin/tcsh

set MONTH=`date -v -1d +%m`
set DAY=`date -v -1d +%d`
set DATE=${MONTH}${DAY}
rm -f MYI_${DATE}.csv

foreach year (2008 2009 2010 2011 2012 2013 2014 2015 2016 2017)
    set LABEL=${MONTH}/${DAY}/${year}
    rm -f ice_type_nh_${year}${DATE}1200.jpg
    rm -f ice_type_nh_${year}${DATE}1200.gif
    echo ice_type_nh_${year}${DATE}1200.jpg
    echo http://osisaf.met.no/quicklooks/prod/ice/${year}/${MONTH}/ice_type_nh_${year}${DATE}1200.jpg
    curl -O http://osisaf.met.no/quicklooks/prod/ice/${year}/${MONTH}/ice_type_nh_${year}${DATE}1200.jpg
    convert ice_type_nh_${year}${DATE}1200.jpg -gravity center -pointsize 72 -background blue label:$LABEL -append                 ice_type_nh_${year}${DATE}1200.gif
    rm ice_type_nh_${year}${DATE}1200.jpg
    convert ice_type_nh_${year}${DATE}1200.gif ice_type_nh_${year}${DATE}1200.txt
    echo $year","`grep '#F' ice_type_nh_${year}${DATE}1200.txt | wc | awk -F" " '{print $1}'` >> MYI_${DATE}.csv
end
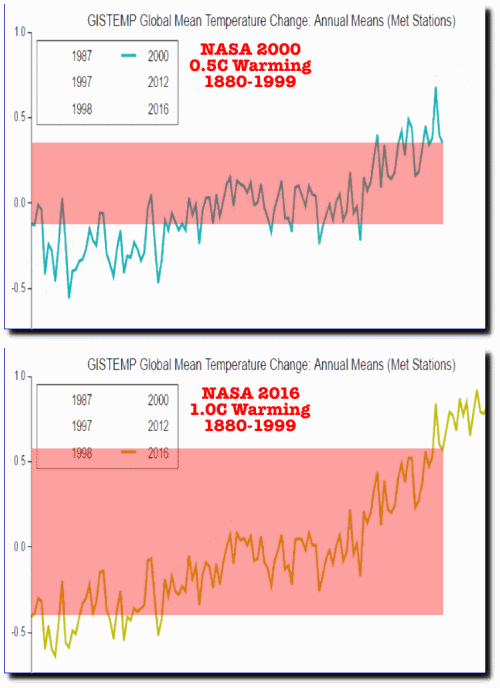
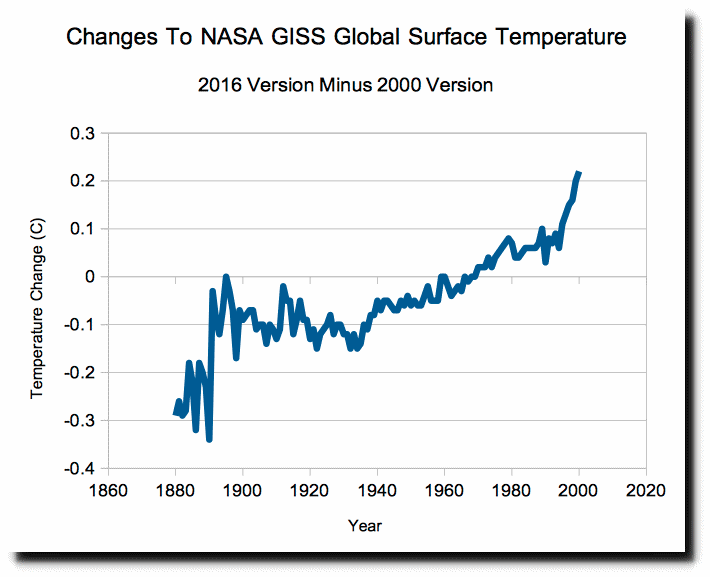
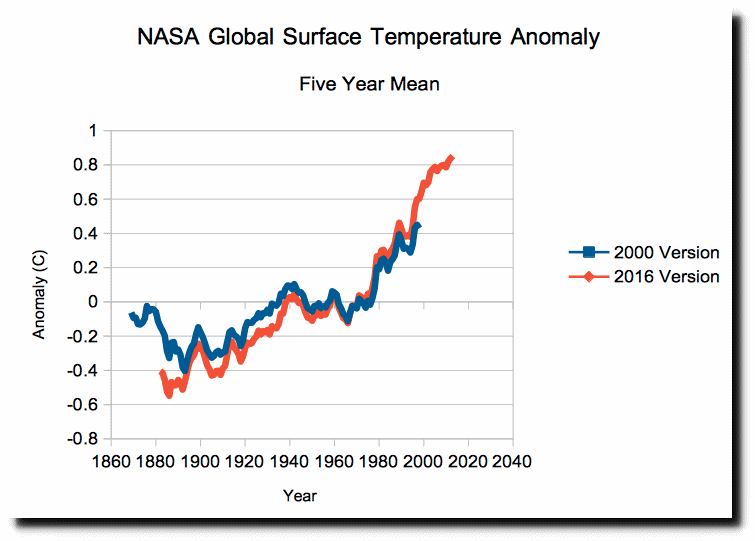
In the year 2000, NASA showed 0.5C warming from 1880 to 1999. Now they show 1.0C warming during that same period. The animation below was made using images captured directly from the NASA GISS web site.
But it is worse than it seems. Not only did NASA double warming by altering data, but they hid the warmth prior to 1880. In the 2000 version, there was little or no warming from the 1870’s to the 1970’s, and about 0.4C warming after the 1970’s.
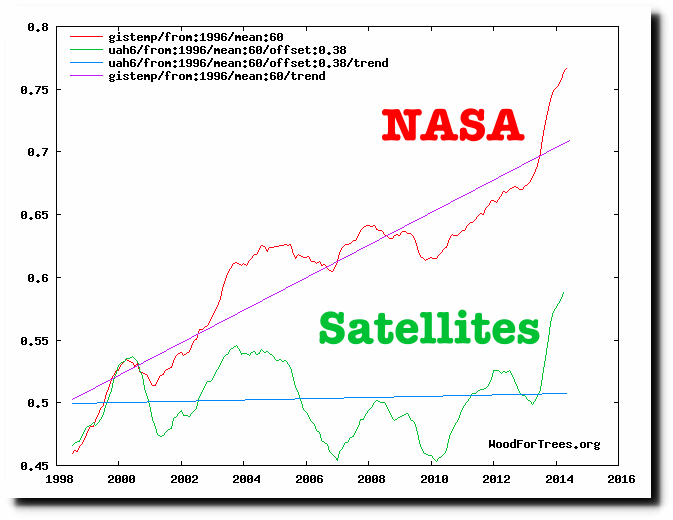
As bad as this story is already, it gets worse. The 2016 version shows a very rapid increase in temperature after the year 1998, but satellites show little warming during that period.
NASA is hiding pre-1880 warmth, tampering with the 1880-1999 data, and showing a huge amount of imaginary warming since then. Junk science doesn’t get any worse than this.