A nesting pair of hawks in open space wetlands near my apartment, which City of Boulder greens want to destroy in order to pretend they are saving the planet from global warming.





A nesting pair of hawks in open space wetlands near my apartment, which City of Boulder greens want to destroy in order to pretend they are saving the planet from global warming.
Another useless confirmation bias based government agency bites the dust.

Historical CO2 Records from the Law Dome DE08, DE08-2, and DSS Ice Cores
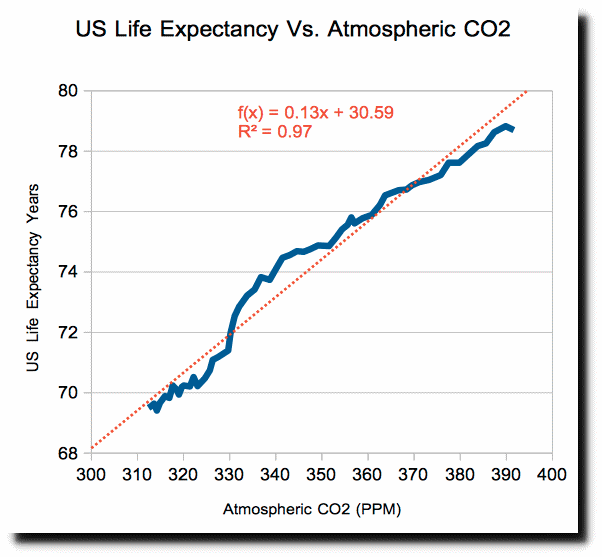
Five years ago this week, our crack government funded climate fraudsters announced that global warming reduces life expectancy.
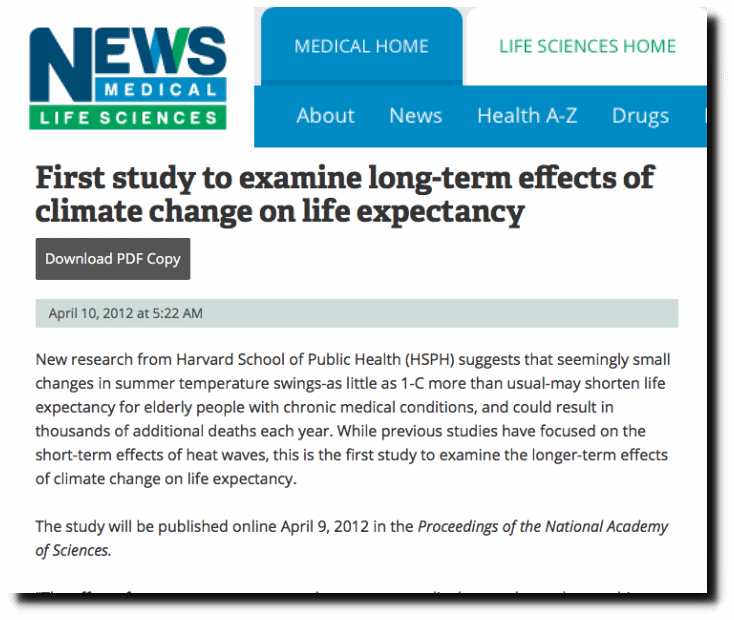
First study to examine long-term effects of climate change on life expectancy
Actual data shows that life expectancy is steadily increasing, and rises linearly with increasing CO2.
Life Expectancy – Our World In Data
Whatever government climate scientists say, it is normally safe to assume that the exact opposite is true. Old people move to the Arizona desert because they like the heat.

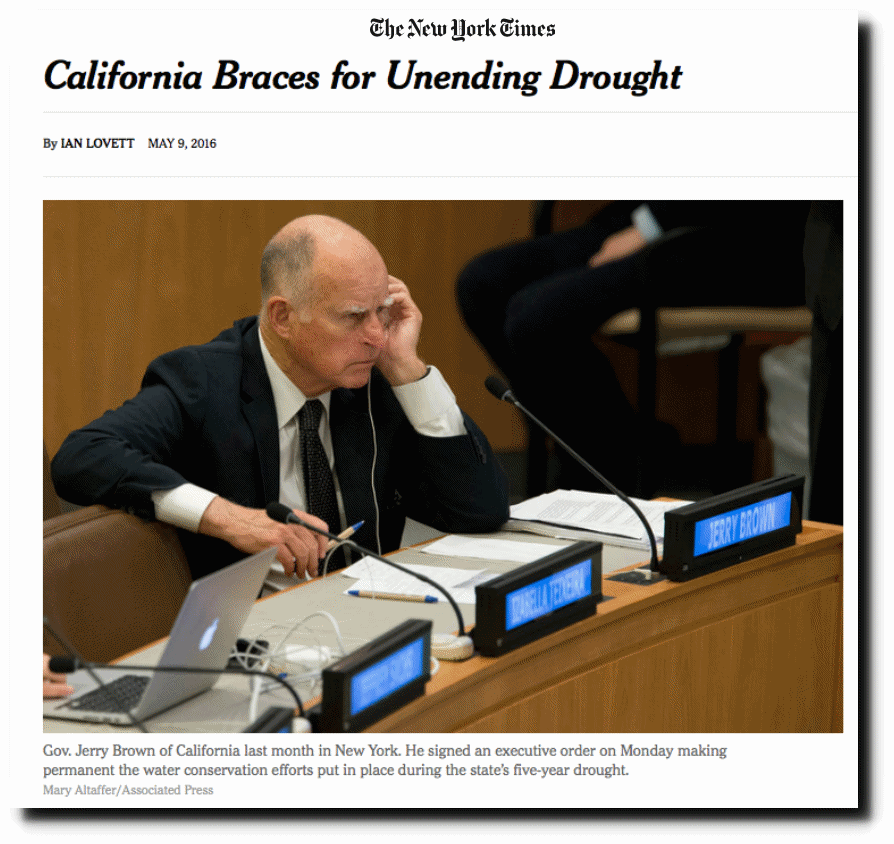
Less than year after fake news New York Times and fake governor Jerry Brown announced the California permanent drought, California is having their wettest year on record.
California Braces for Unending Drought – The New York Times

Lots more permanent drought on the way.
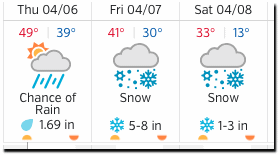
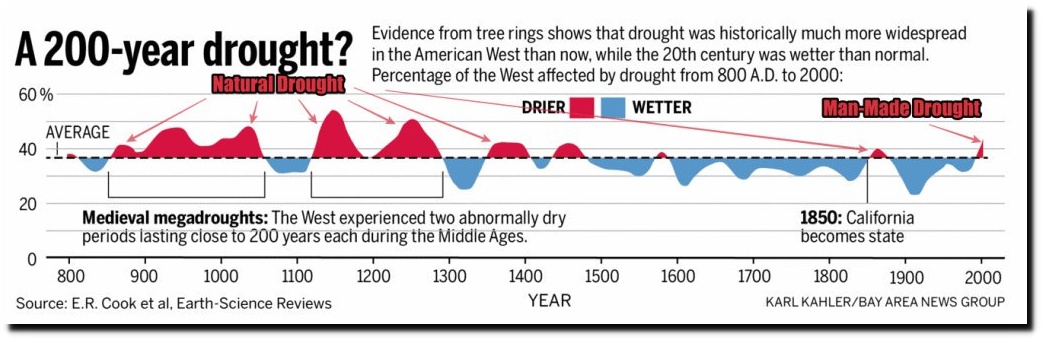
Progressives believe humans are evil, so all bad weather must be our fault. That is the extent of their understanding of science.
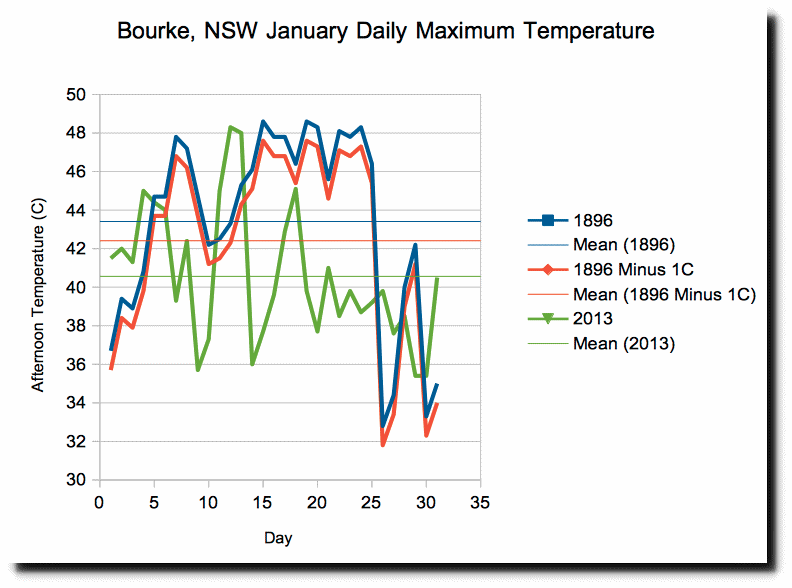
Australia’s Bureau of Meteorology hides the January 1896 heatwave, because they say measurement techniques exaggerated afternoon temperatures by 1C.
In 1887, Todd set up what must be one of the longest-running scientific experiments ever, when he installed thermometers in a Stevenson Screen and on a Glaisher Stand at Adelaide Observatory (as seen in the illustration here). Observations were taken in both exposures until 1948.
The results of this 61-year experiment show that summer daytime temperatures measured using the Glaisher Stand are, on average, 1C warmer than in the Stevenson Screen.
You will find that, after the adjustments they make to the data (to ensure the early data can be reliably compared with modern data), some years in the 19th century were indeed warm. But nothing like the heat we endured across the country in 2013.
According to Berkeley Earth, the Australian average daily maximum temperature in January 1896 was about 1C hotter than the 1951-80 January average. But January 2013 was a full 1.5C hotter again – really, the late 19th century temperatures don’t come close to modern extremes.
That’s why the Bureau’s official temperature records start in 1910 – before that date we have good grounds for believing that the data are poor and biased (and would be difficult to adjust for the many problems).
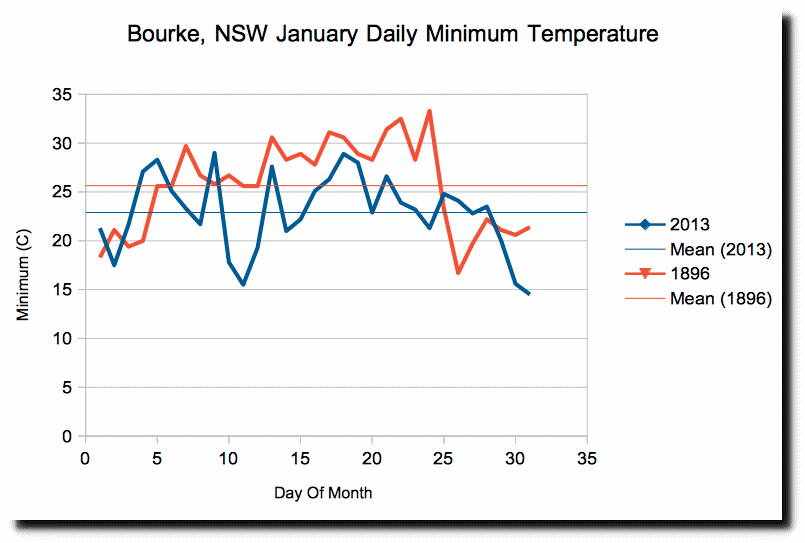
I tested out their theory by comparing the 1896 heatwave vs. the 2013 heatwave. Even after subtracting 1C from the 1896 temperatures, 1896 was still 2C hotter than 2013. In 1896 they had weeks of extremely hot weather, whereas in 2013 they only had a small handful of hot days.
Nighttime temperatures were also 2C hotter in 1896 than 2013. Nighttime temperatures aren’t affected by stand type. Ignoring the 1896 heatwave is malfeasance, not science.
January 1896 was incredibly hot. BOM is hiding it because it wrecks their global warming scam.
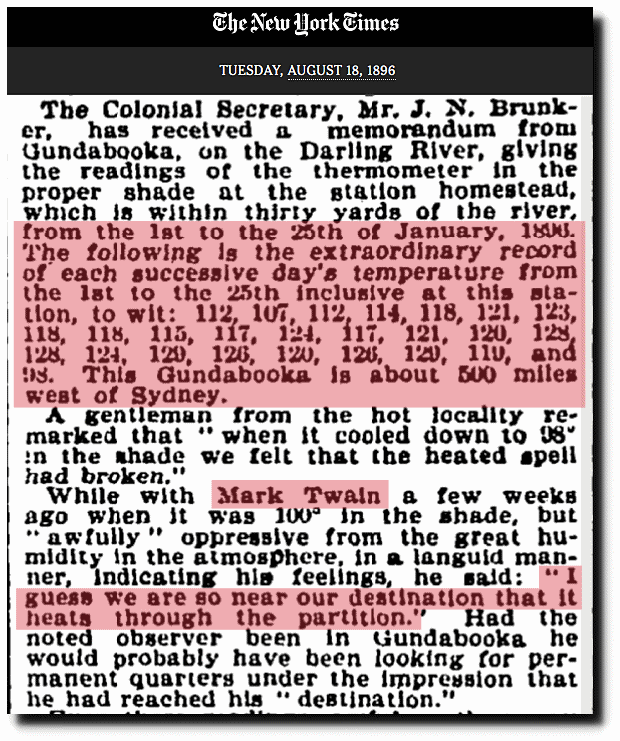
TimesMachine: August 18, 1896 – NYTimes.com
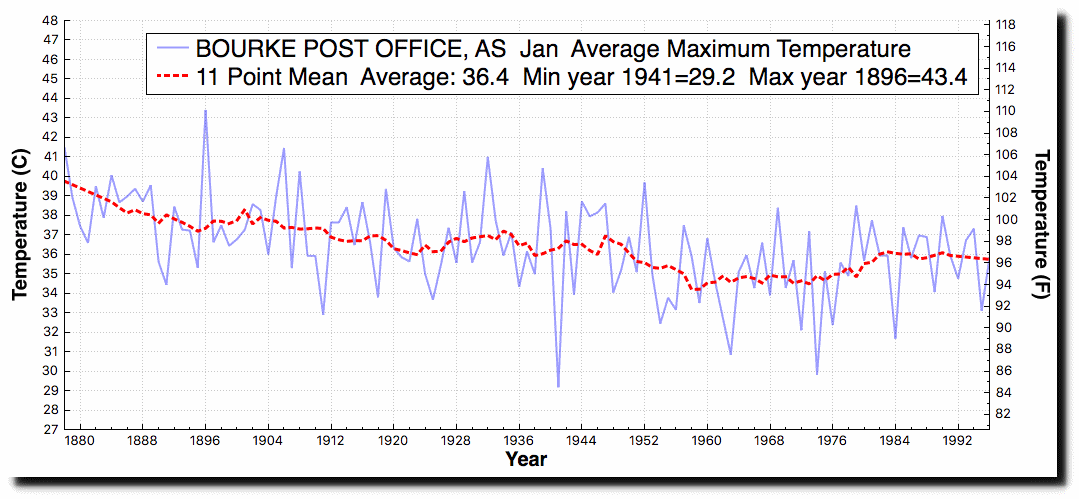
Summers in Australia used to be much hotter. There is no indication of a step change at Bourke correlating to a change in stand type. There is no justification for throwing out pre-1910 temperatures.
But the story gets worse. BOM is more than happy to use garbage UHI afflicted thermometers like this one in Melbourne, which probably report 3-5C too high.
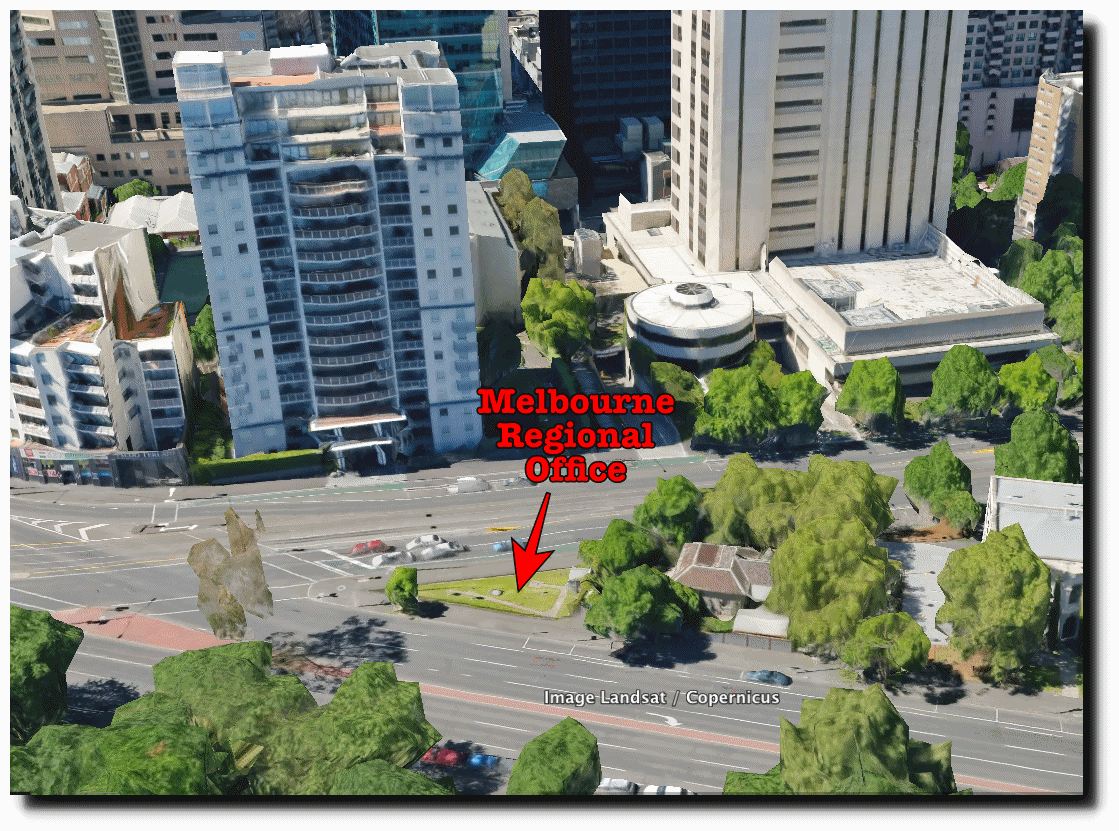
Global warming is the biggest scam in science history, and government agencies use every excuse in the book to hide inconvenient data.
Last week, NCAR said spring is coming earlier to the mountains.
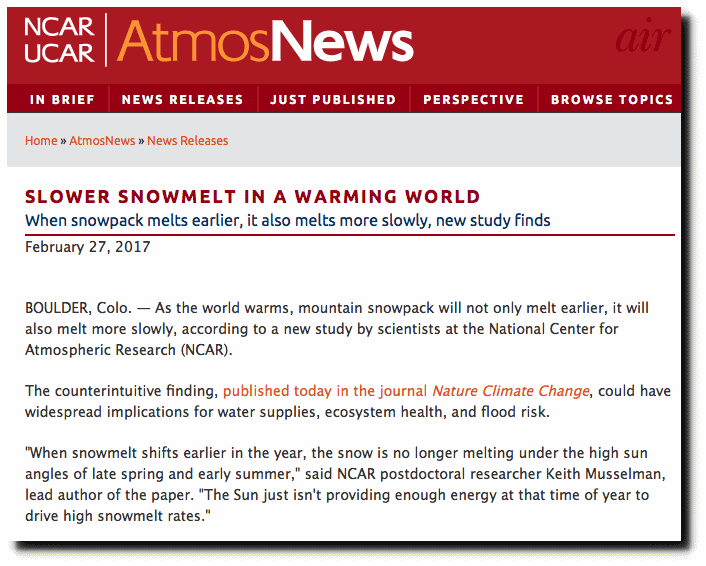
Slower snowmelt in a warming world | UCAR – University Corporation for Atmospheric Research
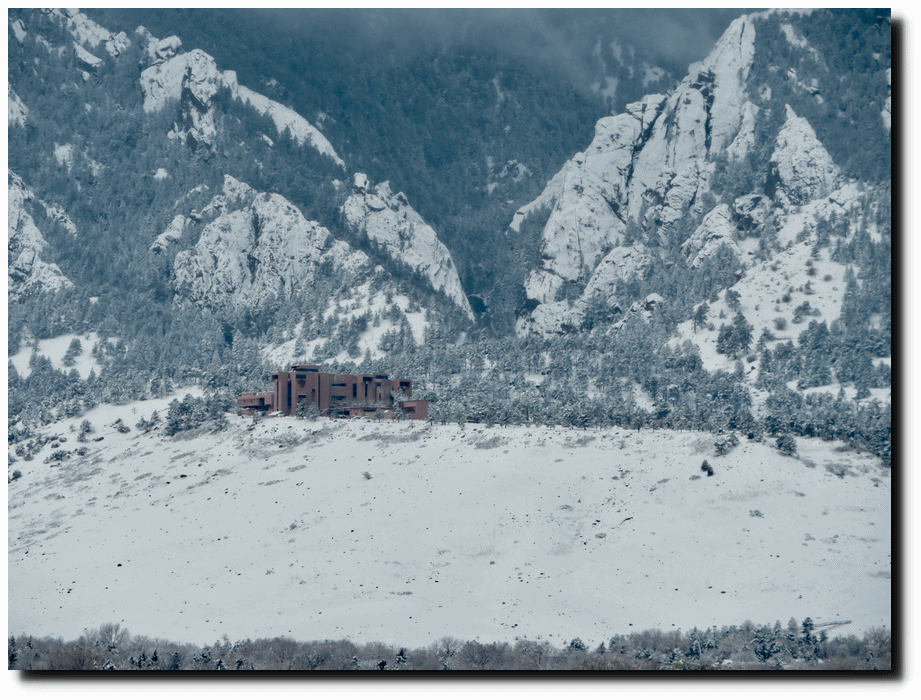
This is what NCAR looked like yesterday.
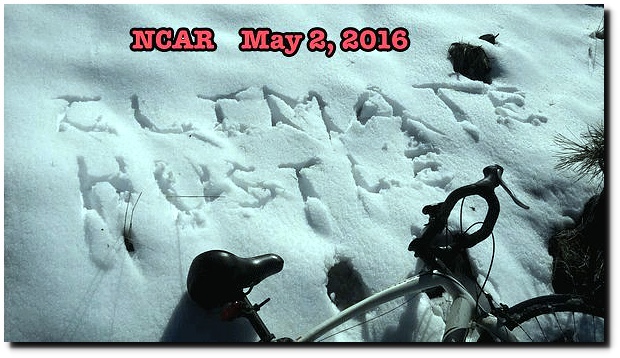
I took this picture at NCAR on May 2 last year.
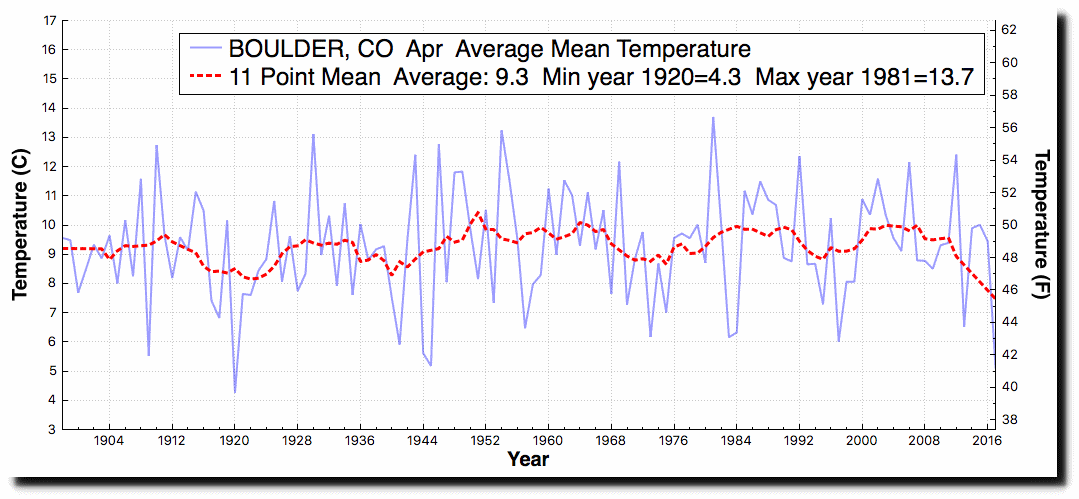
There is no indication that April temperatures are increasing in Boulder, where 1981 was the warmest year.
Snowpack is above normal across almost the entire west. California has double their normal snowpack.
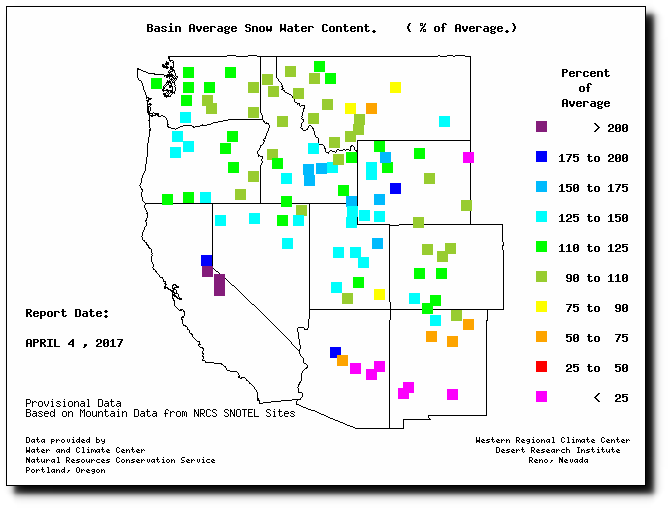
Basin Snow Water Content Map (SNOTEL)
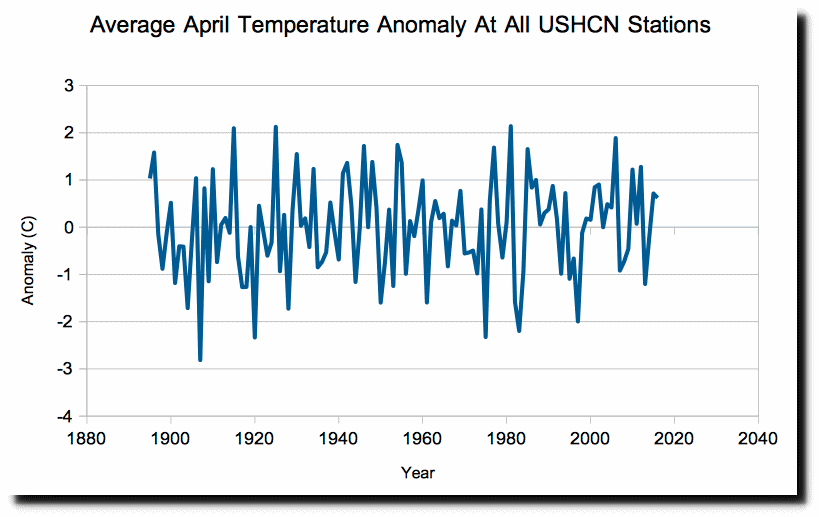
There is no indication that April temperatures are increasing in the US. The three warmest Aprils were 1981, 1925 and 1915. None of the last eight Aprils have been in the top ten.
As always, climate scientists are simply making stuff up in order to bring funding in.
NOAA has a network of 1200 temperature stations around the US, known as USHCN (United States Historical Climatology Network) The measured temperature data shows that US temperatures peaked in the 1930s, and have generally declined since then. But NOAA does not report the measured data to the public, rather they report fake “adjusted” data which shows a lot of warming.
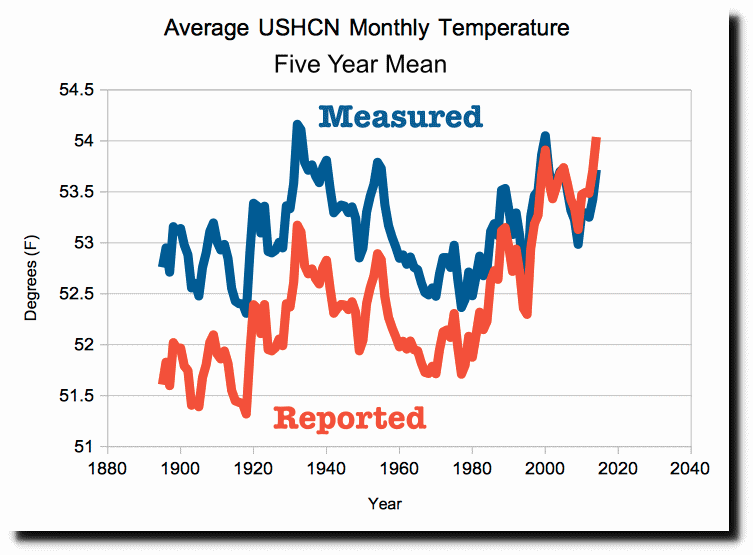
The adjustments create a hockey stick of warming, which accounts for essentially all claimed warming in the US temperature record.
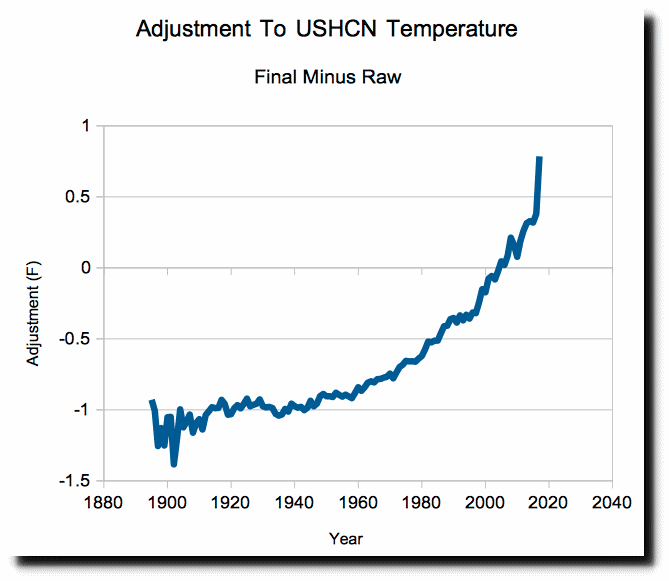
NOAA has been rapidly losing temperature data, and now less than 50% of the stations report each month. When this happens, NOAA simply makes up fake temperatures for that station, which allows them to generate any result they want.
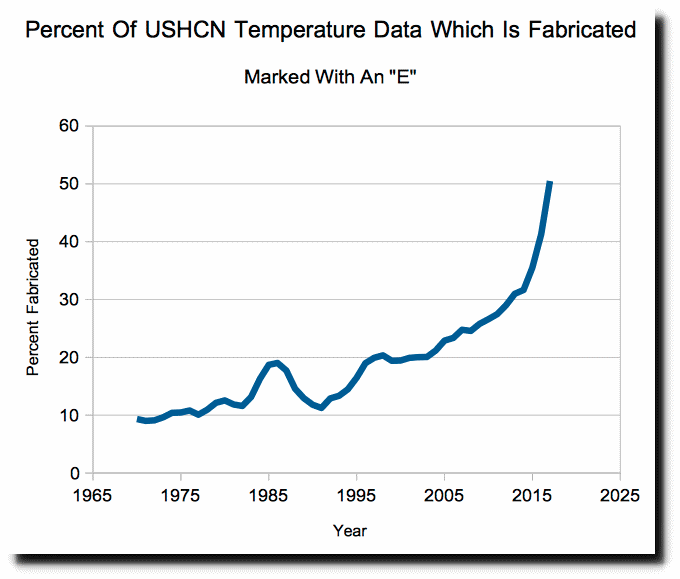
Climate scientists and modelers use this fake data as the basis of their fake models and fake research, and in turn generate fake scientific reports and verify them with fake peer-review. This fake research then becomes the basis for fake government policy and fake journalism.
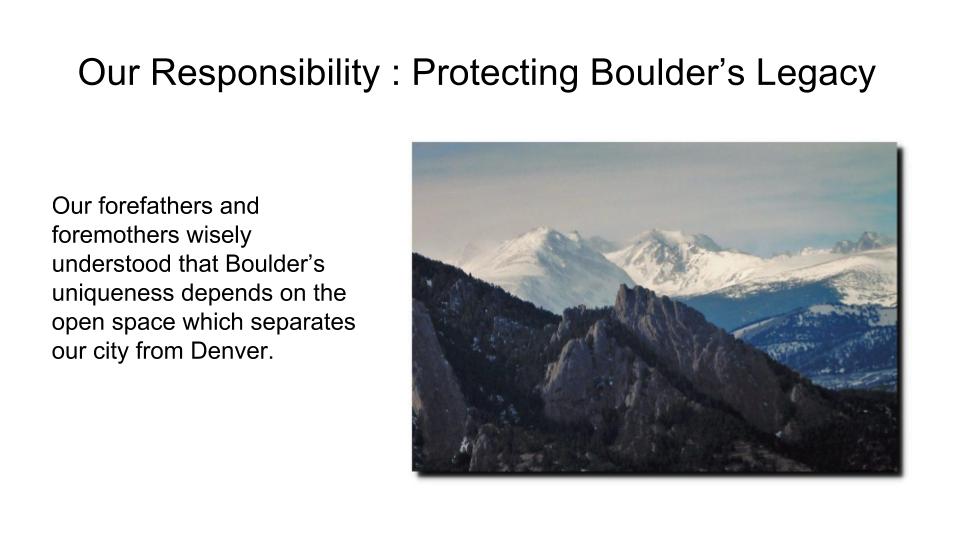
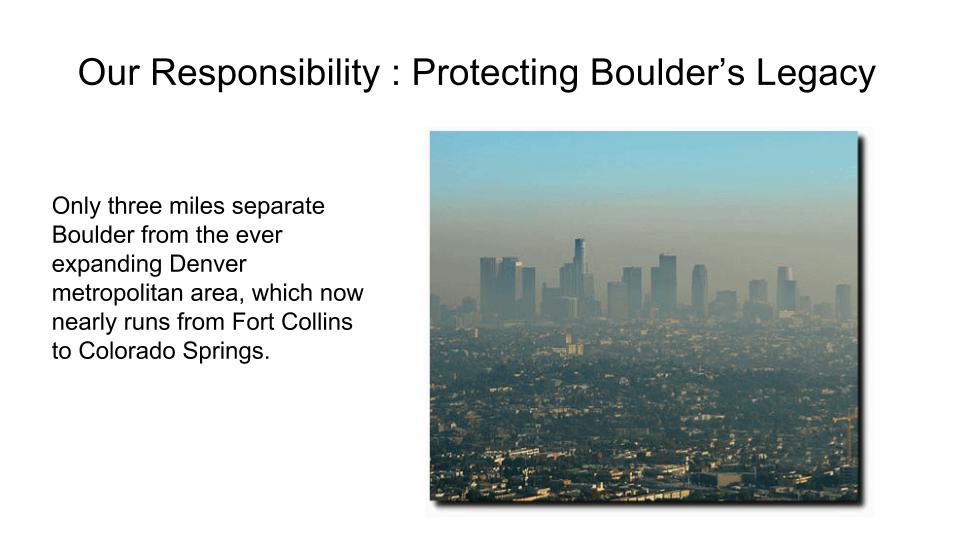
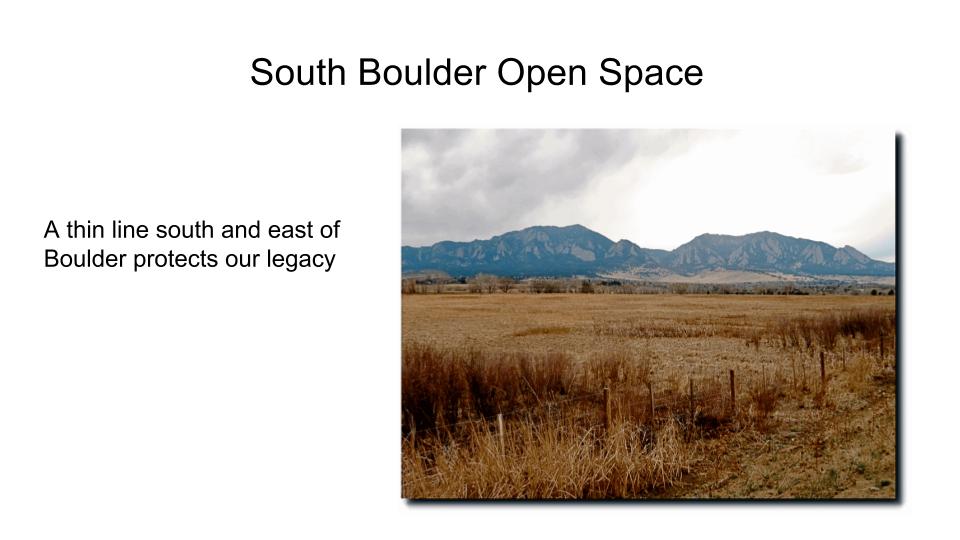
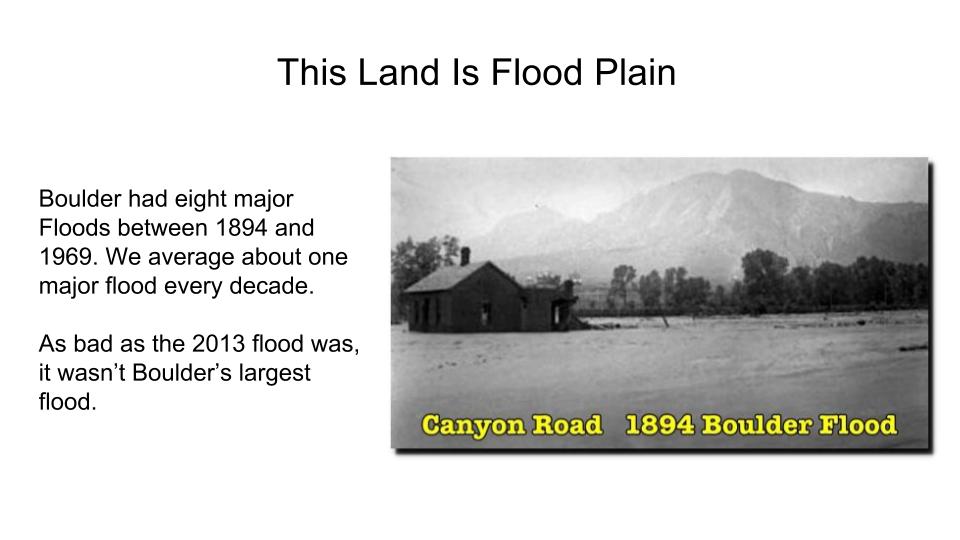
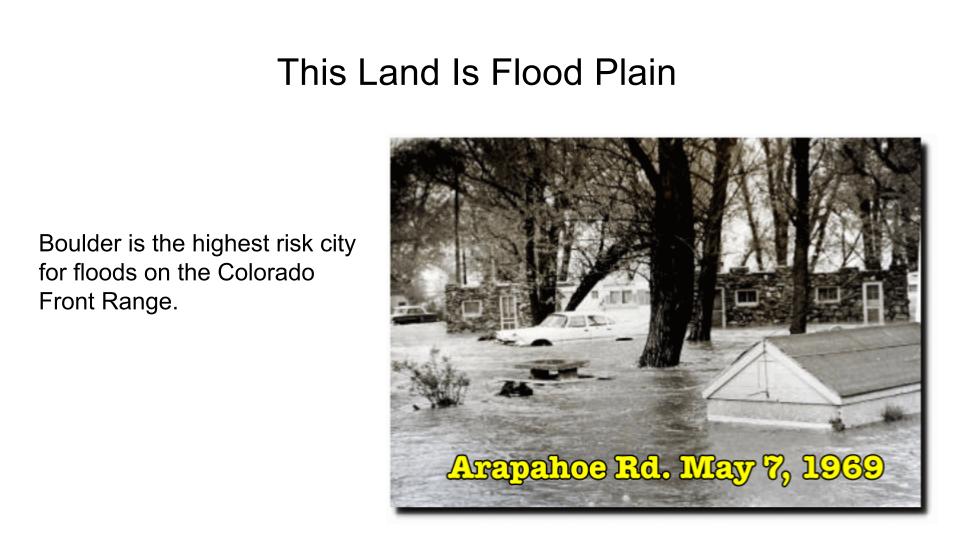
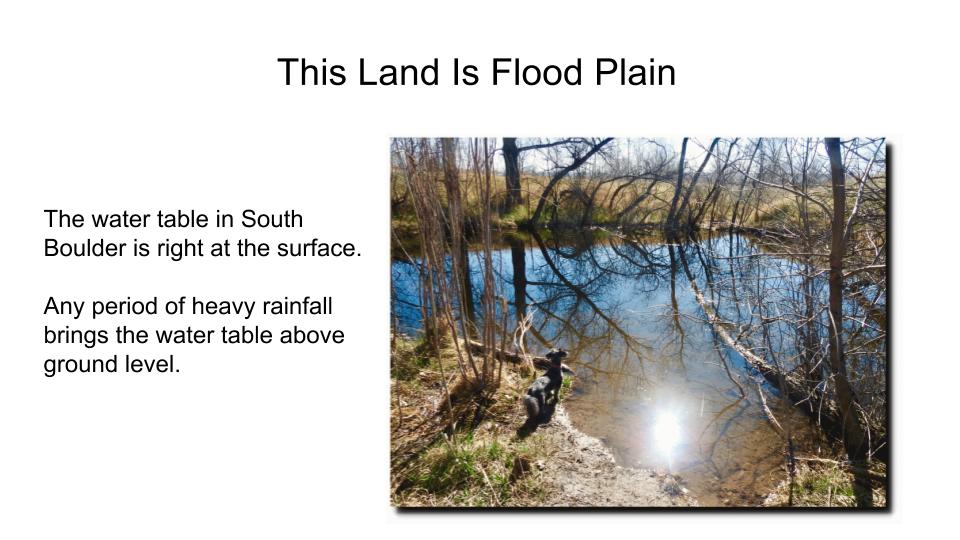
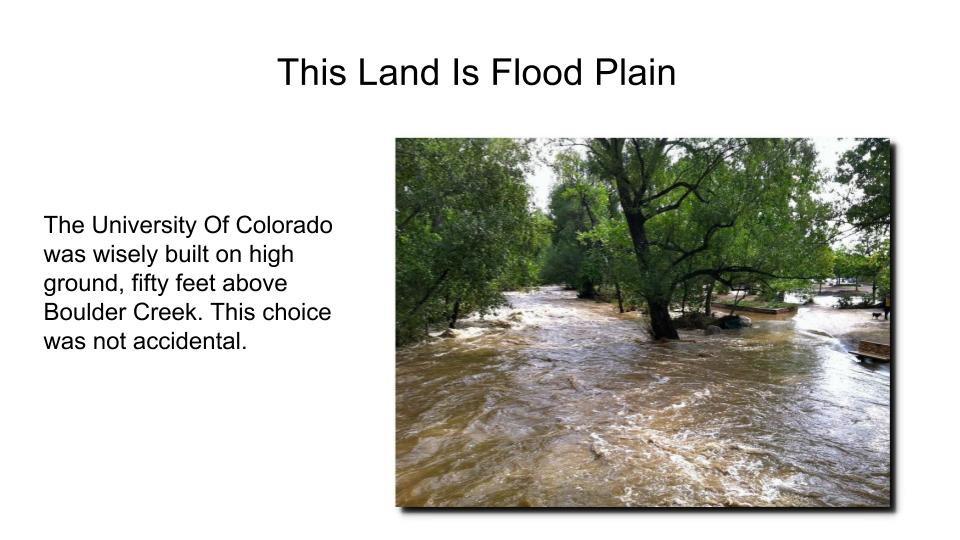
The City of Boulder and the University of Colorado want to develop some of the last open space separating the city from Denver. This is some of the most heavily used recreational land around the city, which gets more than 1,000 hikers, bikers, bird watchers, dog walkers and runners every day. It is located in flood plain, and the water table is literally right at the surface of the ground. These wetlands are key habitat for several rare species.
I have been visiting Boulder for almost 60 years, and living here on and off for almost 25 years. Protecting this open space and wildlife habitat was always a key value of the community. Unfortunately the city council has been taken over by developers – who don’t share the values of the community.

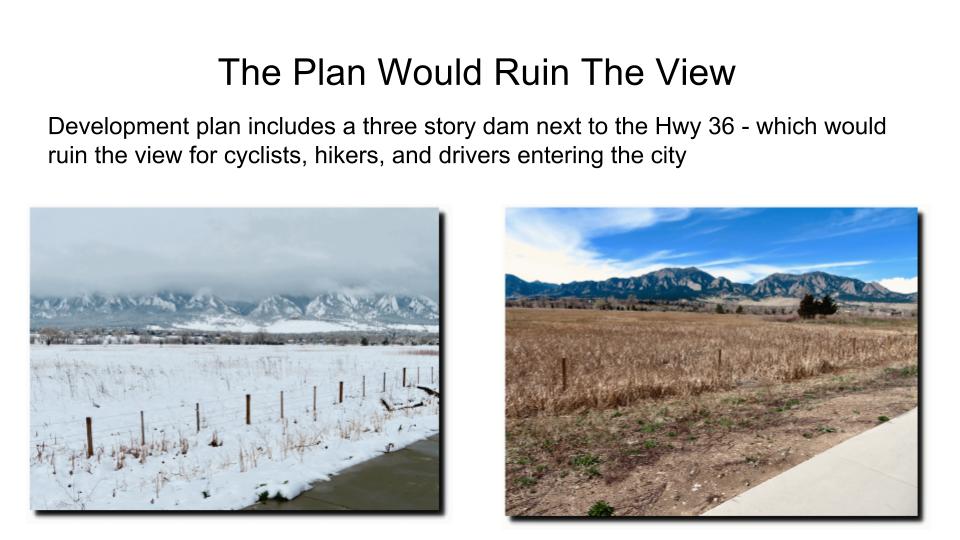
Boulder has an incredibly clean coal/natural gas power plant which provides 100% reliable electricity 24 hours a day, 365 days a year. It is so clean and unobtrusive that most residents are not even aware of its existence.
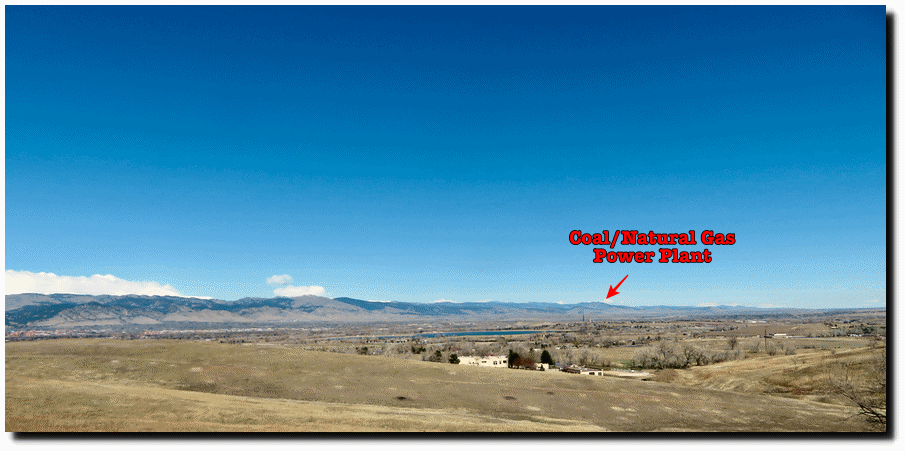
But the City of Boulder has been brainwashed into believing that somehow this clean energy is dirty, and wants to become the first city to run 100% off environmentally destructive energy forms like wind power.
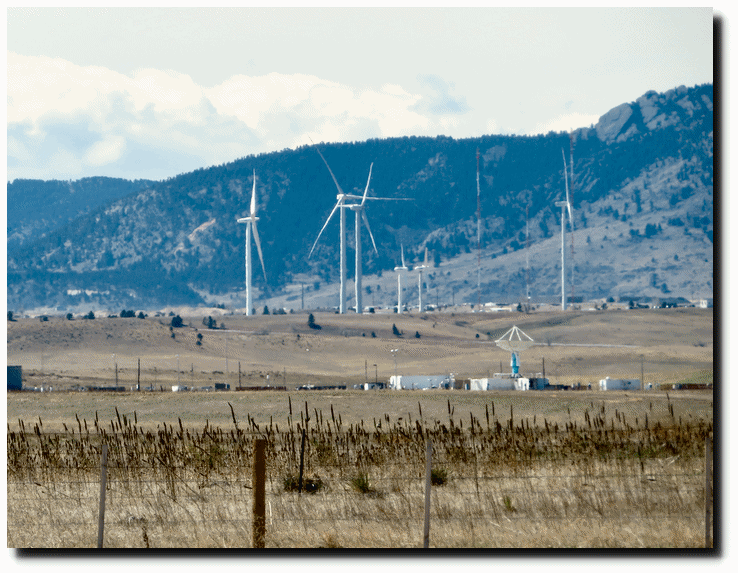
NREL wind turbines just south of Boulder
I attended a meeting of the Boulder Clean Power Plan at CU last year. They bragged that less than 200 wind turbines could power the city on a windy day.

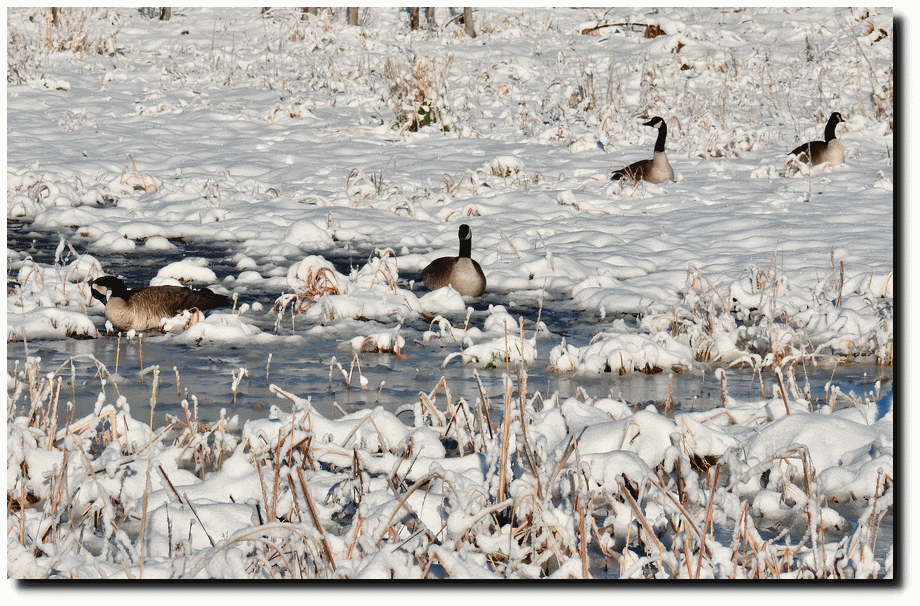
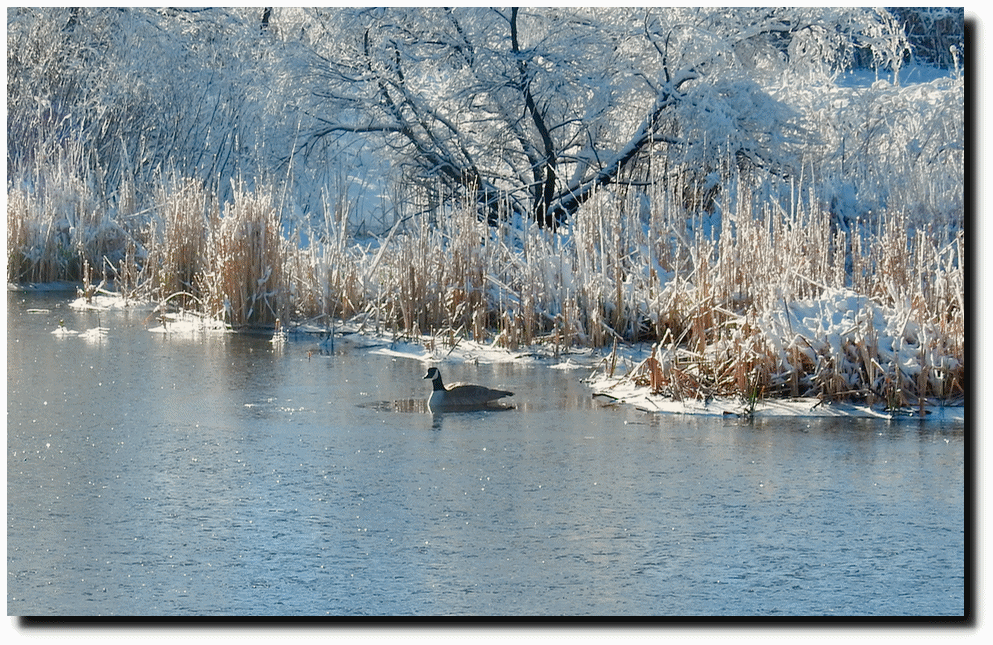
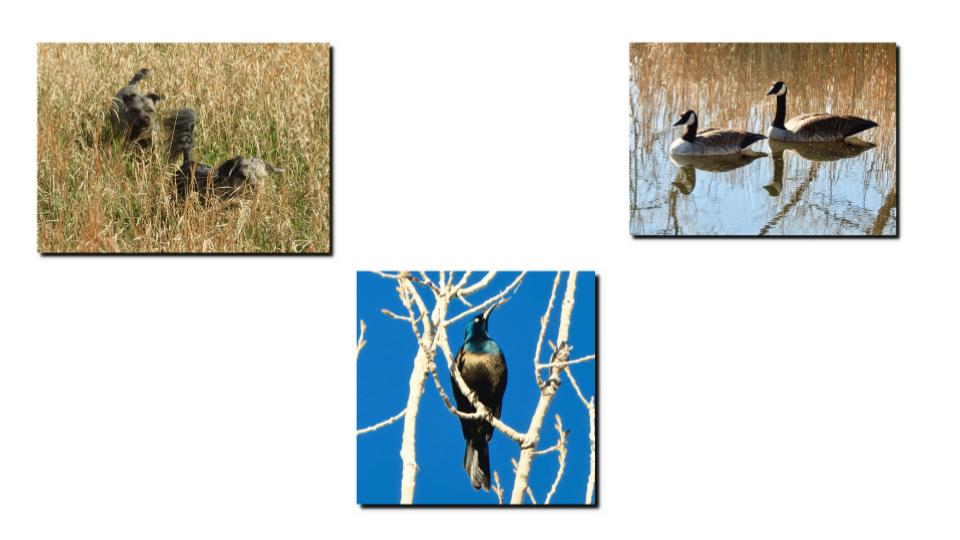
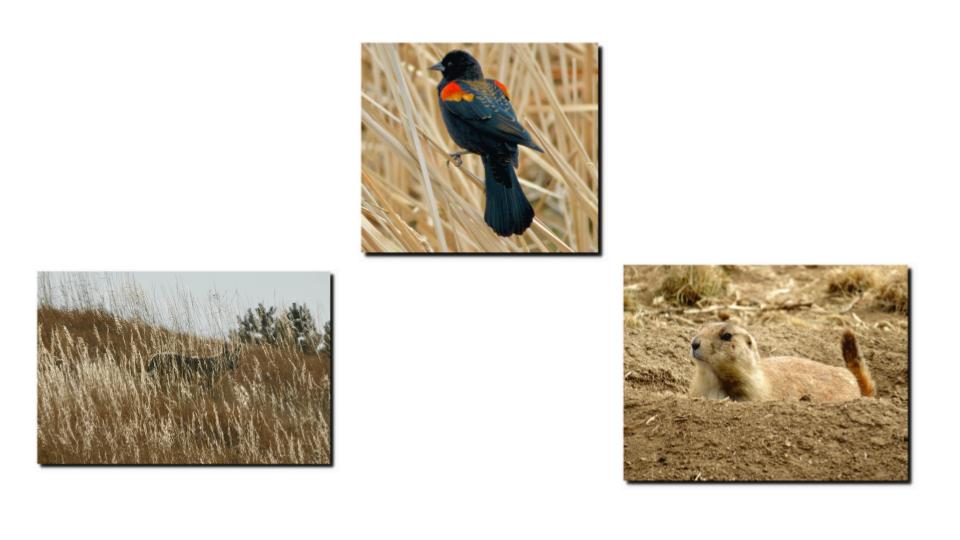
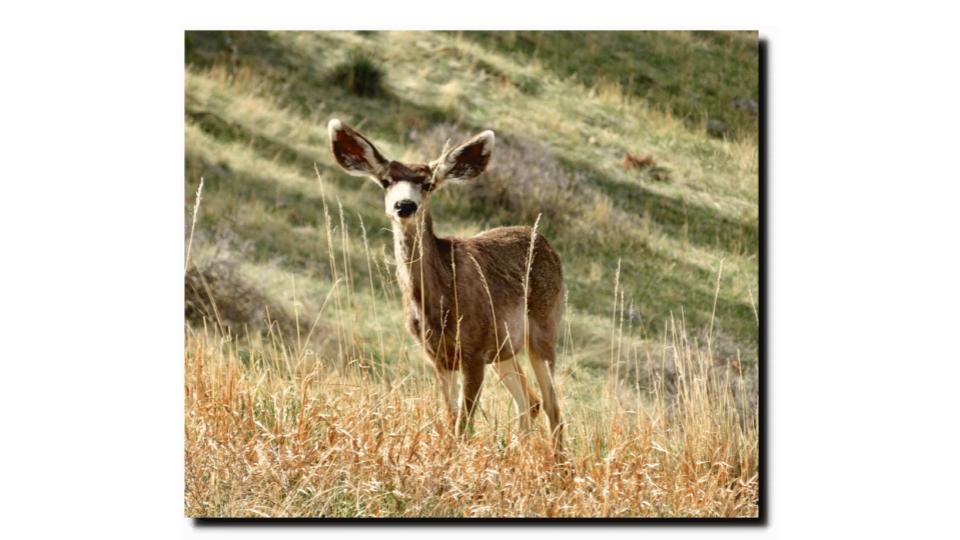
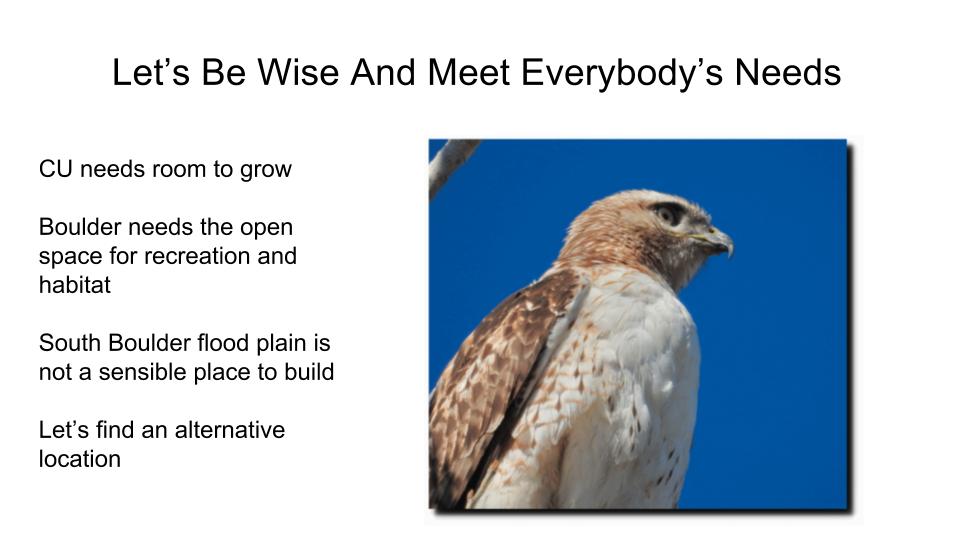
I spend much of my time photographing birds in the South Boulder open space, like this one I took yesterday. These birds would be decimated by 200 wind turbines.

[Empty space for the City of Boulder to insert NIMBY (Not In My Backyard) wind turbine rhetoric]
We get some very windy days in Boulder, but even in the springtime we have more days that are dead calm. The wind turbines would be completely useless much of the time, and the city will need to find other forms of electricity. Nothing will destroy a modern city faster than unreliable utilities.
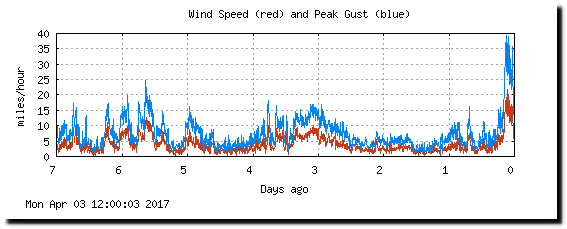
NCAR Foothills Lab Weather (english, weekly)
Temperatures in Boulder peaked 65 years ago. There is zero evidence supporting the idea that CO2 has affected Boulder’s climate.

There is also zero evidence that either Boulder or the United States has any control of global CO2 emissions. US emissions have been declining for several years due to fracking, while China’s CO2 emissions are skyrocketing.
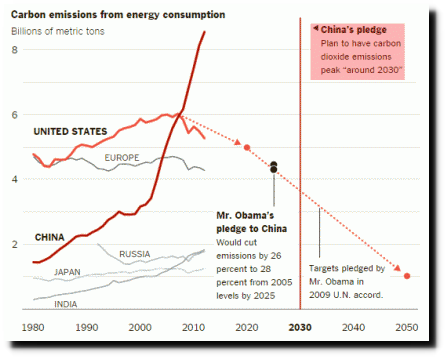
Climate Goals Pledged by China and the U.S. – The New York Times
Under the deal which China made with Obama, China’s emissions will continue to grow for another 13 years.
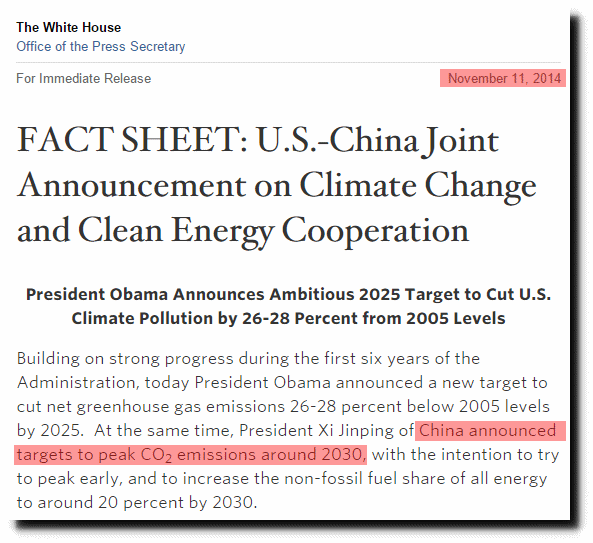
Boulder’s tiny contribution to the global CO2 balance would be like putting a dollar into a joint bank account, where another co-owner is stealing millions.
This is awful, but the Boulder Municipal Power Plan story gets much uglier. The second half of this very dark anti-environmental story will be revealed soon.