Disrupting the Borg is expensive and time consuming!
Google Search
-
Recent Posts
- On The Road Again
- Vandalism At The Reflecting Pool
- Fifty Years Ago Today
- Truth Or Consequences
- US Climate Trend Maps
- Declining Spring Snow Cover In Northern New Mexico
- You Can’t Fool Mother Nature
- Cattle And The Climate
- One Atomic Bomb Per Hour
- New Video : Analyzing Oil And Gas
- Is Antarctica Melting?
- High Speed Analysis And Visualization
- El Nino To The Rescue?
- Fake News Update
- Growth Of Antarctic Sea Ice
- 65 Years Of Progress!
- El Nino To The Rescue?
- Worst March Drought On Record
- ChartGL Process Control Demo
- The Biggest Money Laundering Scam
- Drought In The Headwaters Of Lake Powell
- Unrealistic Expectations Of Water Availability
- Did Bill Gates Do This?
- Worst March Drought On Record In The US
- The Real Hockey Stick Graph
Recent Comments
- arn on On The Road Again
- Bob G on On The Road Again
- Gordon Vigurs on On The Road Again
- Bob G on On The Road Again
- Gordon Vigurs on On The Road Again
- Bob G on On The Road Again
International Women’s Day : Celebrating Four Years Without This Woman
Posted in Uncategorized
Leave a comment
Six Years Into The Southwest Permanent Drought
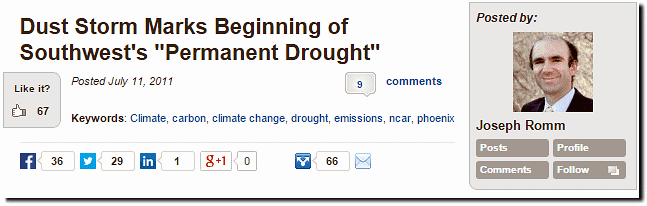
Six years ago, Joe Romm announced the southwest permanent drought.
Dust Storm Marks Beginning of Southwest’s “Permanent Drought”
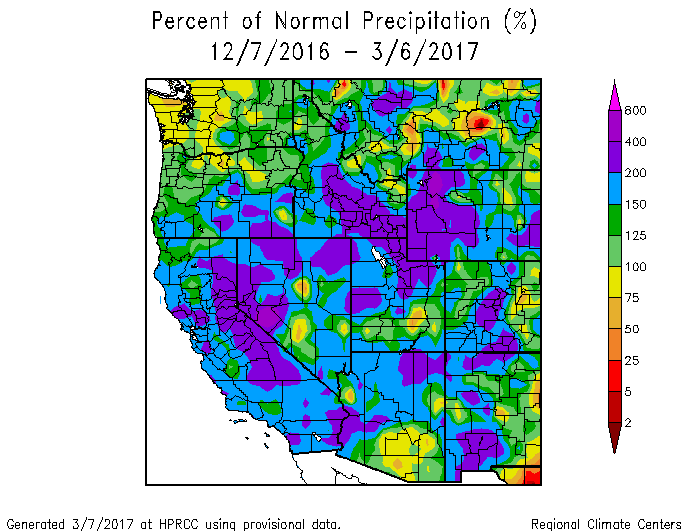
This has been one of the wettest winters on record in the west.
Posted in Uncategorized
Leave a comment
NASA Temperature Graphs Are Fake News
Who controls the past controls the future. Who controls the present controls the past.
- George Orwell 1984
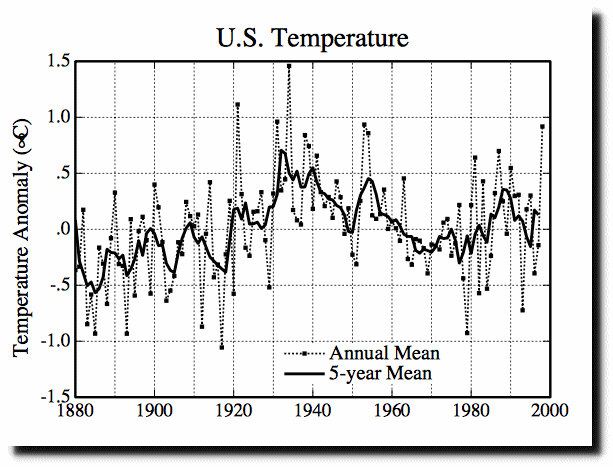
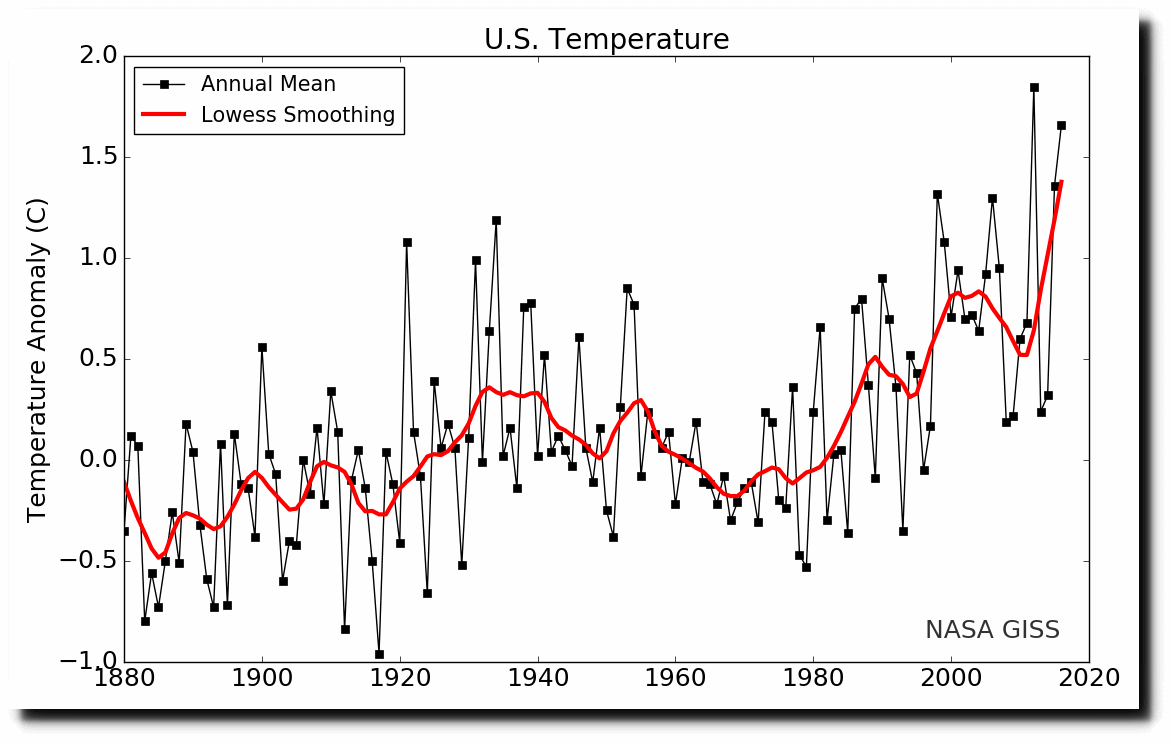
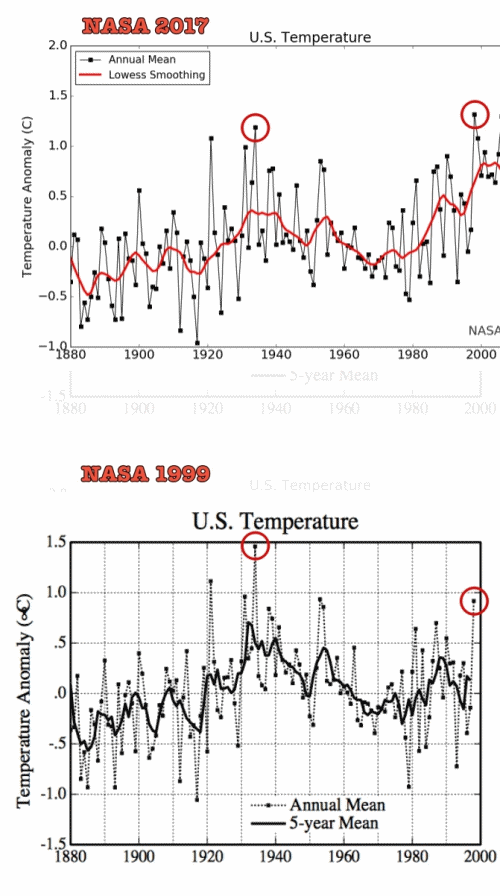
In 1999, NASA showed the US cooling from 1930 to 1998.
https://pubs.giss.nasa.gov/docs/1999/1999_Hansen_ha03200f.pdf
That didn’t suit their funding needs, so they changed the 1930-1998 cooling into warming.
https://data.giss.nasa.gov/gistemp/graphs/graph_data/U.S._Temperature/graph.png
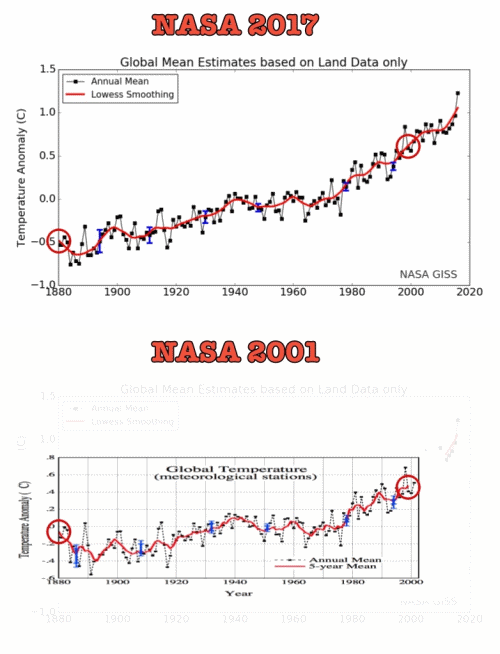
The animation below shows how they tampered with the data.
NASA also doubled 1880-2000 warming by tampering wth the data.
It is time to get rid of NASA’s fake climate program, and restore the past.
Posted in Uncategorized
Leave a comment
The Press Has Been Overwhelmingly Dishonest This Year
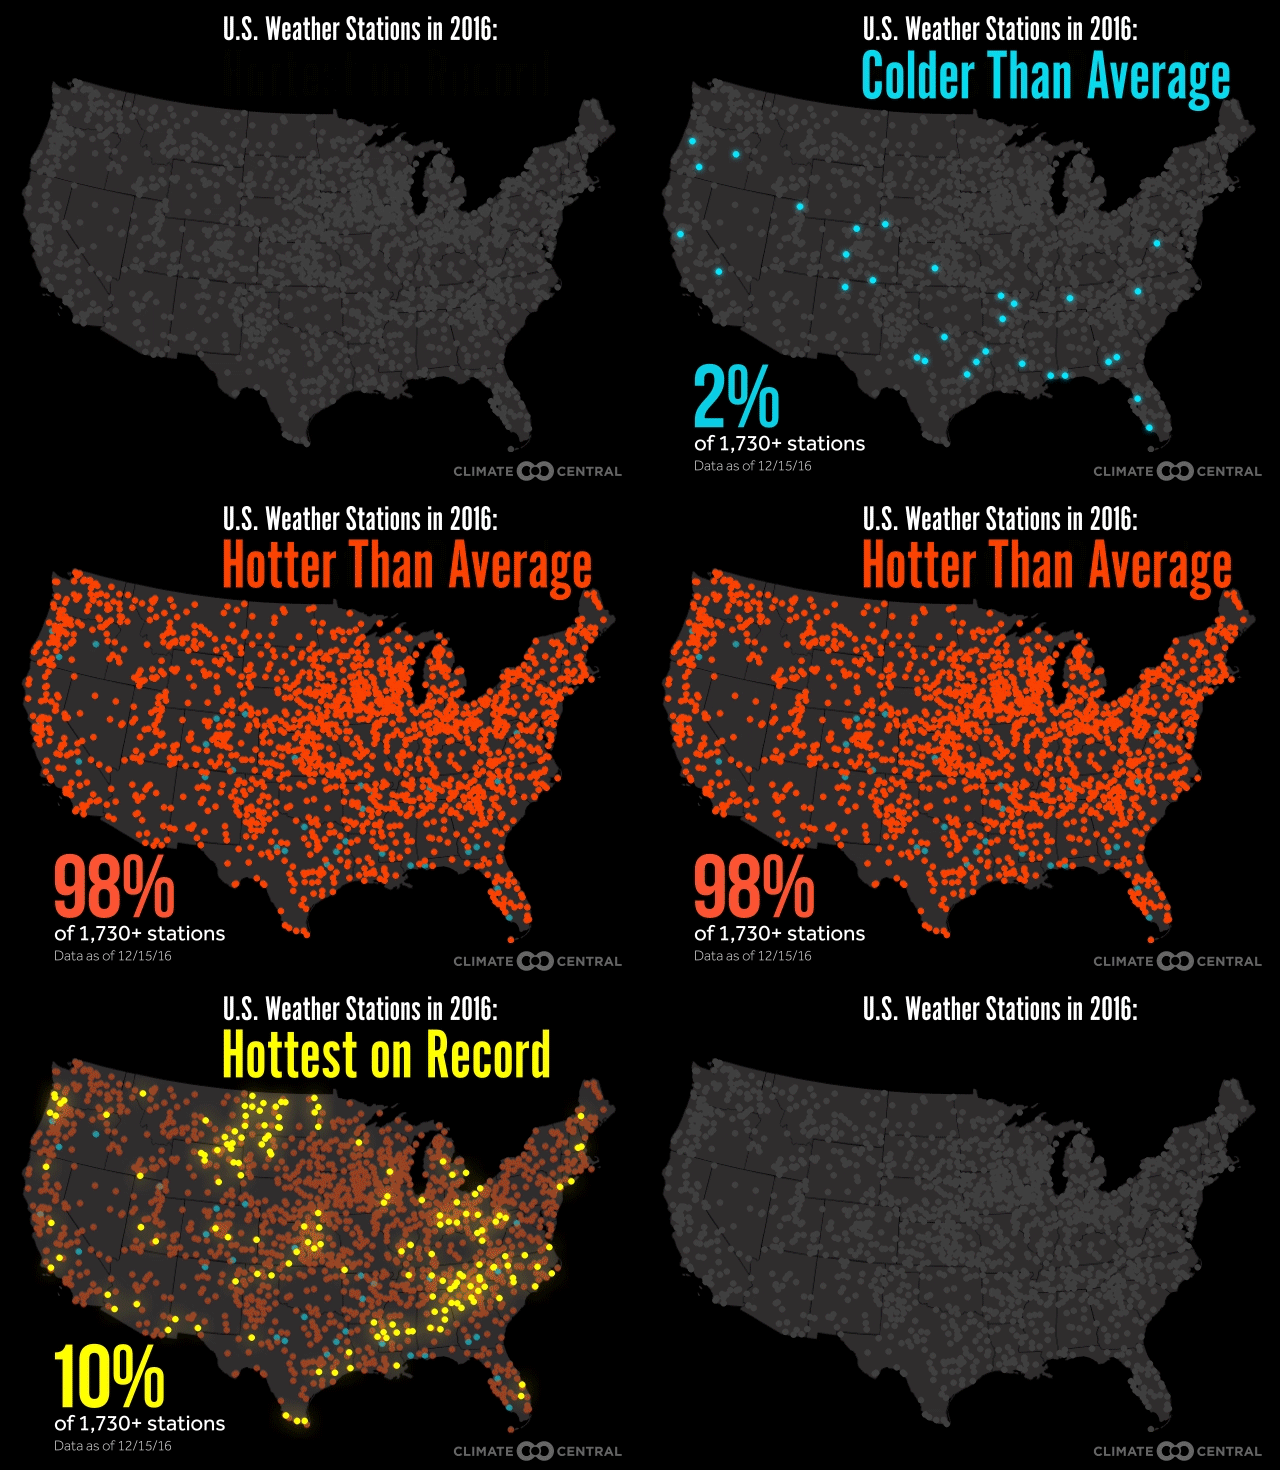
The usual fraudsters at Climate Central claim last year was “overwhelmingly hot” in the US, when in fact it wasn’t a hot year at all.
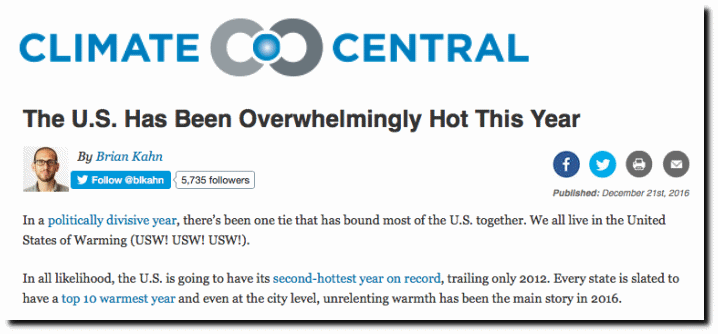
The U.S. Has Been Overwhelmingly Hot This Year | Climate Central
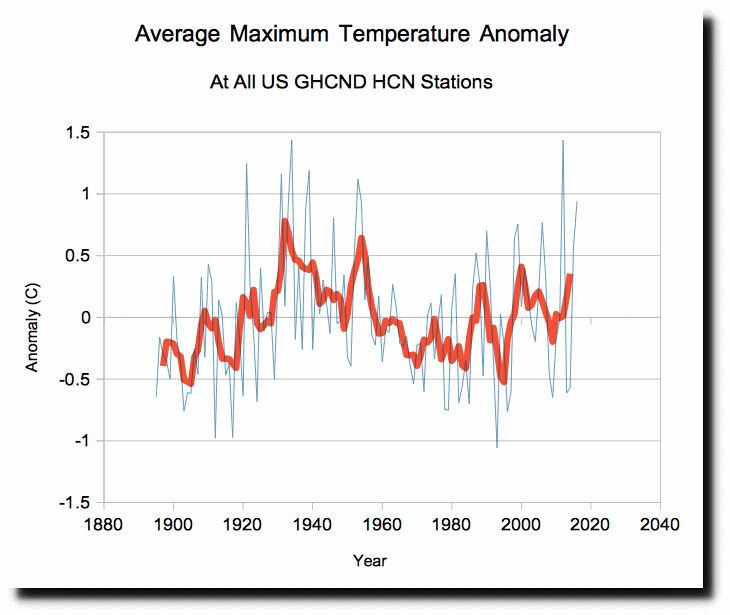
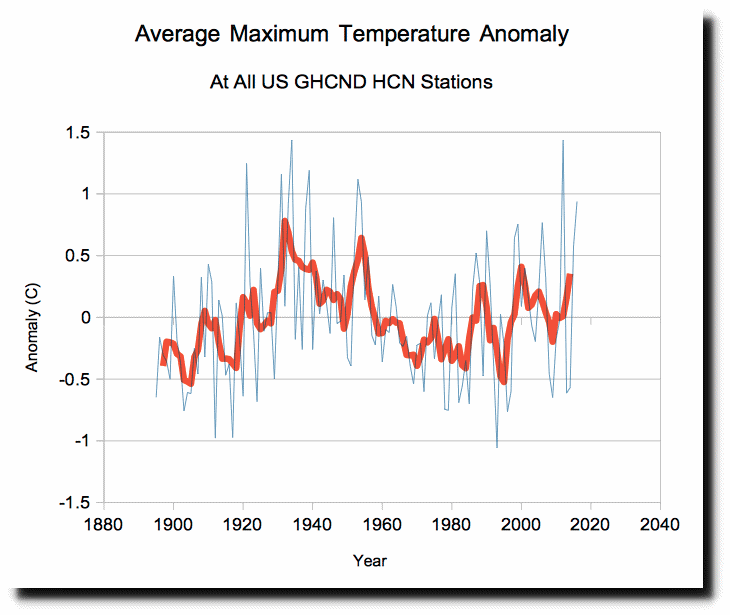
Afternoon temperatures in 2016 averaged seventh warmest since since 1895, but it wasn’t because the weather was hot. It was because the weather was mild during the cold seasons.
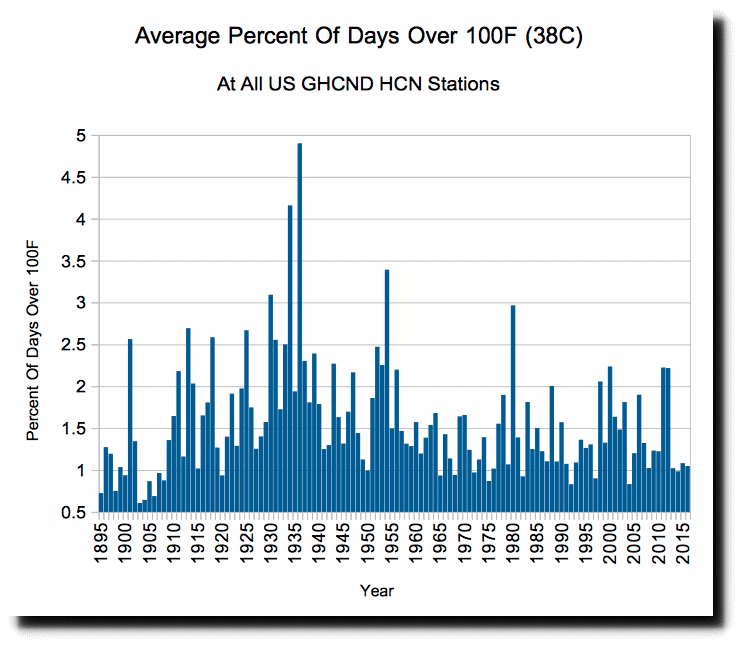
The number of 100 degree days was near a record low. These peaked in 1936.
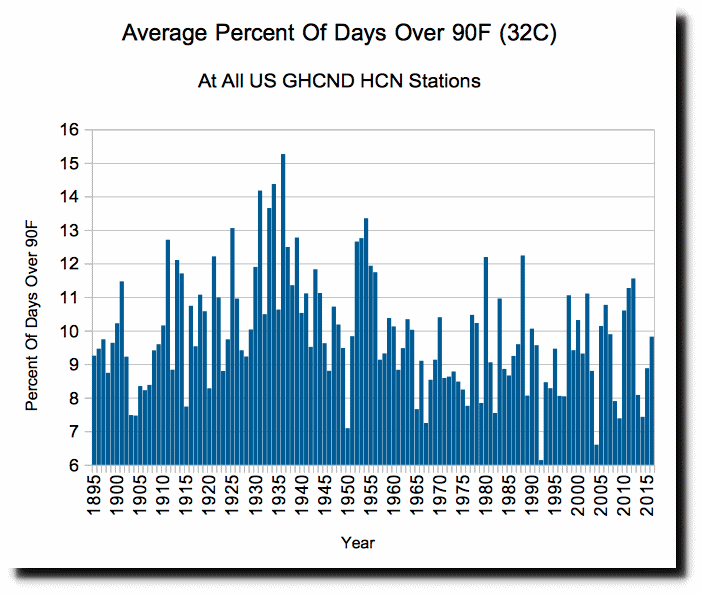
The number of 90 degree days was just below average, and much lower than the 1930’s or 1950’s. These peaked in 1934.
The number of 80 degree days was above average, but below the 1930’s and 1950’s. These peaked in 1939.
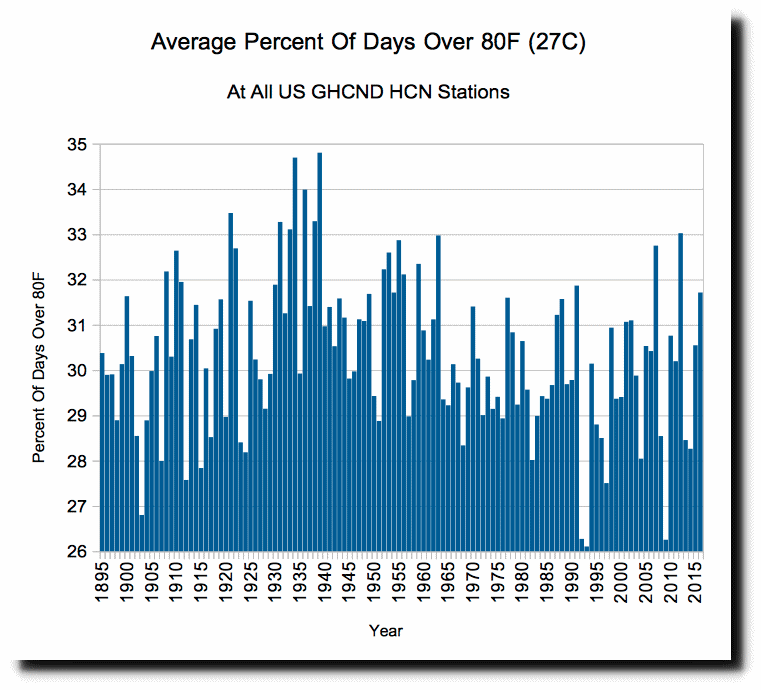
The number of 70 degree days was in the top ten. These peaked in 1934.
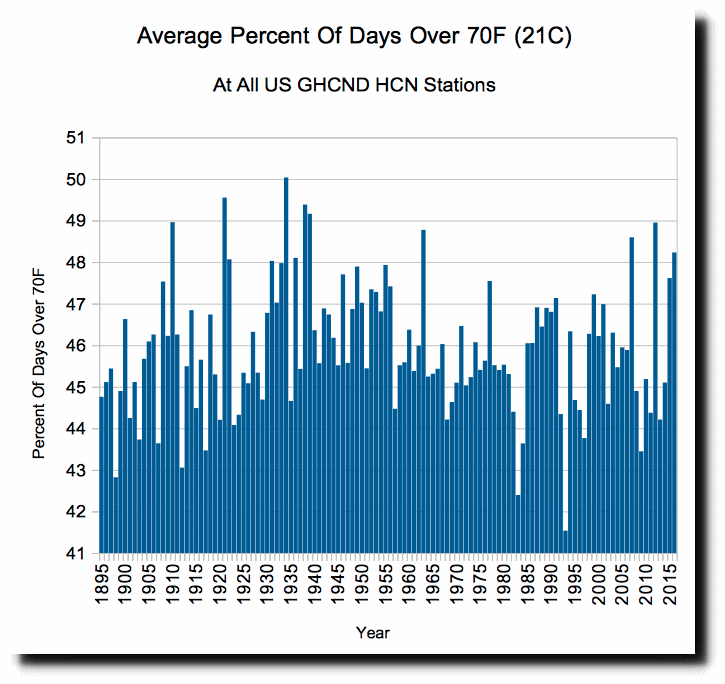
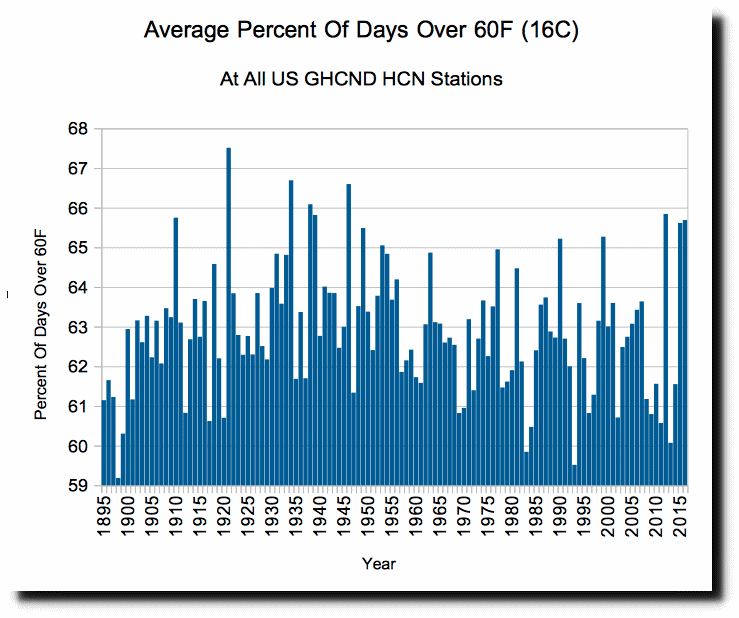
The number of 60 degree days was also in the top ten. These peaked in 1921.
There is no correlation between atmospheric CO2 and maximum temperatures. None at all.
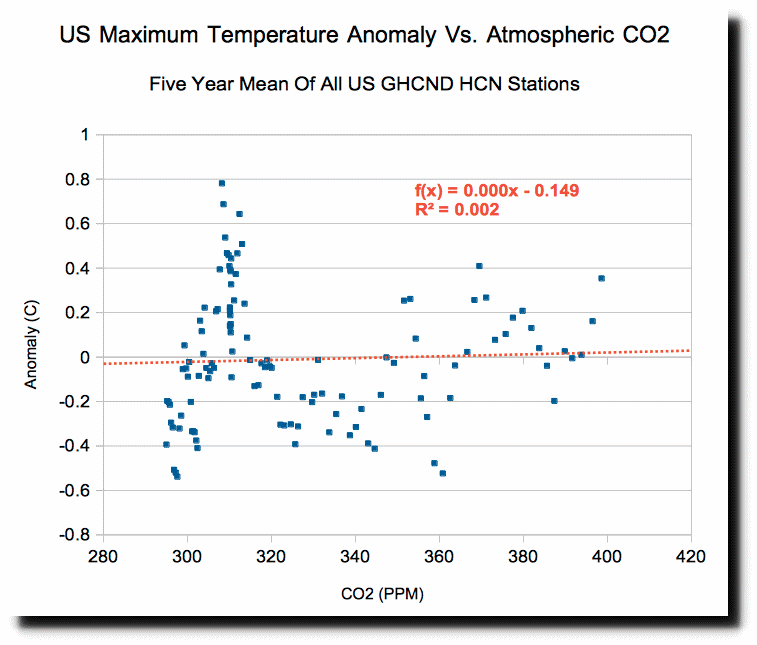
But almost perfect correlation between NOAA data tampering and atmospheric CO2.
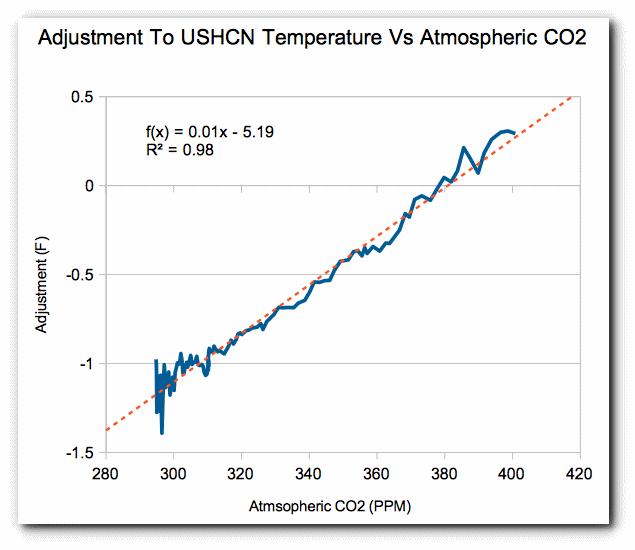
The pattern seen in the graph below is cyclical, not linear. Global warming is the biggest science scam in history. There is no basis to any of their claims. They manipulate data to match their theory. A total fraud from start to finish.
Posted in Uncategorized
Leave a comment
Ronald Reagan : If Fascism Ever Comes To America, It Will Come In The Name Of Liberalism
Posted in Uncategorized
Leave a comment
Just When You Thought Scientists And Journalists Couldn’t Get Any Stupider
Only two things are infinite – the universe and human stupidity. And I’m not sure about the former.
- Albert Einstein
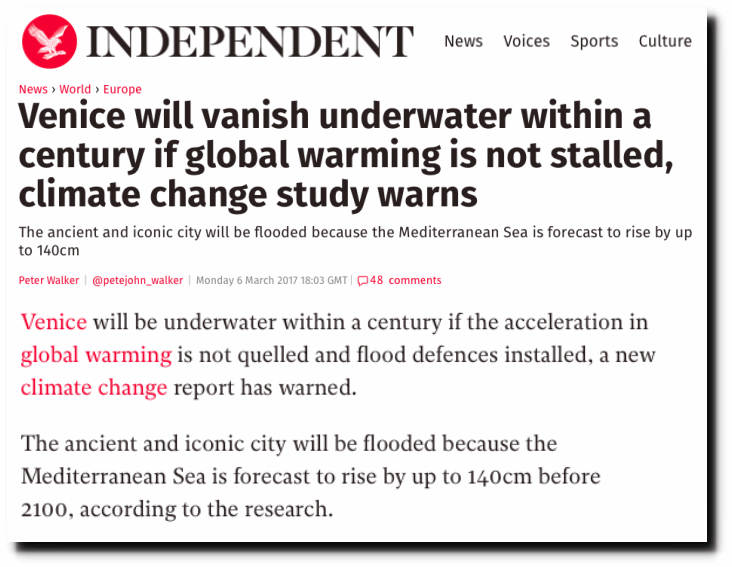
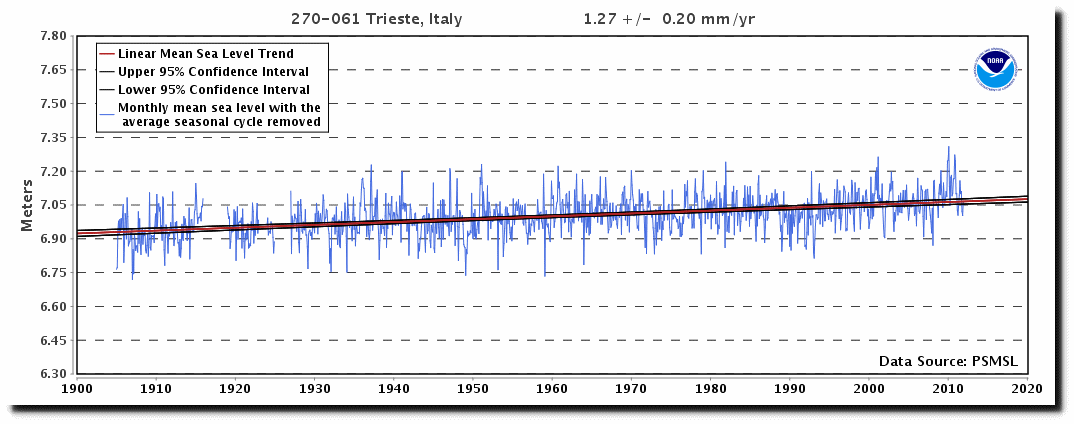
Scientists are testing the limits of stupidity with this study, predicting 140 cm of sea level rise at Venice by 2100.
The closest tide gauge to Venice (50 miles away) shows less than one tenth that much rise over the past century, and no acceleration.
Global Sea Level Trends – Mean Sea Level Trend
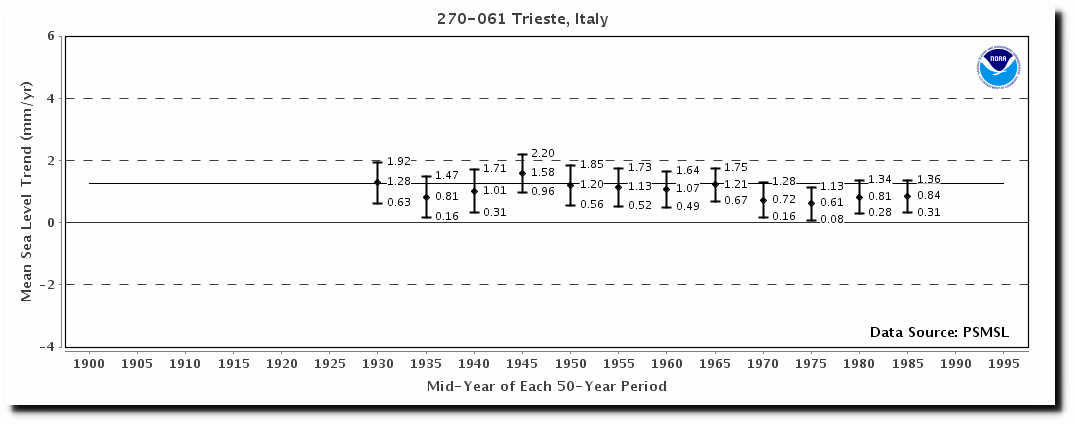
Peak rates of sea level rise near Venice occurred 70 years ago, with a general slowdown of sea level rise since then.
Sea Level Trends – Variation of 50-year Mean Sea Level Trends global station
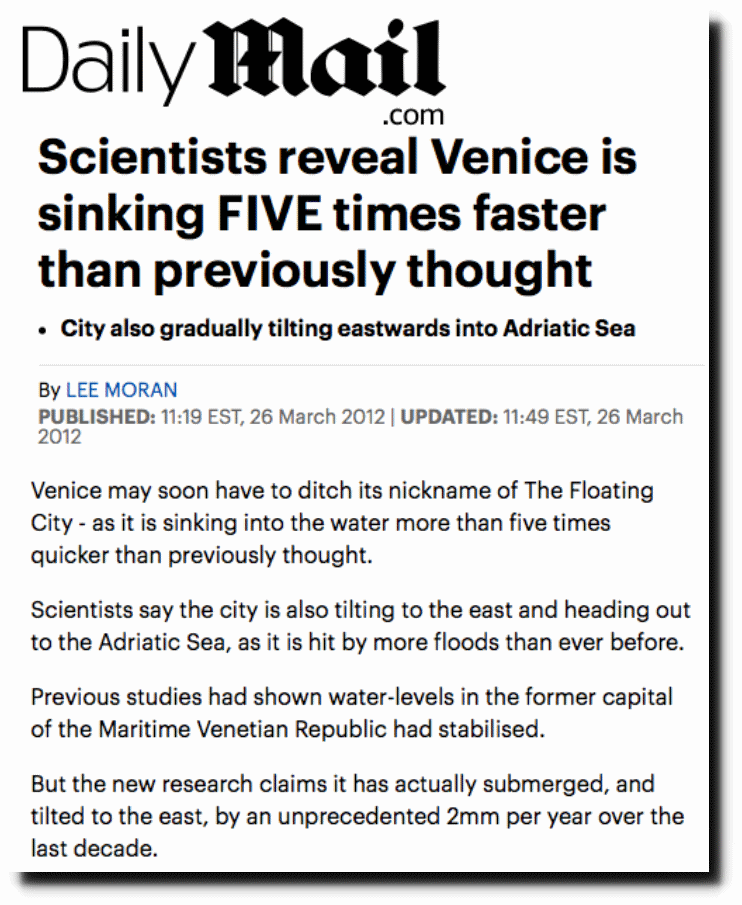
The land at Venice is sinking, and only a complete moron or a climate scientist would believe that a carbon tax or fake climate agreement will stop land from sinking. But I repeat myself.
Venice is sinking FIVE times faster than previously thought | Daily Mail Online
Is it the drugs? Is it the snake oil? What causes progressives to attain such mind-blowing levels of dissonance?
Posted in Uncategorized
Leave a comment
Rino Sighting In Indiana
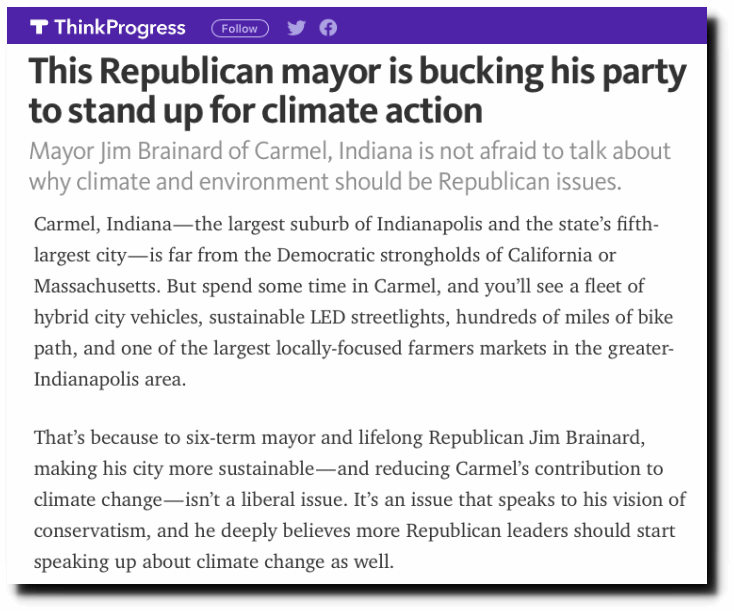
The mayor of Carmel, Indiana wants to stop climate change.
This Republican mayor is bucking his party to stand up for climate action
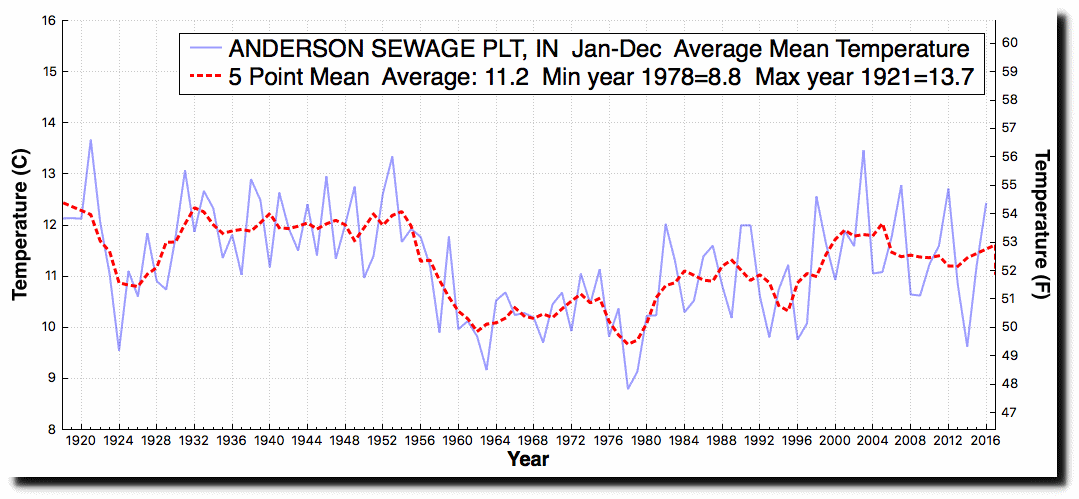
Had he done any actual research, he would have known that the climate of Carmel isn’t changing, or perhaps has gotten slightly better over time.
Indiana has many fewer hot days than they used to prior to 1955.
There is nothing the mayor can do to influence the climate anyway, even if he imagines himself to be a sort of god. King Canute understood this, but modern day politicians aren’t that intelligent.
Posted in Uncategorized
Leave a comment
Another Smoking Gun Of Fraud At NOAA/NASA
Most of the warming NOAA/NASA claim is occurring, is during the Arctic winter.
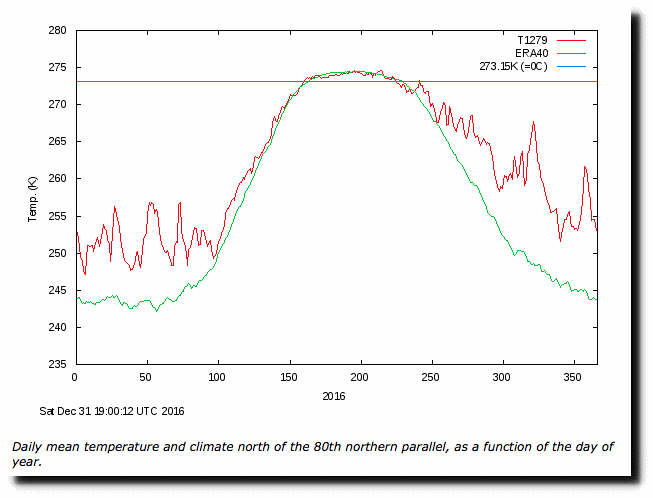
By averaging all temperatures equally, they ignore the fact that there is essentially no latent heat in the Arctic winter. There is little evaporation, melting or freezing of water at -15C, so tiny swings in heat content produce large swings in temperature. By contrast, the Arctic summer and lower latitudes require much larger changes in heat to produce equivalent temperature changes. Note in the graph below how stable temperatures are near the pole in summer. During the summer, huge amounts of heat are required to produce small changes in temperature.
Ocean and Ice Services | Danmarks Meteorologiske Institut
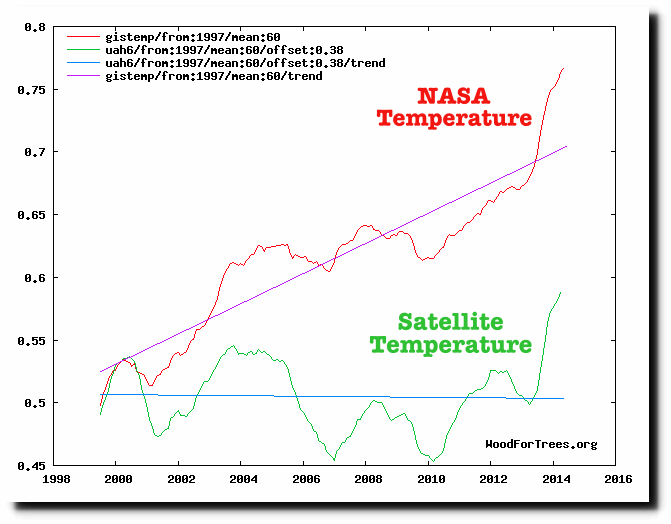
By averaging all temperatures equally, Arctic winter warming massively skews the global surface temperature record to exaggerate warming. This is one primary reason for the massive divergence between accurate satellite temperatures and worthless surface temperatures.
Wood for Trees: Interactive Graphs
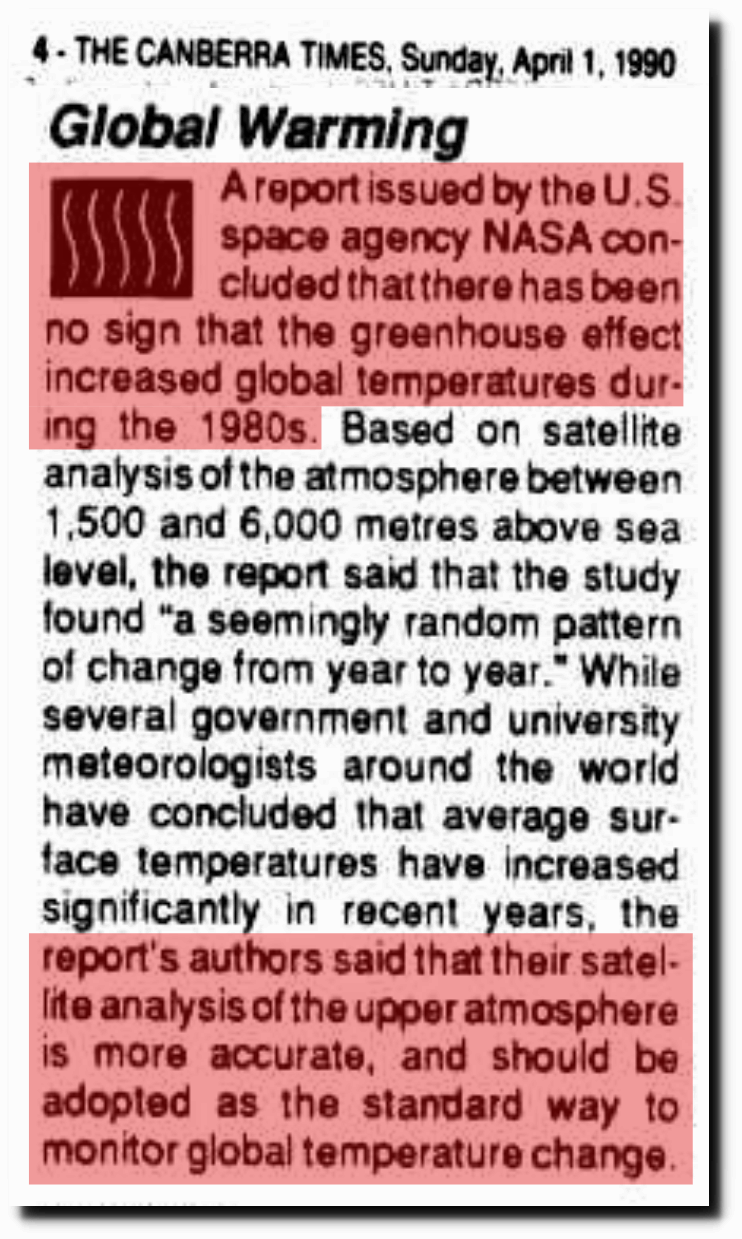
The global surface temperature record is a farce. It needs to be abandoned, as NASA planned to do 27 years ago.
Posted in Uncategorized
Leave a comment