August 12, 1936 – One Of The Hottest Days In US History

On this date 80 years, the entire US was engulfed in a massive heat wave which brought temperatures of 120 degrees to Oklahoma, 119 degrees in Kansas, 115 degrees in Texas, 111 degrees in Nebraska and 110 degrees in Arkansas and South Dakota.

2016-08-12061300

Government experts say that heatwaves are getting worse, even though their own data says the exact opposite.

Screen Shot 2016-08-12 at 6.45.50 AM

Screen Shot 2016-08-12 at 6.44.24 AM

Climate Change Indicators: High and Low Temperatures | Climate Change Indicators in the United States | US EPA

Posted in Uncategorized | Leave a comment

Arctic Melt Season Almost Over

2016-08-12074228

A combination of cold cloudy weather and thick ice limits the possibilities for further melting this summer. It is shaping up to be a total disaster for climate alarmists.

extent_n_running_mean_amsr2_previous (1)

Daily AMSR2 sea ice maps

Two weeks ago, the fraudsters at NASA and the Canadian Government put out this wildly misleading press release.

Screen Shot 2016-08-12 at 3.29.01 AM

Screen Shot 2016-08-12 at 3.32.57 AM

First half of 2016 breaks heat records, Arctic sea ice reaches lowest levels: NASA

The exact opposite is occurring, The amount of old, thick ice has massively increased since experts declared it to be gone seven years ago, and Walt Meier is one of the people who altered the NSIDC maps to reduce the amount of five year old ice.

IceThickness-2012-2016

Meanwhile, the amount of ice in the Antarctic is also growing.

extent_s_running_mean_amsr2_regular

extent_s_running_mean_amsr2_regular.png (1201×962)

Ice is increasing at both poles, and NASA claims it is the hottest year ever.

Posted in Uncategorized | Leave a comment

A Sea Change In The Arctic

I wrote my first climate article nine years ago for The Register. It was about the Arctic. Two things have changed since then.

  1. Winter winds have changed.  Much less ice is being blown out into the North Atlantic during winter.
  2. Persistent summer cloudiness is causing summer melt to be greatly reduced.

The amount of thick multi-year ice has massively increased since it was declared gone by David Barbour seven years ago.  NSIDC tried to hide this by tampering with their maps, but it is becoming obvious now that the Arctic Basin is filling up again with thick ice.

CICE_combine_thick_SM_EN_20160810

DMI Modelled ice thickness

Climate experts know nothing about the climate. They just talk trash for no reason.

Screen Shot 2016-08-11 at 10.21.18 PM

Screen Shot 2016-08-11 at 10.20.04 PM

Multiyear Arctic ice is effectively gone: expert | Reuters

Posted in Uncategorized | Leave a comment

Arctic Pong

Favorable winds have helped the Ship of Fools progress over the last two days by pushing the ice offshore, but they seem to have run into a blockage again and haven’t moved forward for 12 hours.

Screen Shot 2016-08-12 at 3.46.47 AM

Tracking – The Polar Ocean Challenge

Posted in Uncategorized | Leave a comment

Area Of Thick Arctic Ice Has Tripled In Four Years

Since 2012, the area of five foot thick sea ice in the Arctic has more than tripled.

IceThickness-2012-2016

Posted in Uncategorized | Leave a comment

James Hansen – World’s #1 Climate Criminal

NASA’s James Hansen has made a career out lying about climate. Here is a real whopper where he claimed that the blistering heat during 2012 in the US was almost impossible previously.

Screen Shot 2016-08-11 at 7.11.46 AM-down

5 Aug 2012, Page A7 – Asbury Park Press at Newspapers.com

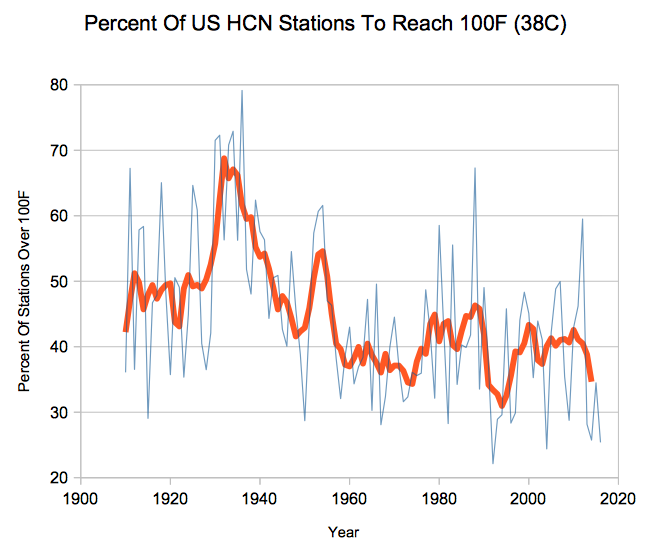
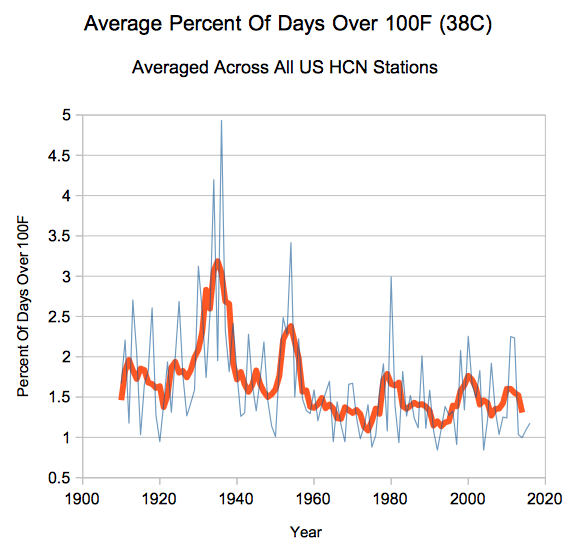
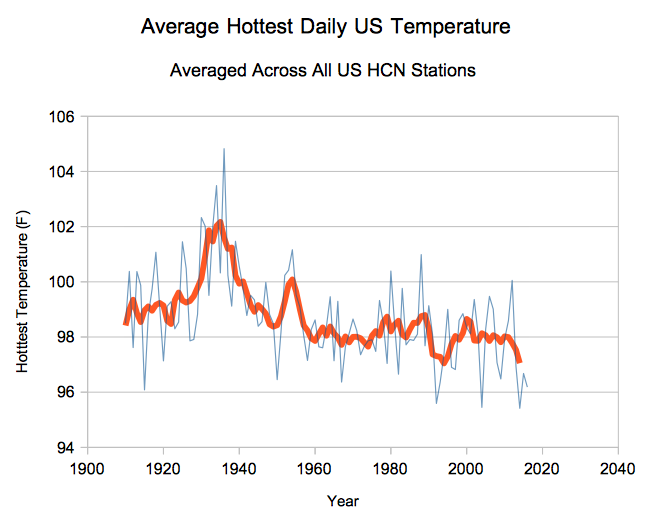
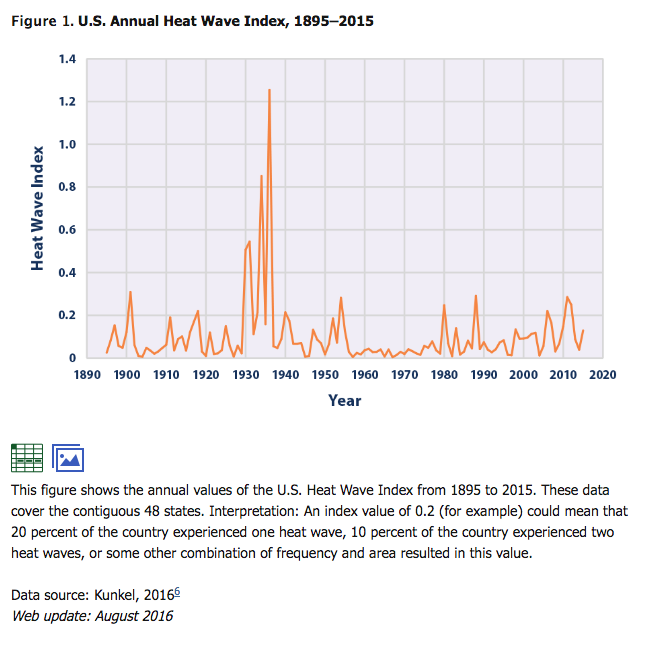
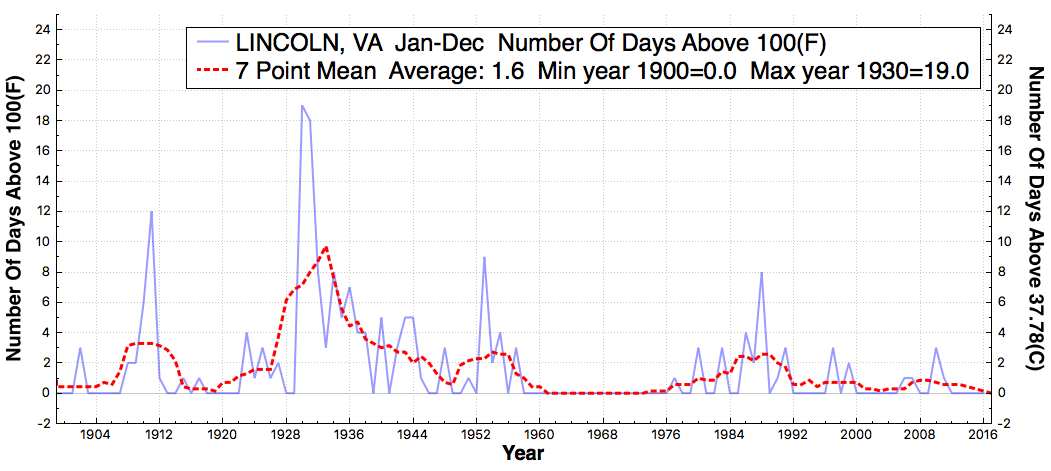
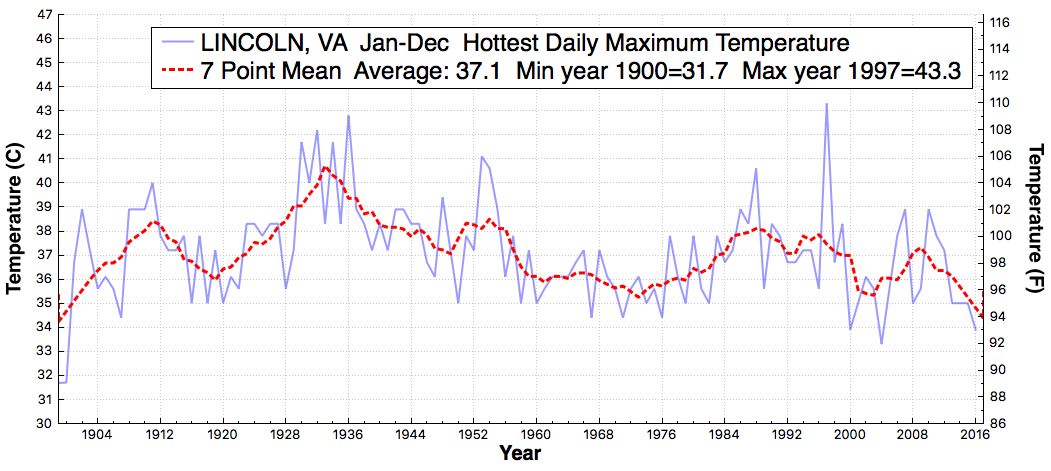
The temperature record shows the exact opposite of what Hansen was claiming. The frequency, intensity and areal coverage of hot weather in the US has plummeted over the past century.

What is particularly disturbing is his claim that we didn’t have hot weather in the 1950’s or the 1980’s. Hansen became famous in 1988, for blaming the heat on global warming. That summer was much hotter than the summer of 2012.

Screen Shot 2016-08-11 at 7.51.25 AM Screen Shot 2016-08-11 at 7.47.29 AM Screen Shot 2016-08-11 at 7.41.18 AM

James Hansen established a pattern of fraud which is now used almost universally by climate scientists, where they simply fabricate claims which are the exact opposite of what the data show.

Posted in Uncategorized | Leave a comment

Green Ontario!

Ontario continues to starve old and poor people with high electricity prices, in order to prop up 1.4% of their electrical production.

2016-08-11084517

Gridwatch | Web App

Posted in Uncategorized | Leave a comment

A Security Blanket For Wayward Skeptics

Meet_linus_big

Unless you are hypothermic, putting a blanket on will not raise your core temperature. It will however raise your skin temperature by creating a smaller thermal gradient between your core and the blanket.

The blanket can not raise your core temperature¹, but it can raise the temperature of everything in between itself and your body’s core². Some skeptics are fixated on ¹ – but can’t comprehend ².

Posted in Uncategorized | Leave a comment

Jill Stein Predicts 85 mm/year Sea Level Rise Until 2050

2016-08-11082628

Jill bumps up sea level rise by 50X, and then claims she can stop it with windmills. Progressives make the Monty Python witch burners seem like Nobel Prize winners.

Posted in Uncategorized | Leave a comment

Imitation is The Sincerest Form Of UHI

The Capital Weather Gang at the Washington Post has started generating graphs like mine. Note the one below which shows a sharp rise in the number of 100 degree days in Washington DC since 1988.

Screen Shot 2016-08-10 at 10.44.28 PM

But if we go 50 miles west of DC to more rural regions, we see the exact opposite. The number of 100 degrees has dropped off to almost zero since 1988.

LINCOLN_VA_#DaysAboveMaximumTemperatureThreshold100F_Jan_Dec_1867_2016

Similarly, they show an increase in hottest temperatures since the 1970s.

Screen Shot 2016-08-10 at 10.44.43 PM

The rural station does not show this. It shows a steady decline in peak temperatures since the 1930’s.

LINCOLN_VA_HottestDailyMaximumTemperature_Jan_Dec_1867_2016

Downtown DC is much hotter than surrounding areas. The only useful climate information we can deduce from is that urban stations need to be ignored.

2016-08-07222846

How hot can it get? 100-degree days are possible in D.C., but rarely a guarantee – The Washington Post

Posted in Uncategorized | Leave a comment