
The Capital Weather Gang at the Washington Post has started generating graphs like mine. Note the one below which shows a sharp rise in the number of 100 degree days in Washington DC since 1988.
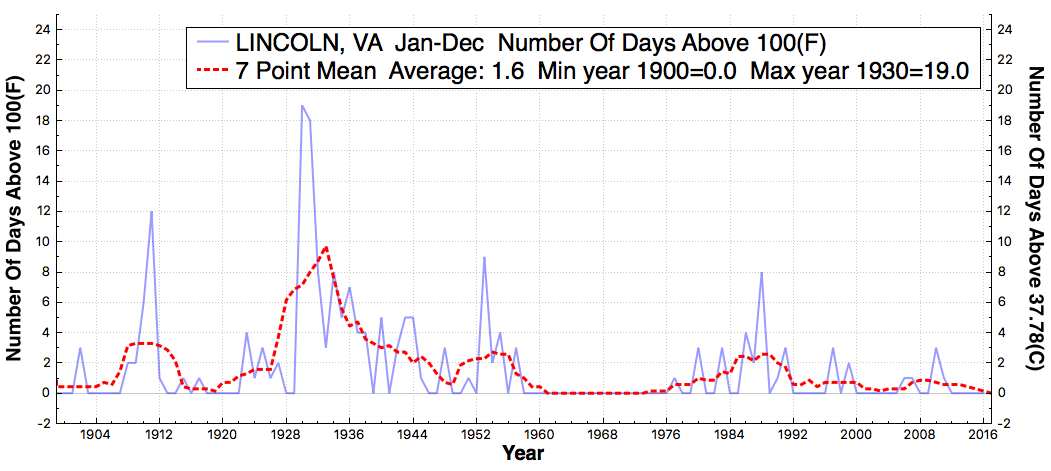
But if we go 50 miles west of DC to more rural regions, we see the exact opposite. The number of 100 degrees has dropped off to almost zero since 1988.
Similarly, they show an increase in hottest temperatures since the 1970s.
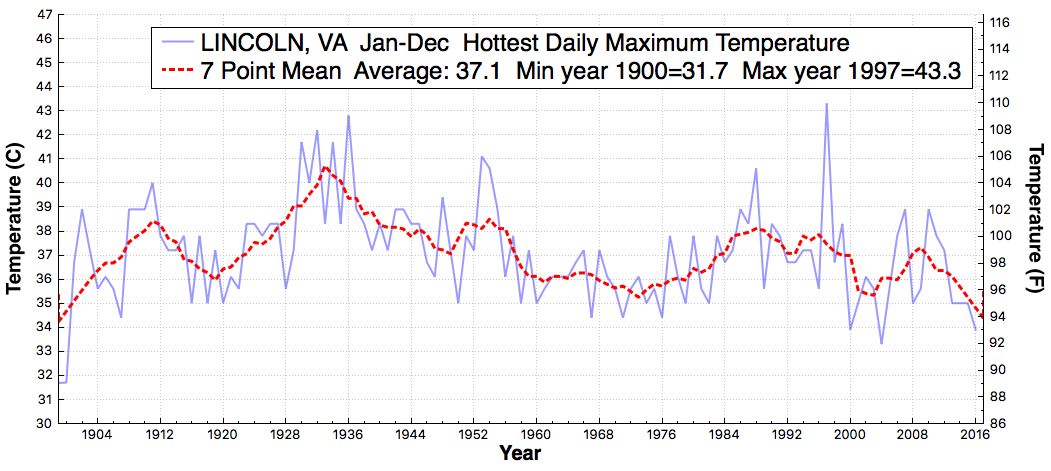
The rural station does not show this. It shows a steady decline in peak temperatures since the 1930’s.
Downtown DC is much hotter than surrounding areas. The only useful climate information we can deduce from is that urban stations need to be ignored.

