Scientists have definitively explained why past global warming led to even more warming, which kept feeding back on itself unstoppably until the planet melted.
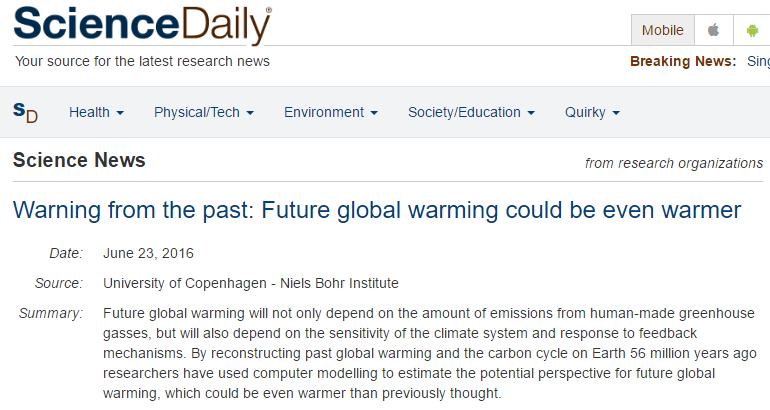
Warning from the past: Future global warming could be even warmer — ScienceDaily
Scientists have definitively explained why past global warming led to even more warming, which kept feeding back on itself unstoppably until the planet melted.
Warning from the past: Future global warming could be even warmer — ScienceDaily
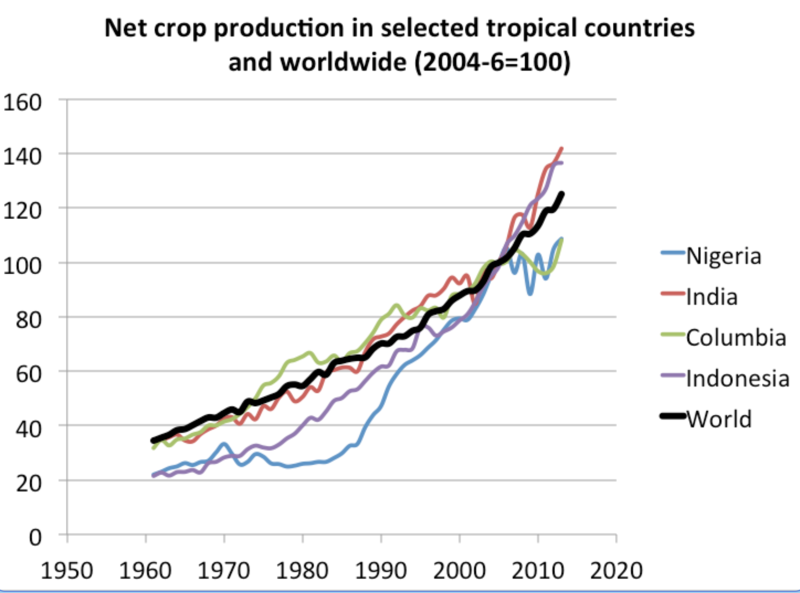
Scientists have finally explained why global crop production increases to record levels year after year.
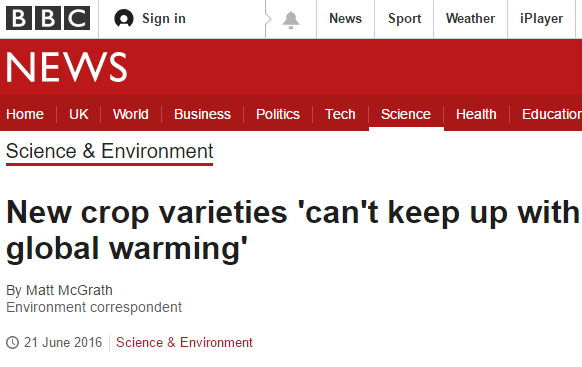
New crop varieties ‘can’t keep up with global warming’ – BBC News
The science is clear. Global warming is wrecking crops, causing crop yields to increase exponentially.
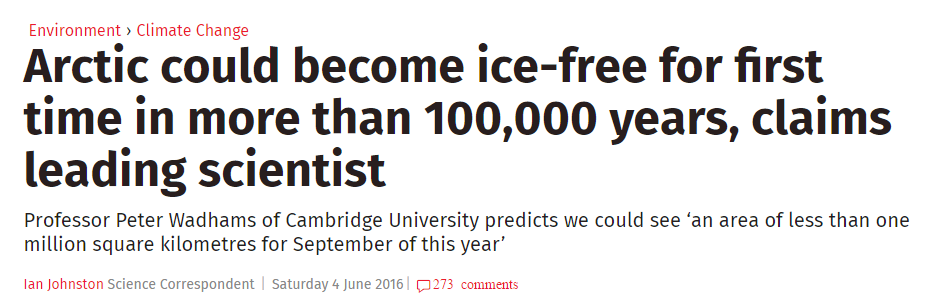
Three weeks ago, experts forecast an ice-free summer in the Arctic, and defined ice-free as larger than the area of Texas and Wyoming combined.
So how is their expert climate forecast coming along? The map below shows the US Navy forecast for thickness at the end of June.
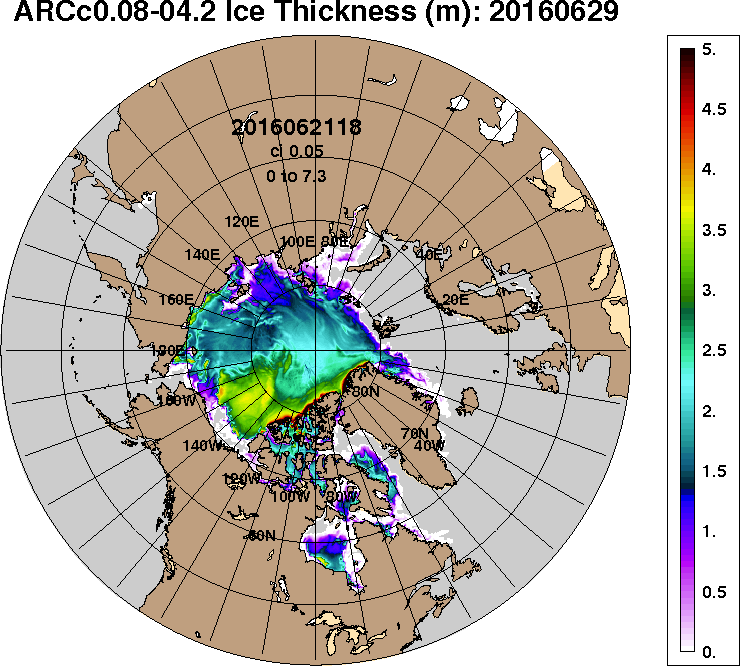
ictn2016062118_2016062900_042_arcticictn.001.gif (740×666)
NCEP is forecasting cold weather in the Beaufort Sea through mid-July.
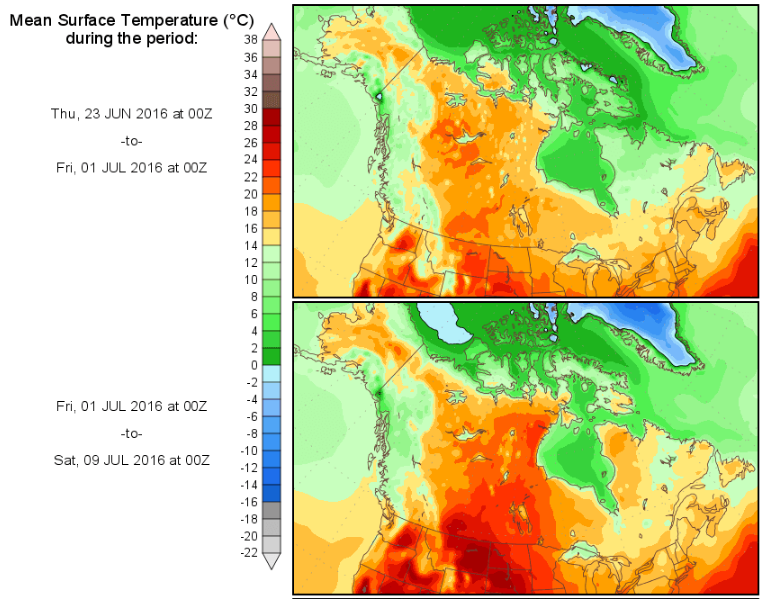
The ice is the second thickest since 2009.
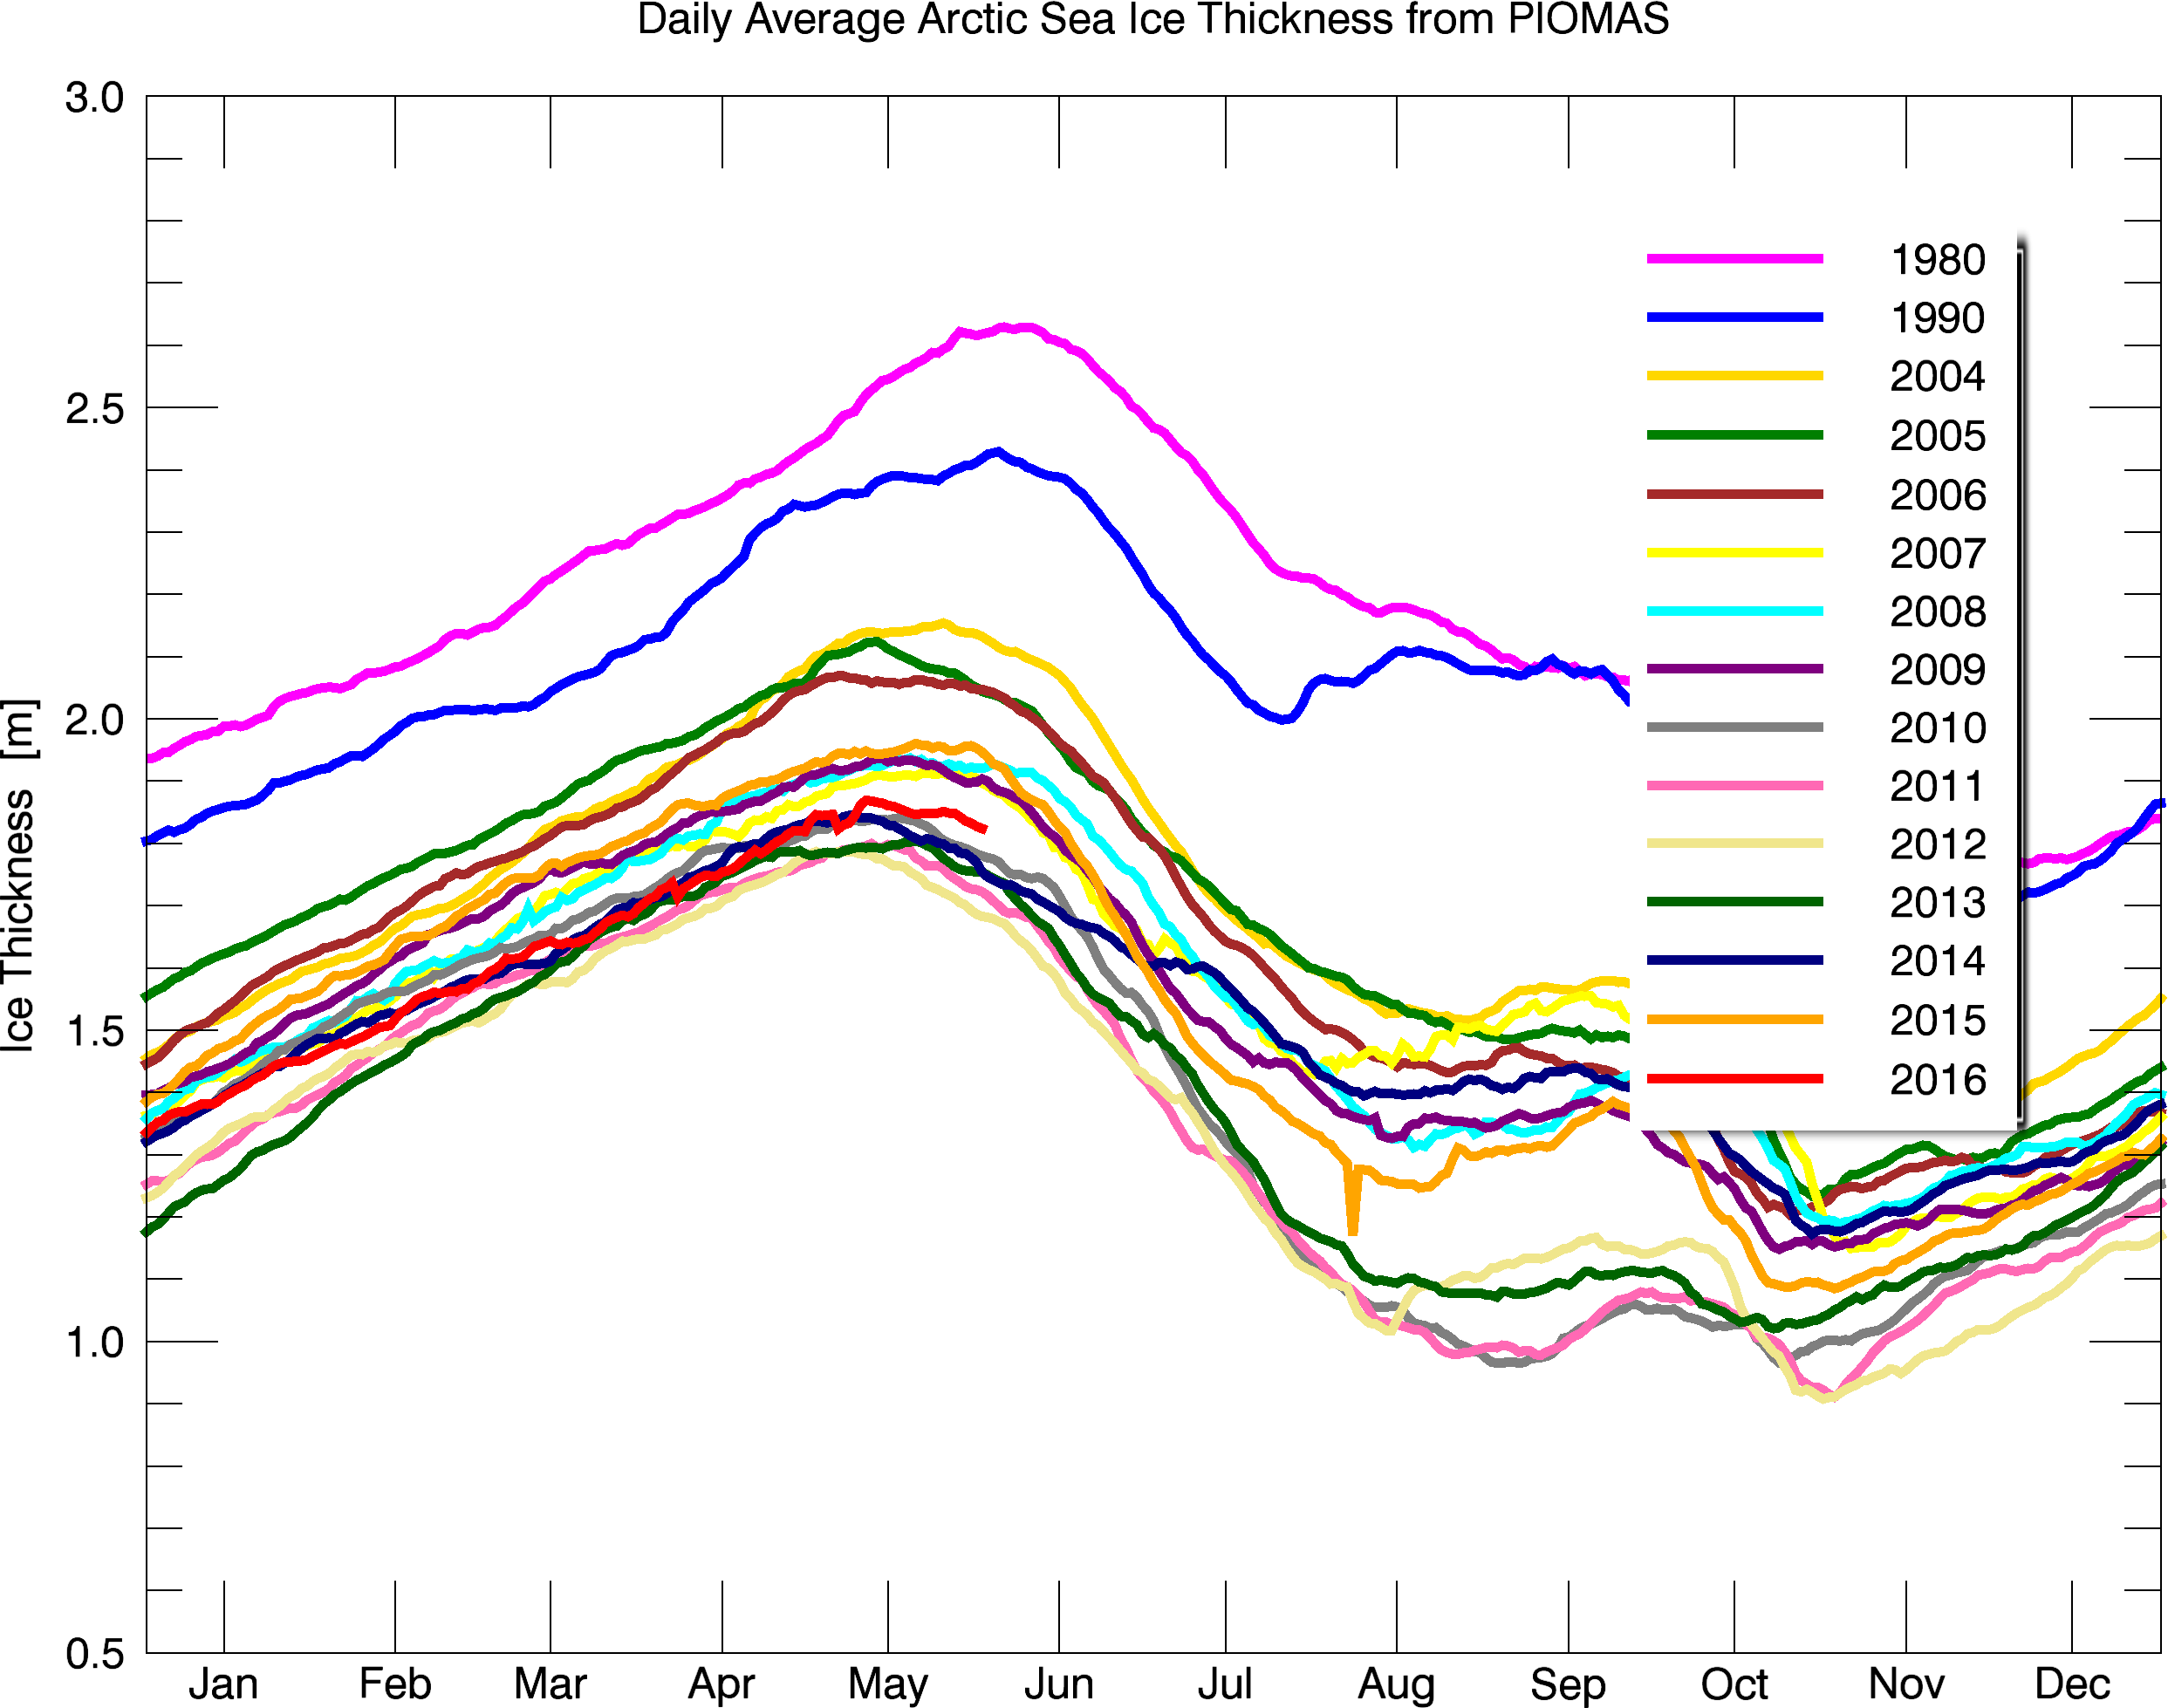
Bpiomas_plot_daily_heff.2sst.png (2485×1958)
Wadham’s forecast is a dishonest exaggeration, which according to Democrats is prosecutable fraud. But there is nothing new about this, the top people in climate science and politics have been exaggerating the state of Arctic every year for longer than anyone can remember.
Arctic ice-free by 2012.
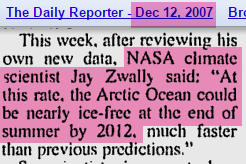
The Daily Reporter – Google News Archive Search
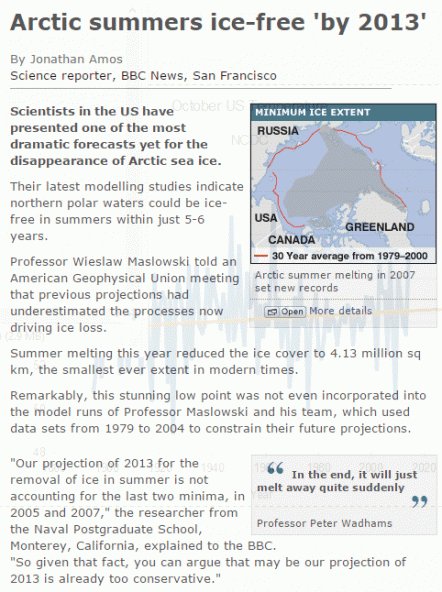
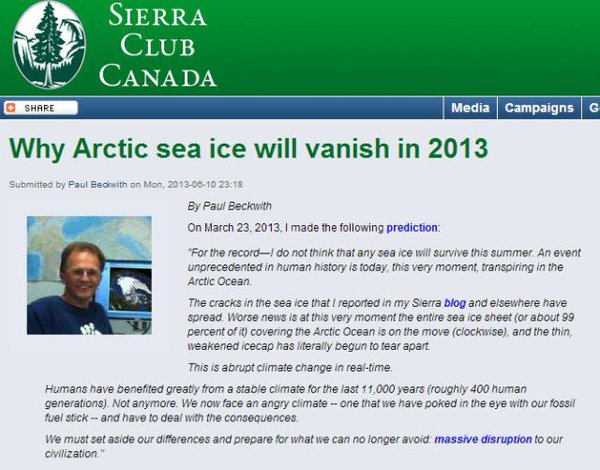
Arctic ice-free by 2013
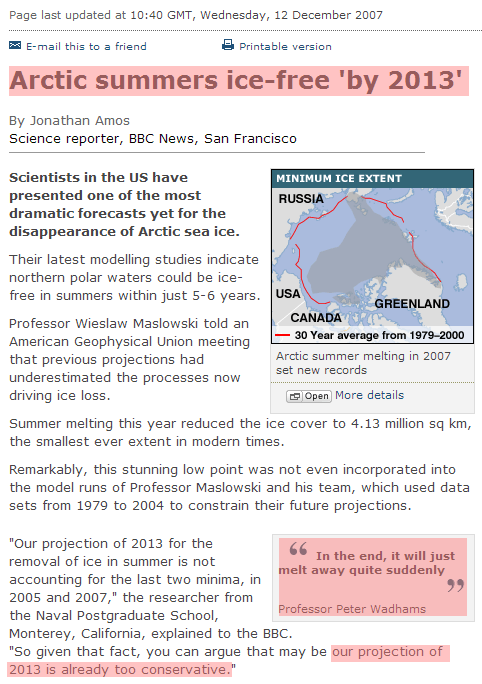
BBC NEWS | Science/Nature | Arctic summers ice-free ‘by 2013’
Arctic ice-free by 2014.
Gore: Polar ice cap may disappear by summer 2014
Arctic ice-free by 2015.
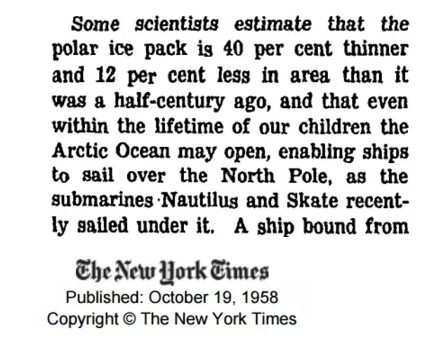
What climate scientists talk about now – FT.com
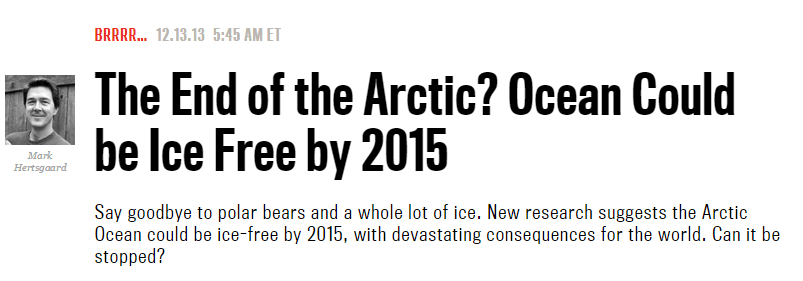
The End of the Arctic? Ocean Could be Ice Free by 2015 – The Daily Beast
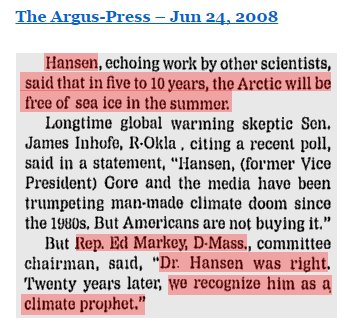
The Argus-Press – Google News Archive Search
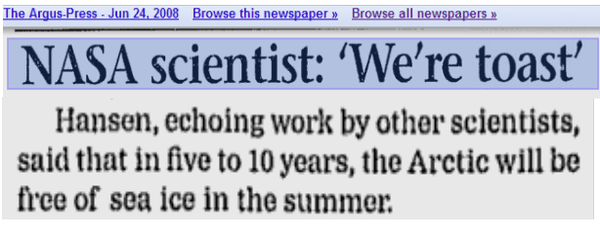
The Argus-Press – Google News Archive Search
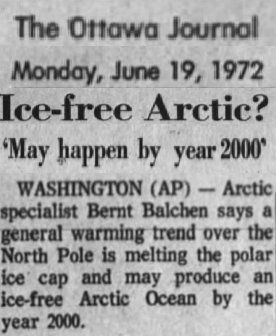
19 Jun 1972, Page 41 – at Newspapers.com
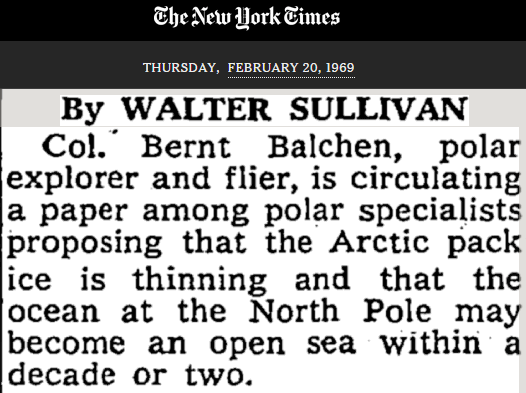
The Changing Face of the Arctic – The Changing Face of the Arctic – View Article – NYTimes.com
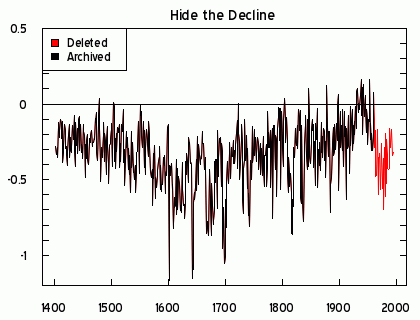
According to Democrat AG’s, hiding critical climate information is fraud. That is exactly what Phil Jones and Michael Mann did.
From: Phil Jones. To: Many. Nov 16, 1999
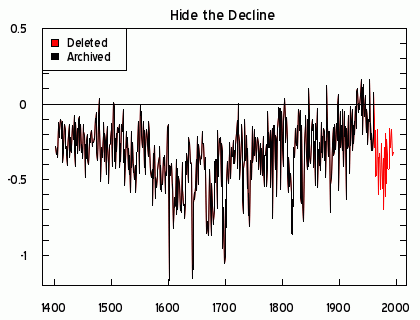
“I’ve just completed Mike’s Nature trick of adding in the real temps to each series for the last 20 years (ie, from 1981 onwards) and from 1961 for Keith’s to hide the decline.”
Michael Mann hid the post-1960 decline in the temperatures, as measured by Briffa in his paleoclimate studies. Mann claimed that the decline didn’t match the surface temperature record, and simply erased it.
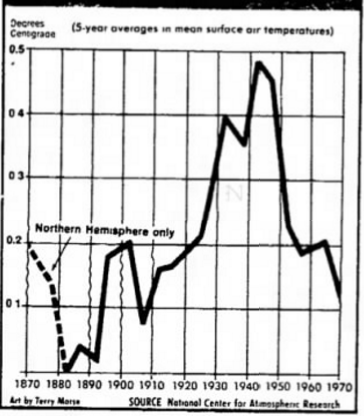
Under the Democratic definition of fraud, Mann is culpable for hiding data. But it gets much worse – because his justification was also scientifically unsupportable. As of 1974, NCAR showed the decline in surface temperatures, which Mann claimed didn’t exist.
14 Jul 1974, Page 1 – at Newspapers.com
As of 1978, NOAA also showed the decline in both surface and radiosonde temperatures.
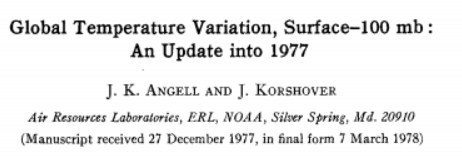
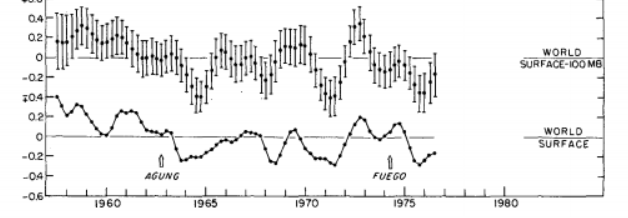
NASA has since erased the decline, making themselves culpable under the Democratic definition of fraud.
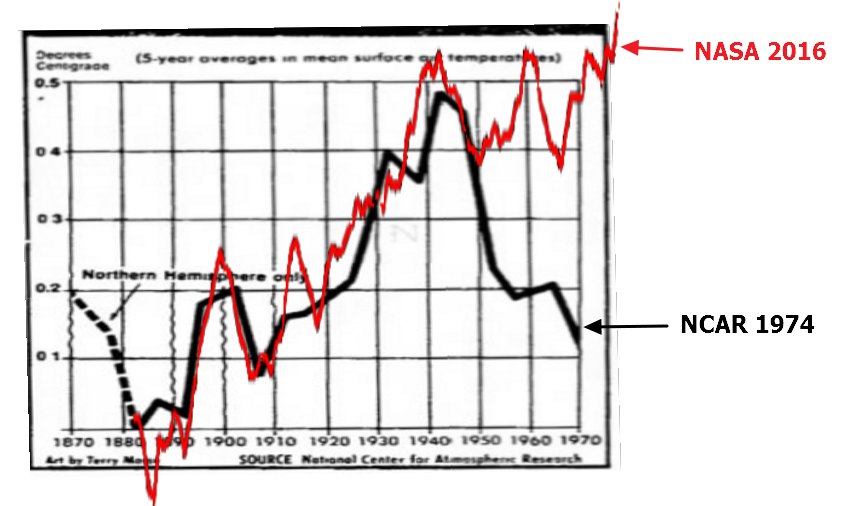
In 1974, the government’s top climatologist reported the cooling which Mann and NASA erased.
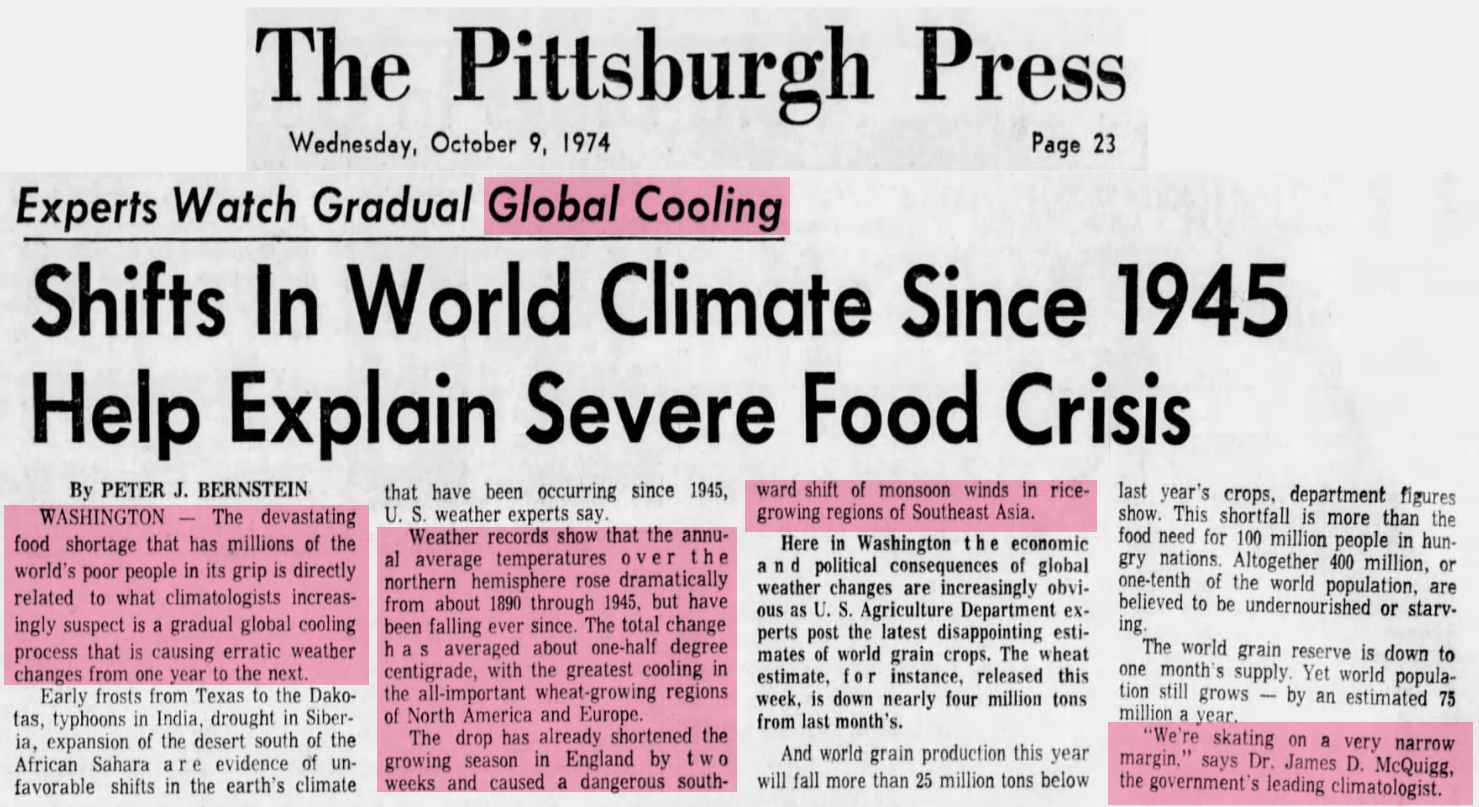
9 Oct 1974, Page 25 – The Pittsburgh Press at Newspapers.com
In 1975, Steven Schneider at NCAR reported the cooling which Mann and NASA erased.
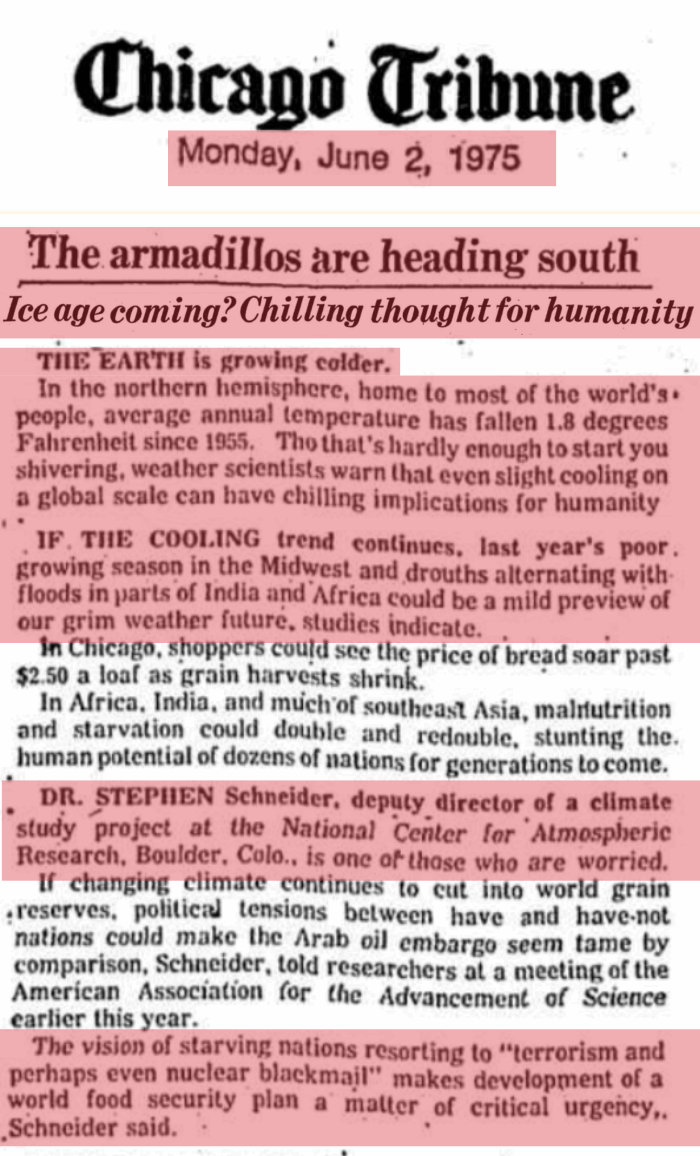
June 2, 1975 – The armadillos are heading south | Chicago Tribune Archive
Climate scientists have been exaggerating and hiding data for decades. Under the Democratic definition, they are committing fraud.
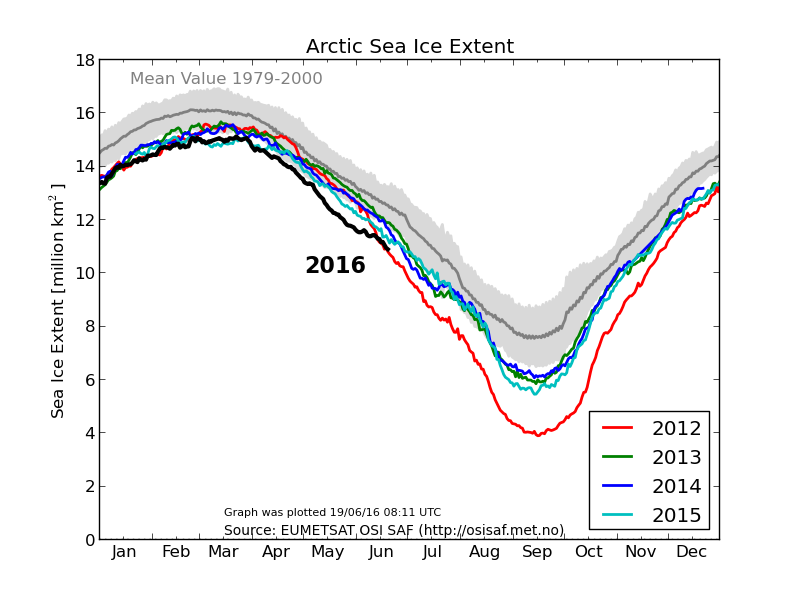
The DMI graph shows that nearly 10% of Arctic sea ice has disappeared in the last week.
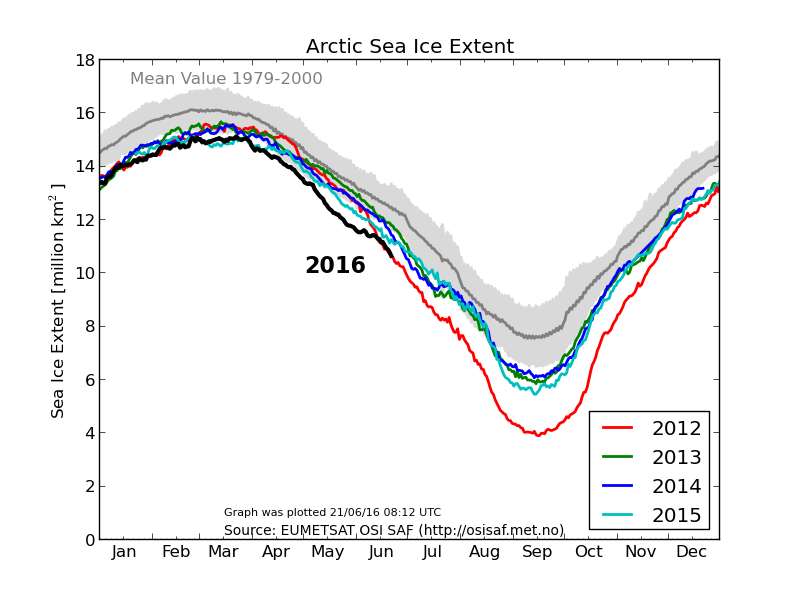
Ocean and Ice Services | Danmarks Meteorologiske Institut
The OSISAF maps they base their data on show only about 4% loss of ice over the past week, and almost none in the Arctic Basin.
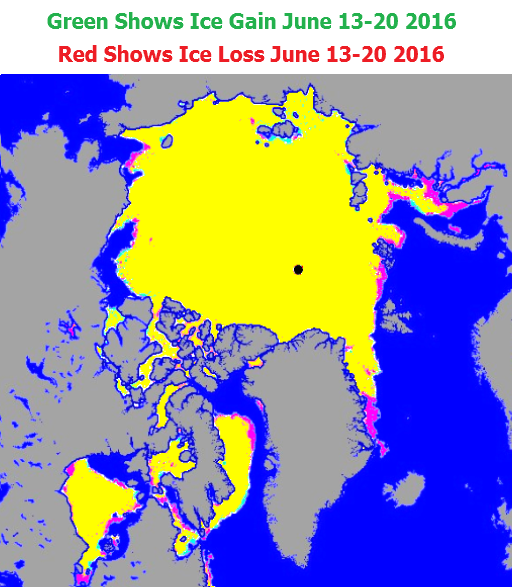
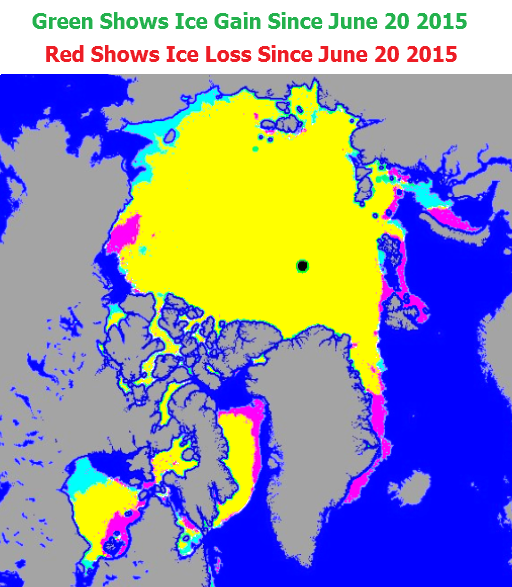
Similarly, the DMI graph shows much less ice than last year, but the the OSISAF maps show that there is about the same amount of ice as last year.
Democrats say that lying about the climate is not protected speech, which puts an entire $29 billion per year industry of paid climate alarmists at risk. For example, this sea level story is 100% fraudulent.


San Francisco’s global warming price tag could be $77 billion – San Francisco Business Times
It is based on this story, which says San Francisco “could be underwater”
Then it says San Francisco “will be underwater”

Actual data shows that the study is scientifically baseless. Sea level in the San Francisco Bay shows little or no change over the past 75 years.
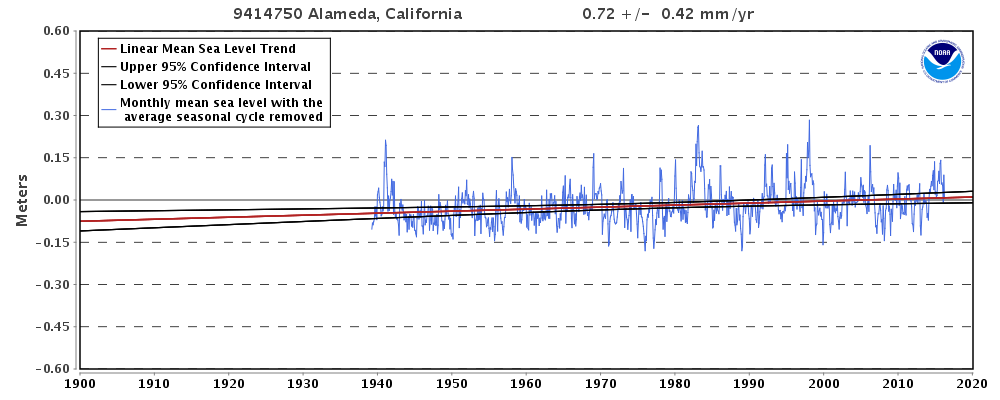
Sea Level Trends – State Selection
Other Northern California tide gauges show sea level falling.
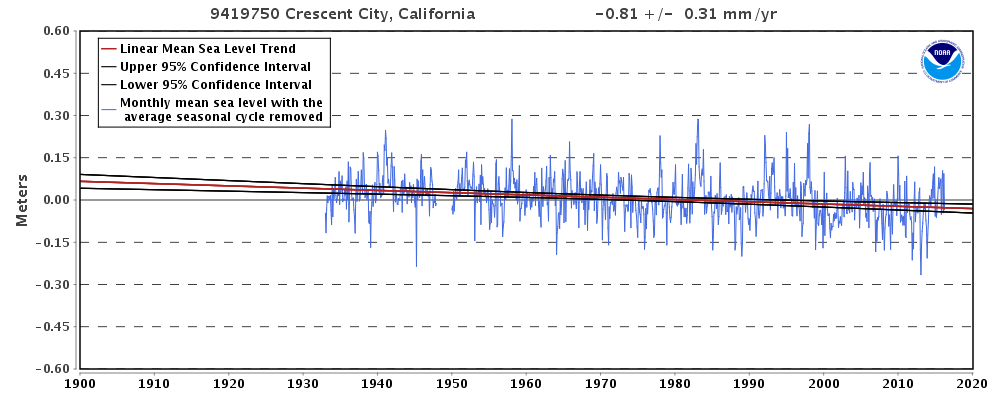
Sea Level Trends – State Selection
There is no scientific basis for the claims in these sort of articles. These are paid fraudsters who are intentionally misinforming the public. If Democrats want to prosecute climate fraud, the fraudsters are right under their nose and on their payroll.
The Capital Weather Gang has been pushing nonsensical claims about record heat in the southwest and the relationship of heatwaves to carbon dioxide.

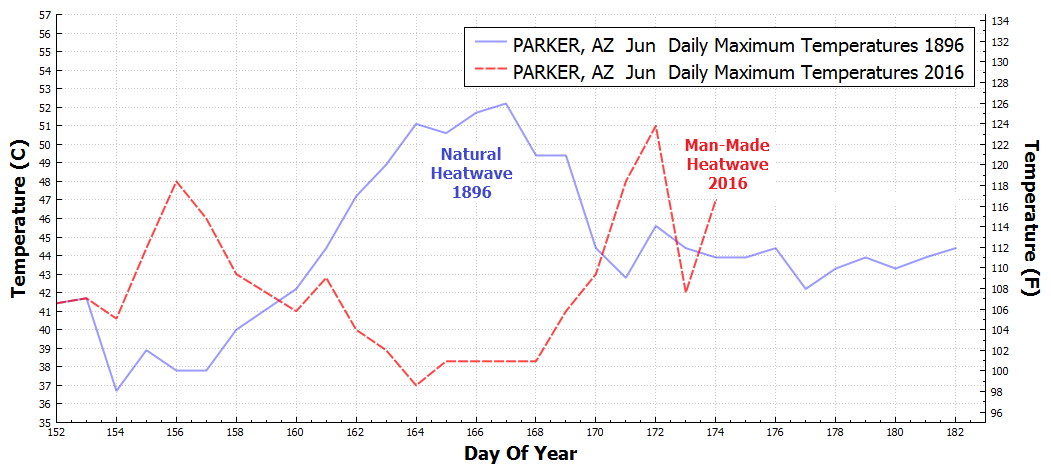
There was no factual basis to any of their claims, and now that the peak of the heatwave has passed you can see how it compared to June 1896. (Missing USHCN values from June 2016 were filled in from Weather Underground tables.)
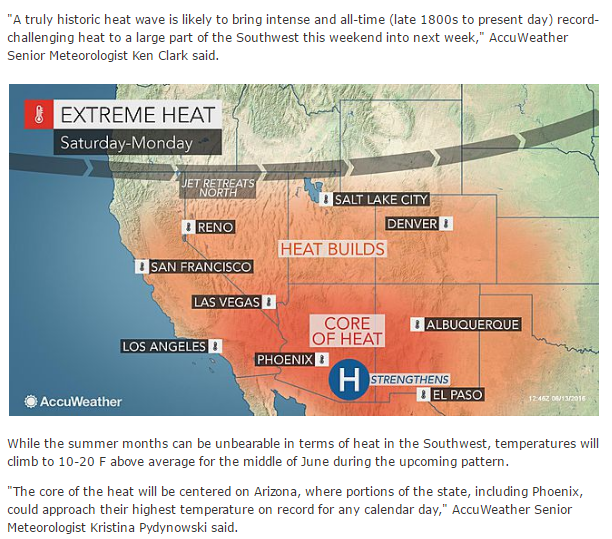
A few days ago, experts were predicting all-time record heat in Phoenix on Sunday. I pointed out what utter nonsense this forecast was.

Phoenix record hot day of 122F occurred in 1990. Yesterday only reached 117F.
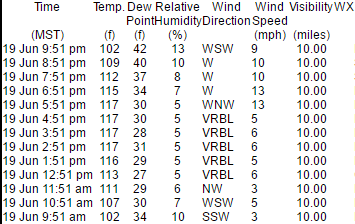
OBS:Phoenix, Phoenix Sky Harbor International Airport
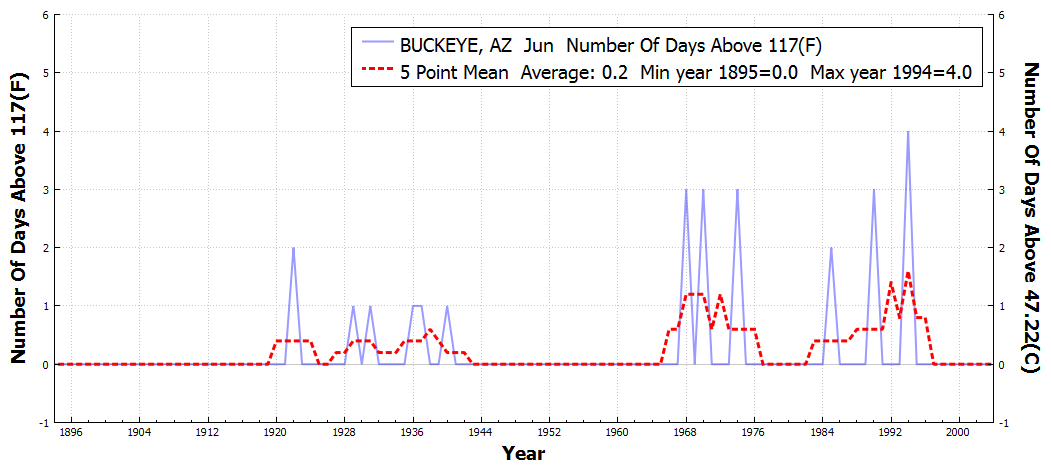
June temperatures over 117F used to occur quite frequently in that area, but this was the first one in many years.
I played on the ASU soccer team in 1974, the year of their record heatwave of 18 consecutive days over 110F. We held practice at 4PM, and most days the temperature was around 107F.
As always, the climate information you see in the media is nothing but alarmist nonsense.
I showed yesterday how the recent drop in DMI Arctic sea ice extent is due to a non-existent drop in Hudson Bay ice.
The image below shows how nonsensical the DMI data is.
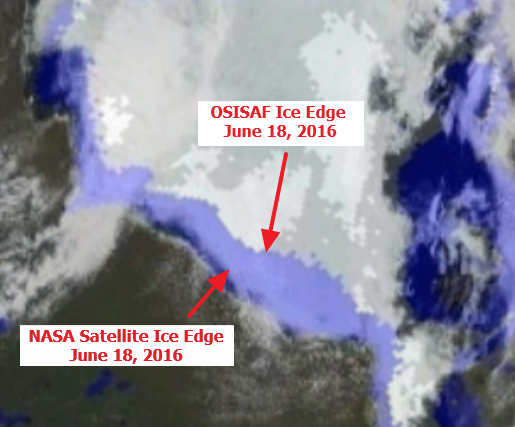
I will be flying over the southwest coast of Hudson Bay on Saturday, and will be sure to take pictures of all that non-existent ice.
The level of fraud and stupidity from this White House is rocketing off-scale as Obama’s term ends.


Amid melting Arctic ice, Kerry sees looming climate …
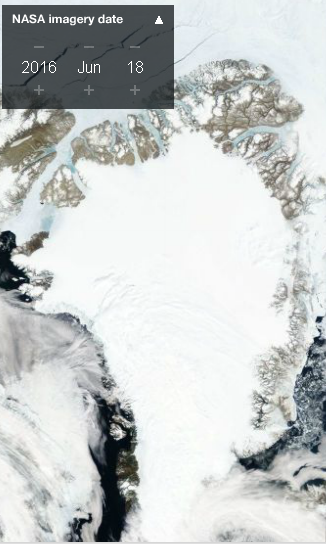
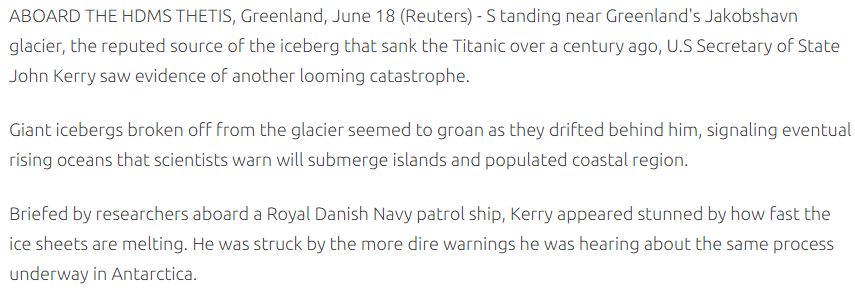
Standing near Greenland’s Jakobshavn glacier, the reputed source of the iceberg that sank the Titanic over a century ago, U.S Secretary of State John Kerry saw evidence of another looming catastrophe. Giant icebergs broken off from the glacier seemed to groan as they drifted behind him, signaling eventual rising oceans that scientists warn will submerge islands and populated coastal region.
Glaciers calving has nothing to do with melt. Snow falls in the interior and flows to the sea in rivers of ice known as glaciers. Hundreds of billions of tons of snow falls on Greenland every year, and it all has to return to the sea, to maintain equilibrium. These geniuses mention the Titanic in 1912. What caused the calving in 1912, when CO2 was just over 300 PPM?
The Jakobshavn Glacier retreated about three meters per day from 1875 to 1883. It has nothing to do with CO2 or climate change.
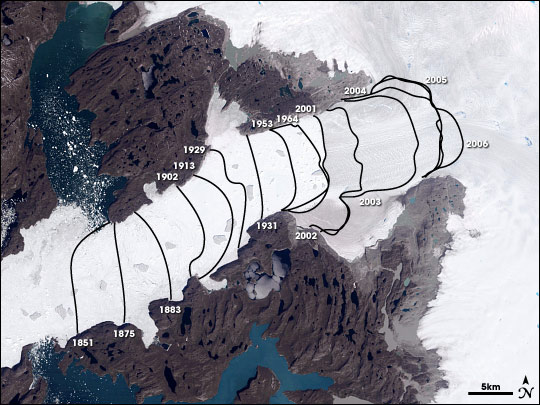
Jakobshavn Glacier – Wikipedia, the free encyclopedia
David Holland, a New York University scientist studying changes on Jakobshavn, explained that the glacier could retreat by about 62 miles (100 kilometers) over the next 100 years if the thawing of its ice sheet continues at its current pace. If Greenland’s ice sheets all melted, that would raise sea levels by about 6 meters (20 feet) over thousands of years. That is modest compared to what could happen if Antarctica keeps thawing, said Holland.
NASA says Antarctica is gaining ice, not losing it.

NASA Study: Mass Gains of Antarctic Ice Sheet Greater than Losses | NASA
One warm day is now climate.
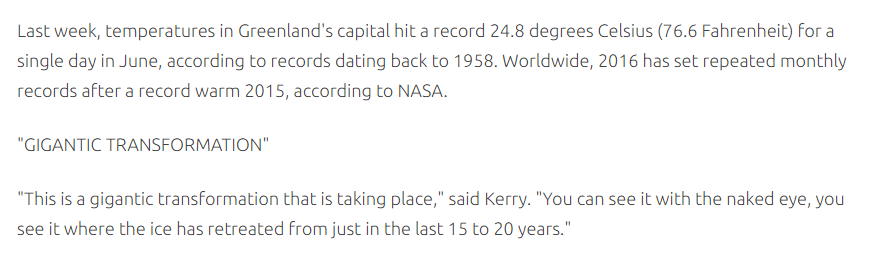
Last week, temperatures in Greenland’s capital hit a record 24.8 degrees Celsius (76.6 Fahrenheit) for a single day in June, according to records dating back to 1958. Worldwide, 2016 has set repeated monthly records after a record warm 2015, according to NASA.
The author cleverly eliminated all of the much warmer Junes prior to 1958, including the very warm June of 1957.
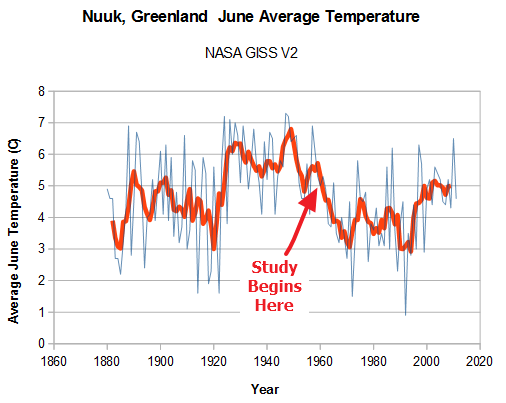
Data.GISS: GISS Surface Temperature Analysis
Scientists have been saying the identical BS about Greenland since before Bernie Sanders was born.
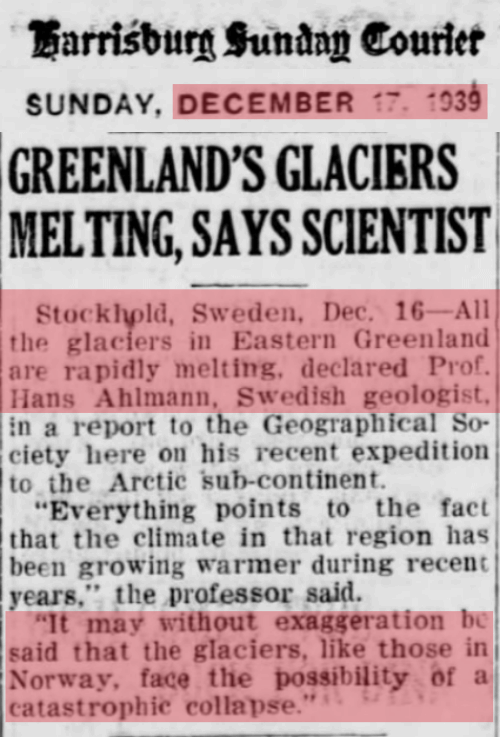
17 Dec 1939, Page 15 – at Newspapers.com
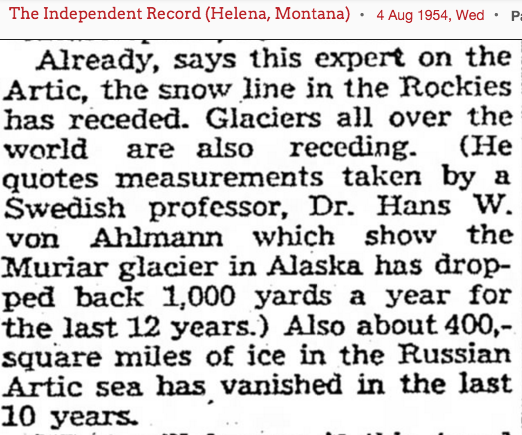
4 Aug 1954, Page 4 – at Newspapers.com
Greenland is not melting down. Its surface has gained more than 500 billion tons of ice since September, slightly above normal.
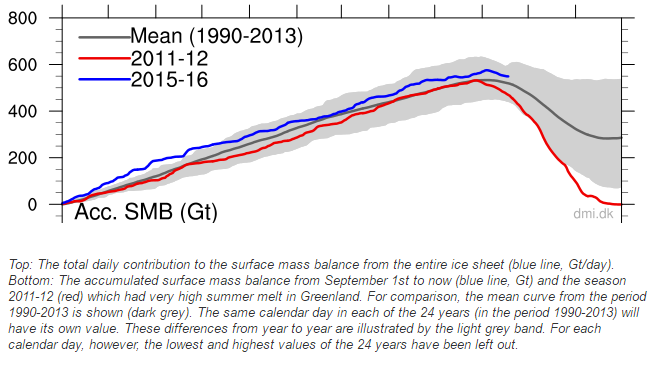
Greenland Ice Sheet Surface Mass Budget: DMI
There isn’t one smidgen of truth to the catastrophic Greenland meltdown claims. It is the biggest scam in science history.
I will be flying over Nuuk, Greenland next weekend and will take pictures of all that ice.