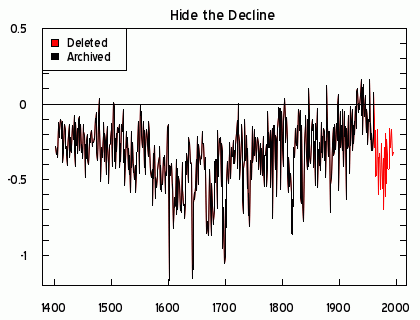
NCAR 1975 : Global Cooling Caused Terrorism – National Security Crisis

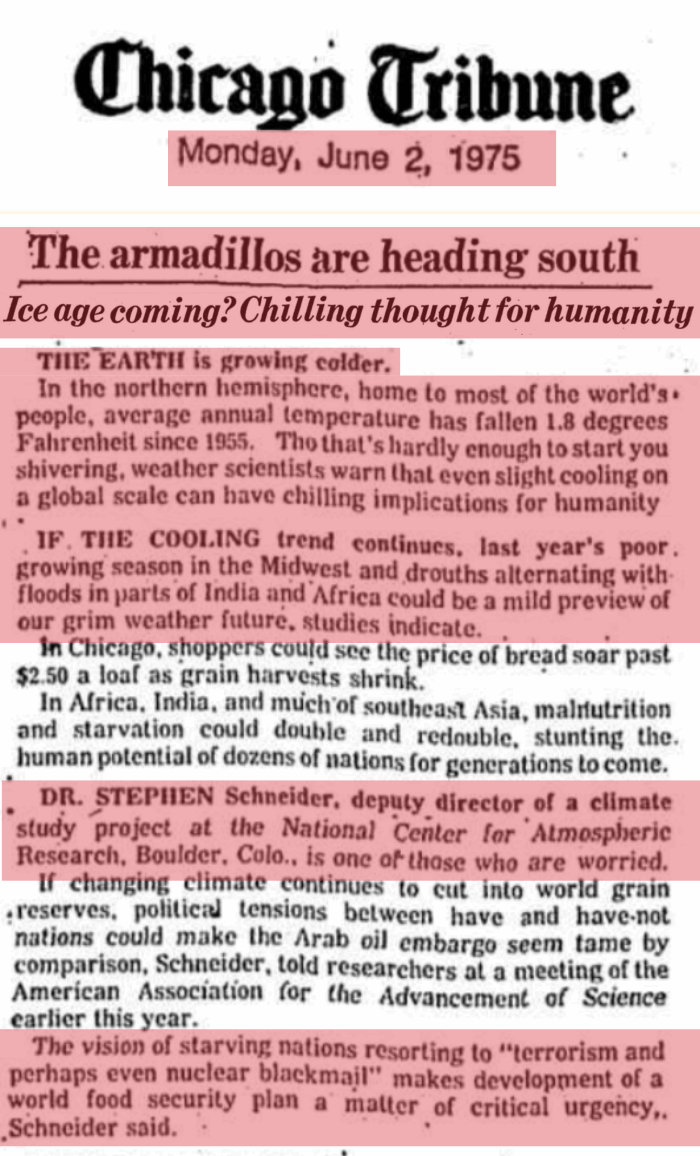
In 1975, the top climatologist in the US warned that global cooling was going to cause terrorism, nuclear blackmail, malnutrition and starvation.

In the northern hemisphere, home to most of the world s . people, average annual temperature has fallen 1.8 degrees Fahrenheit since 1955. Tho that’s hardly enough to start you shivering, weather scientists warn that even slight cooling on a global scale can have chilling implications for humanity.

In Africa, India, and much of Asia, malnutrition and starvation could double and redouble, stunting the. human potential of dozens of nations for generations to come.  DR. Schneider. deputy director of a climate study project at the National Center for Atmospheric Research, Boulder, Colo., is one of those who are worried.  If changing climate continues to cut into world grain reserves, political tensions between have and have-not nations could make the Arab oil embargo seem tame by comparison, Schneider, told researchers at a meeting of the American Association for the Advancement of Science earlier this year. The vision of starving nations resorting to “terrorism and perhaps even nuclear blackmail” makes development of a world food security plan a matter of critical urgency,. .Schneider said.
2016-05-09213548-down

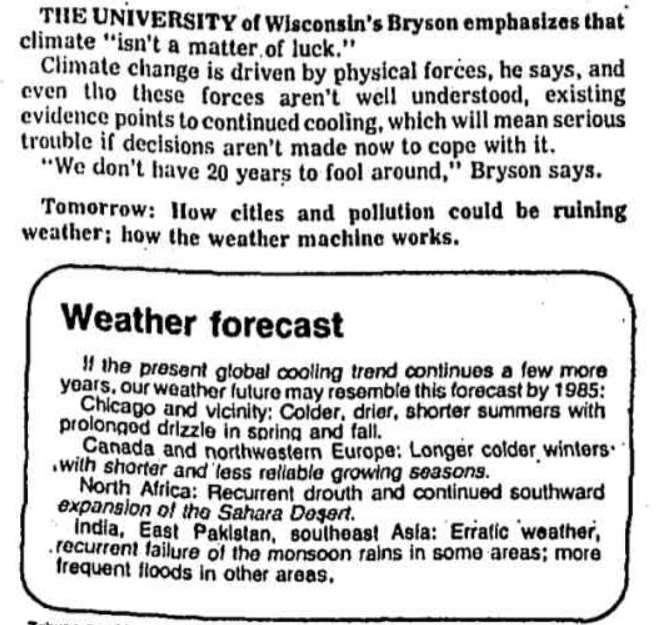
We had less than twenty years to save the planet from global cooling.
2016-05-09222930

June 2, 1975 – The armadillos are heading south | Chicago Tribune Archive

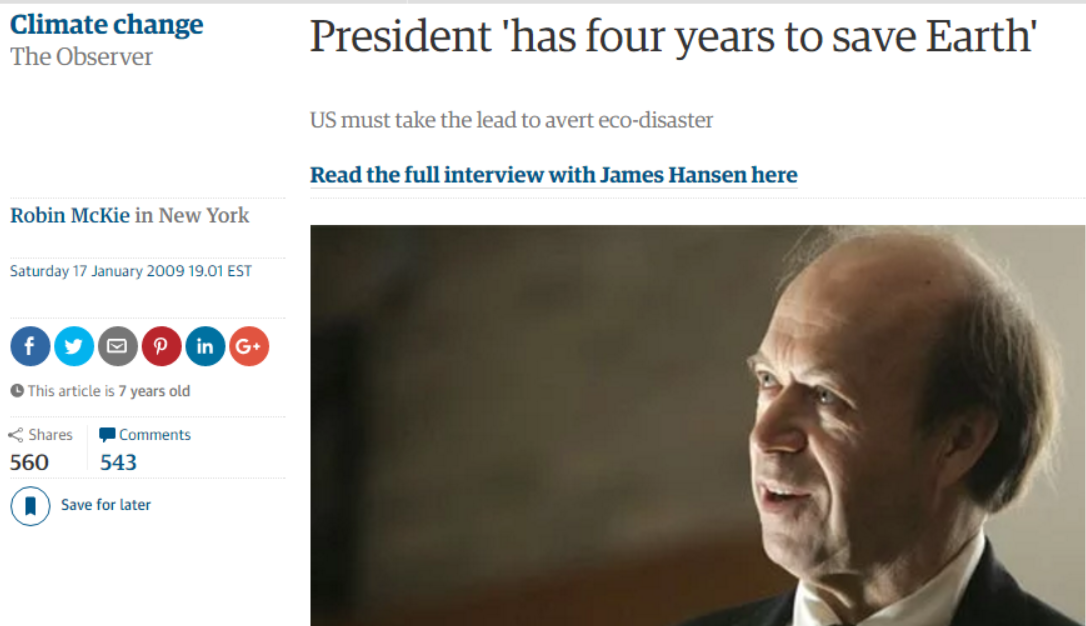
Experts now know that global warming causes terrorism, nuclear blackmail, malnutrition and starvation, and our time to save the planet ran out in 2012.
2016-05-09223923

President Obama ‘has four years to save Earth’ | Environment | The Guardian
Posted in Uncategorized | Leave a comment

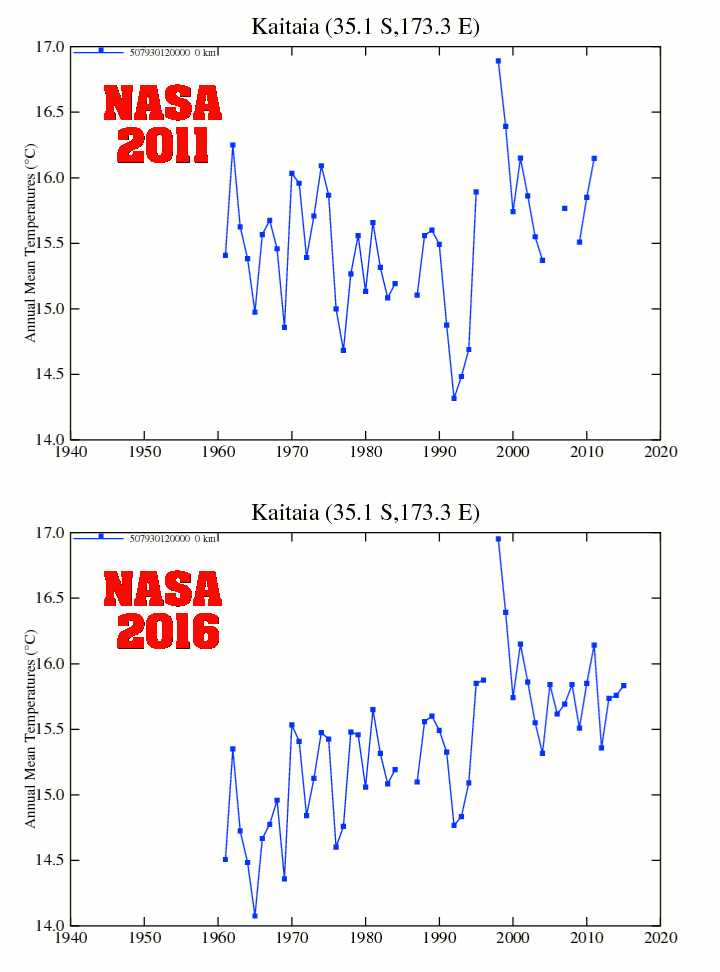
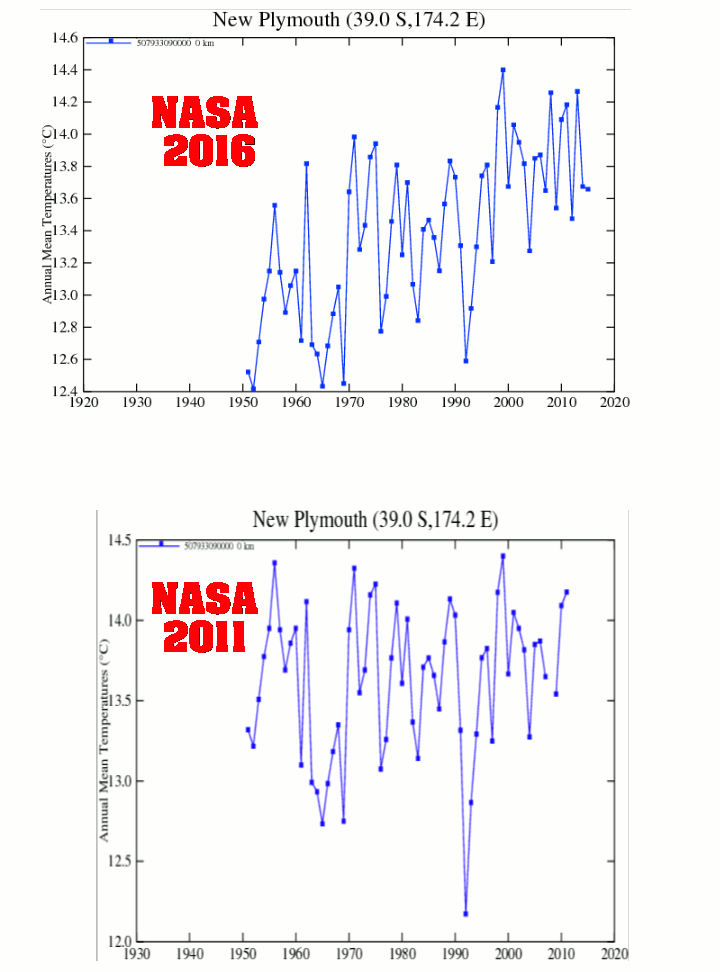
Hiding The Decline In New Zealand

NASA  didn’t like the fact that New Zealand wasn’t warming, so they simply changed the data.

NewPlymouth2011-2016

Kaitaia-2011-2016

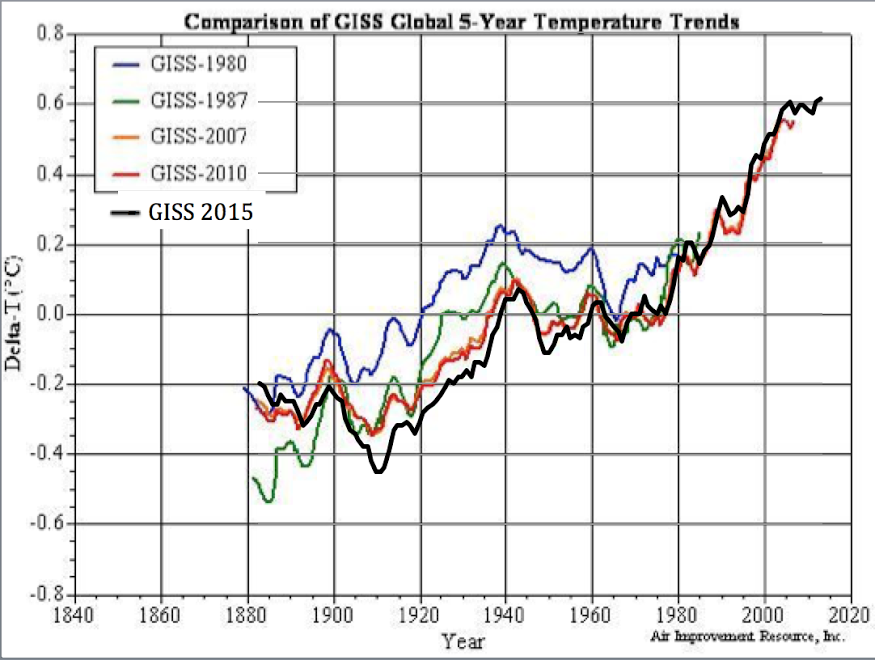
For the whole planet, Joe D’Aleo prepared this graph showing how NASA has continuously erased the 1940’s blip and subsequent cooling.

unnamed (1)

Posted in Uncategorized | Leave a comment

Science By Ambulance Chasing Journalists

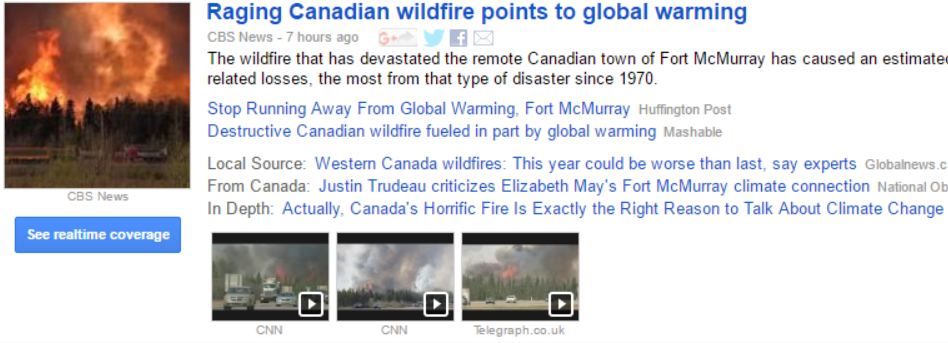
Climate scamsters take every opportunity to blame human misery on climate change.

2016-05-09111304

Raging Canadian wildfire points to global warming – CBS News

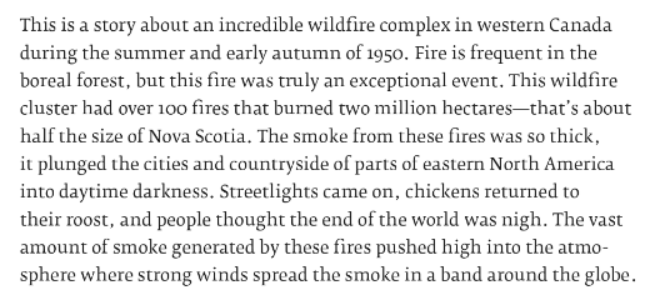
Canada has had much larger fires than the current one, including the 1950 fire which burned five million acres and darkened the skies in Scotland.

2016-05-09093502

The Chinchaga Firestorm: When the Moon and Sun Turned Blue

2016-05-09100143-down

28 Sep 1950, Page 33 – The Ottawa Journal at Newspapers.com

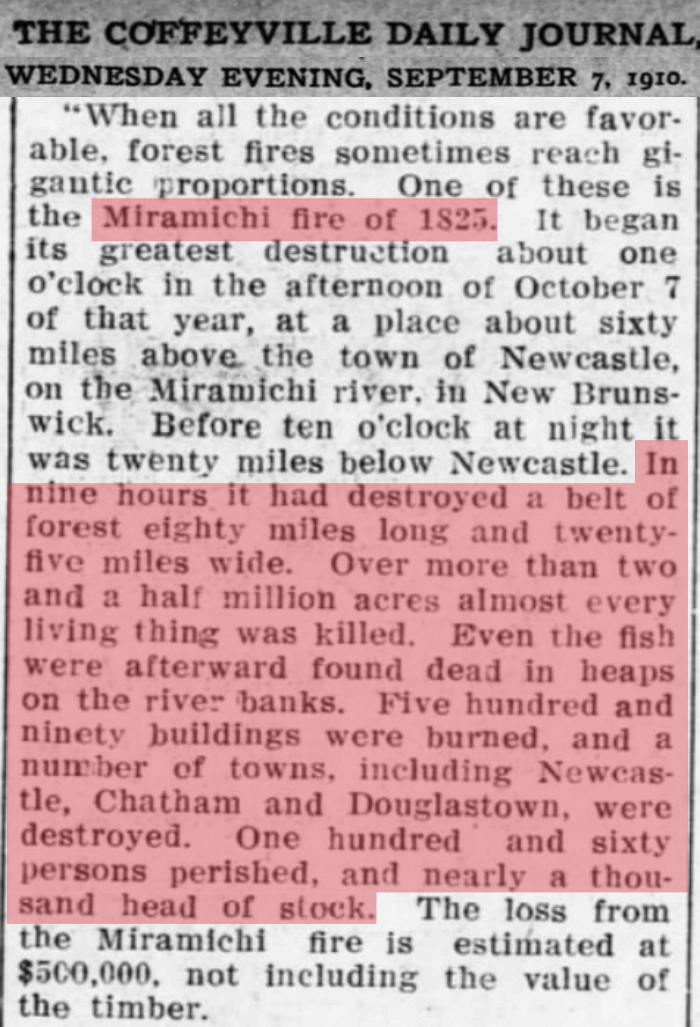
The 1825 Miramichi Fire in Nova Scotia burned 2.5 million acres in nine hours, and destroyed multiple towns.

2016-05-08084310-down

7 Sep 1910, Page 3 – The Coffeyville Daily Journal at Newspapers.com

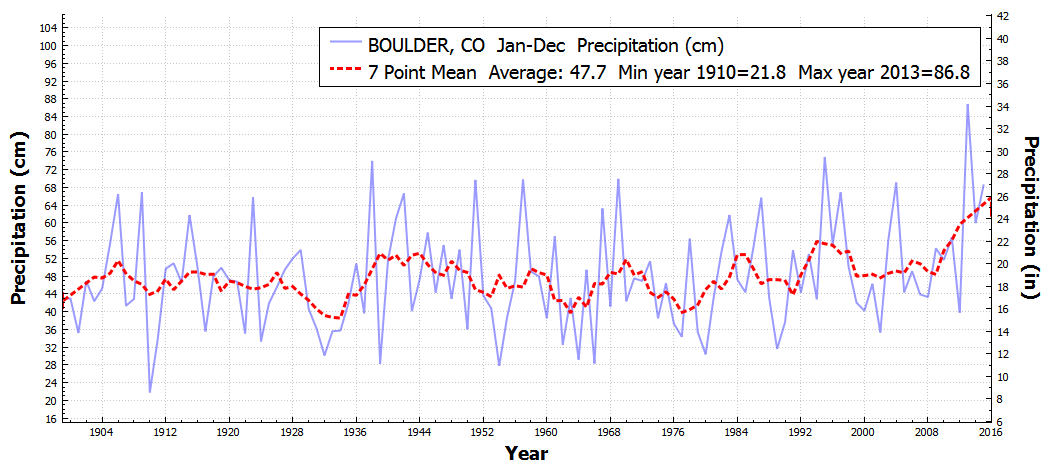
Here in Colorado it is so wet, I’m thinking about changing the name of Boulder to the Bayou City.  But four years ago, climate scamsters were telling us that the large fires of 2012 were “the new normal.” Ever since then, Boulder has been the wettest on record.

BOULDER_CO_TotalPrecipitation_Jan_Dec_1900_2015

Climate scamsters don’t know anything about climate or history. They are morons and/or frauds.

Posted in Uncategorized | Leave a comment

Alterations To Surface Temperatures Since 1974

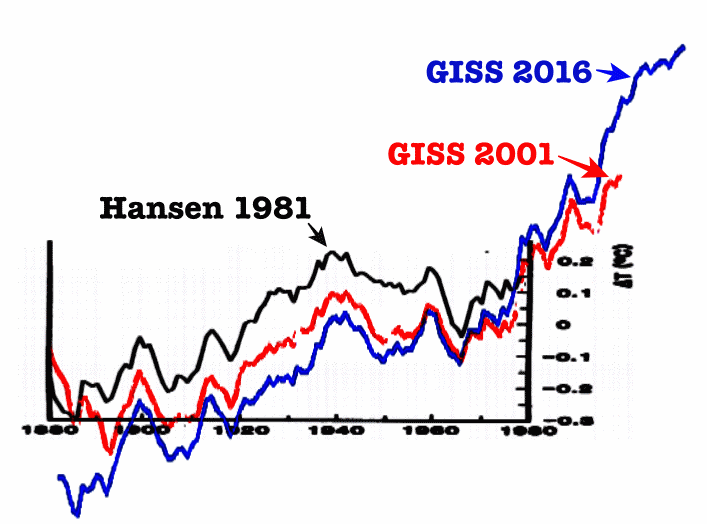
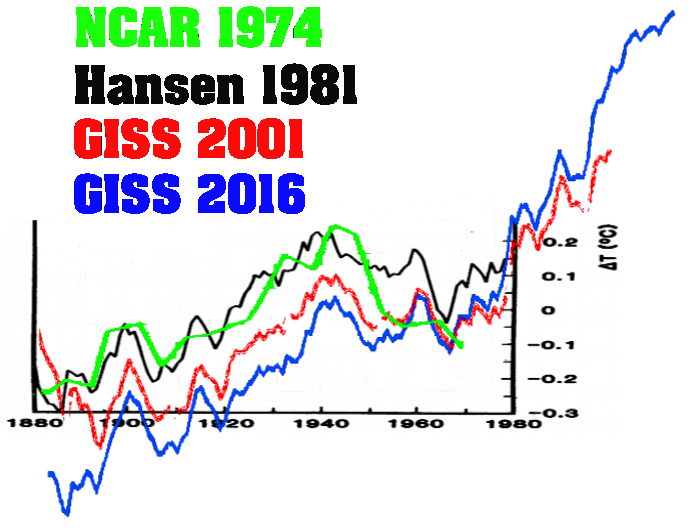
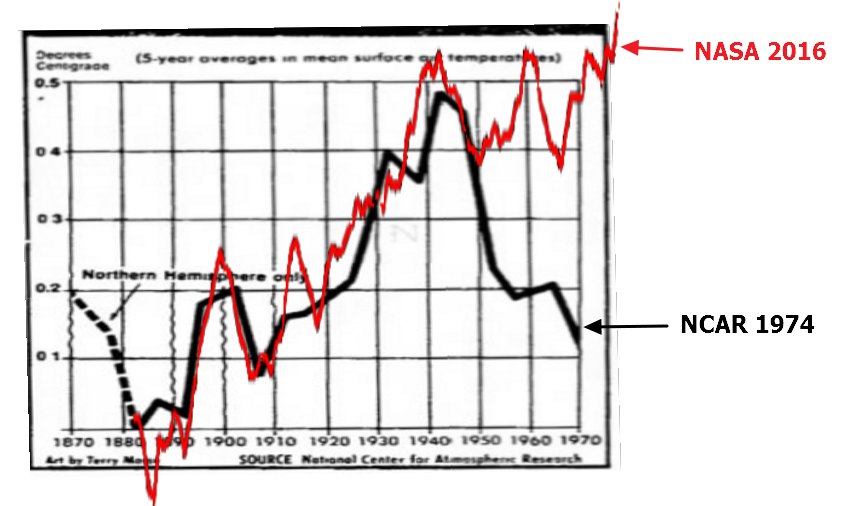
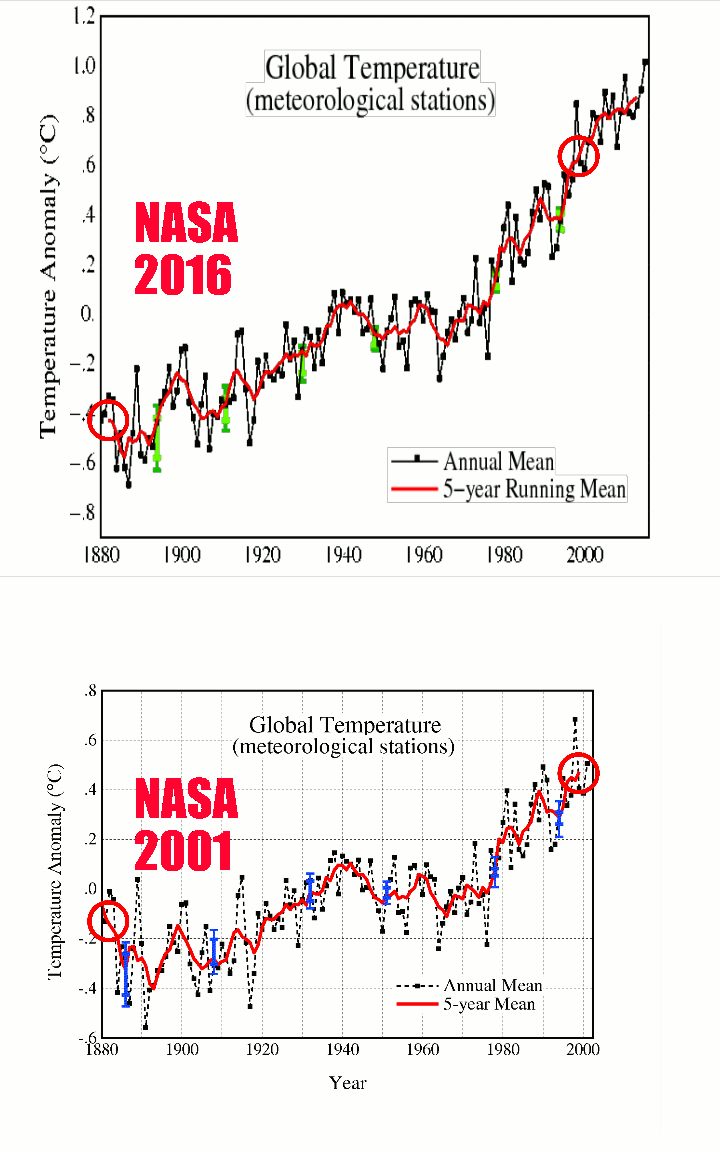
The graph below shows how NASA has been steadily erasing the 1940’s blip, and subsequent 1940 to 1970 global cooling.

2016-05-09050642

1981: 1981_Hansen_etal_1.pdf    2001: Fig.A.ps     Current: Fig.A.gif

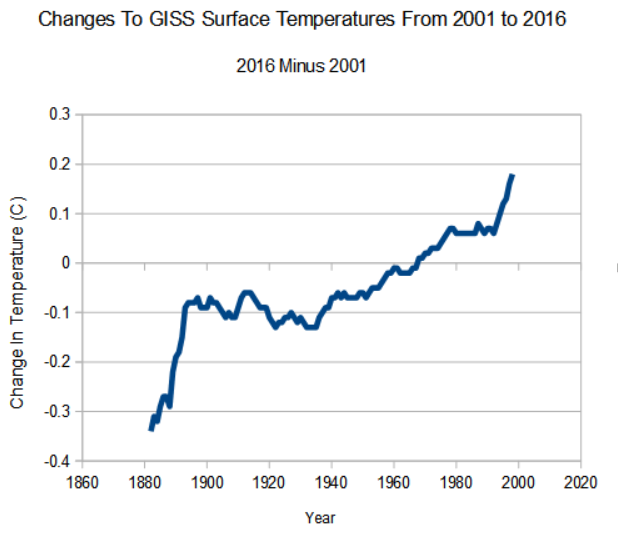
Just since 2001, NASA has increased 1880 to 2000 warming by 0.5 degrees by altering the data.

2016-05-09052912

2001: FigA.txt Current: Fig.A.txt

The next graph superimposes NCAR 1974 at the same scale, and shows how Hansen was already erasing the 19140-1970 cooling in his 1981 version.

2016-05-09054903

NCAR 1974

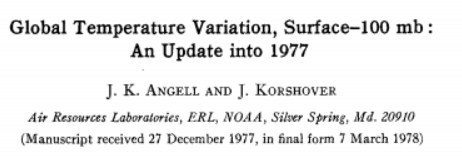
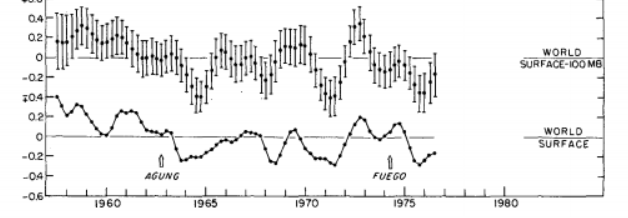
Note above how all of the NASA graphs show renewed warming starting around 1967, yet that warming does not appear in the NCAR graph. Similarly, in 1978 NOAA did not show any surface or troposphere warming through 1977.

2016-05-09063602

2016-05-09062919

Angell NOAA 1978

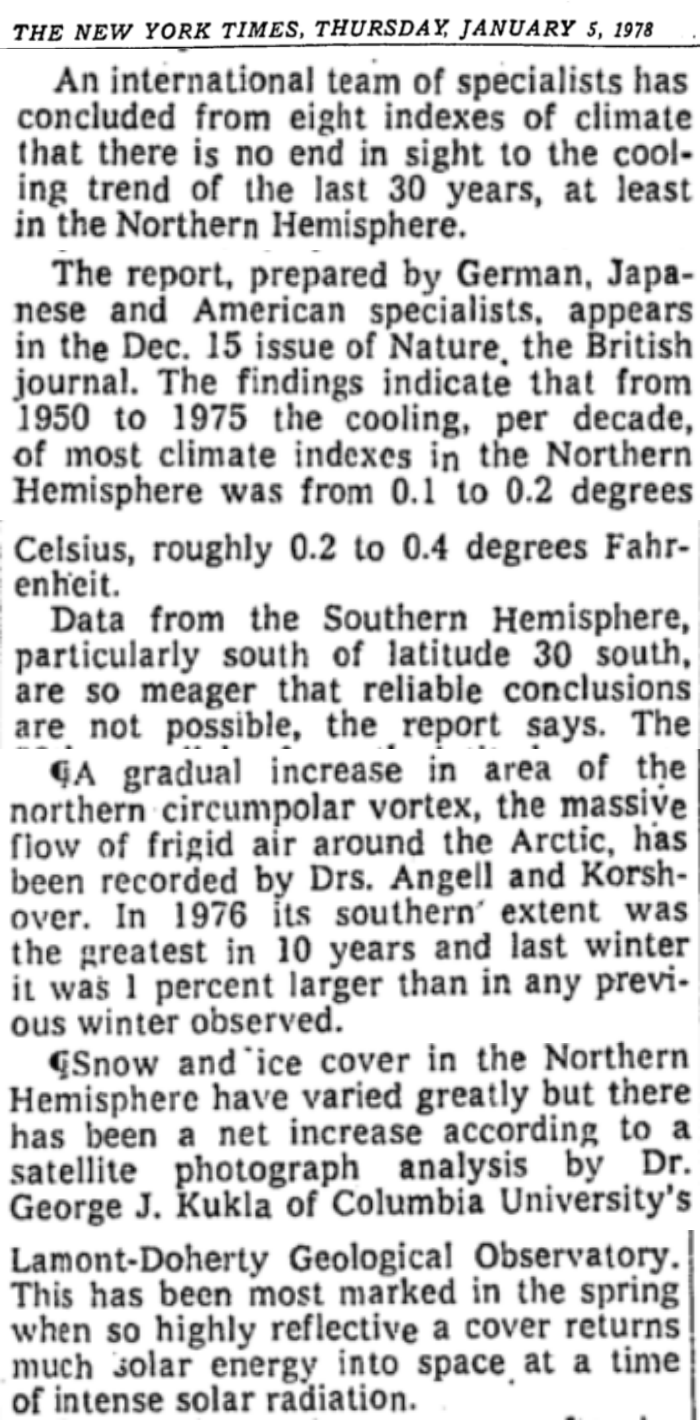
In 1978, it was reported by an international team of specialists that there is “no end in sight to the cooling trend of the last 30 years” They also reported southern hemisphere data was too meager to be reliable, and that the Arctic ice cap was growing. They blamed the expanded polar vortex on global cooling.

2016-05-09065312-down

TimesMachine: January 5, 1978 – NYTimes.com

In Climategate E-mails, the team made clear their desire to manipulate the temperature record and remove the post-1940 cooling.

From: Tom Wigley <[email protected]>
To: Phil Jones <[email protected]>
Subject: 1940s
Date: Sun, 27 Sep 2009 23:25:38 -0600
Cc: Ben Santer <[email protected]>

So, if we could reduce the ocean blip by, say, 0.15 degC,
then this would be significant for the global mean — but
we’d still have to explain the land blip.

It would be good to remove at least part of the 1940s blip, but we are still left with “why the blip”.

di2.nu/foia/1254108338.txt

In another Climategate E-mail, Phil Jones said that much of the southern hemisphere data was “mostly made up.

date: Wed Apr 15 14:29:03 2009
from: Phil Jones <[email protected]> subject: Re: Fwd: Re: contribution to RealClimate.org
to: Thomas Crowley <[email protected]>

Tom,

The issue Ray alludes to is that in addition to the issue
of many more drifters providing measurements over the last
5-10 years, the measurements are coming in from places where
we didn’t have much ship data in the past. For much of the SH between 40 and 60S the normals are mostly made up as there is very little ship data there.

Cheers
Phil

di2.nu/foia/foia2011/mail/2729.txt

It is 100% clear that the NASA temperature record is complete garbage, and that they are simply shaping curves to match the global warming agenda.

Posted in Uncategorized | Leave a comment

Real Climate Science

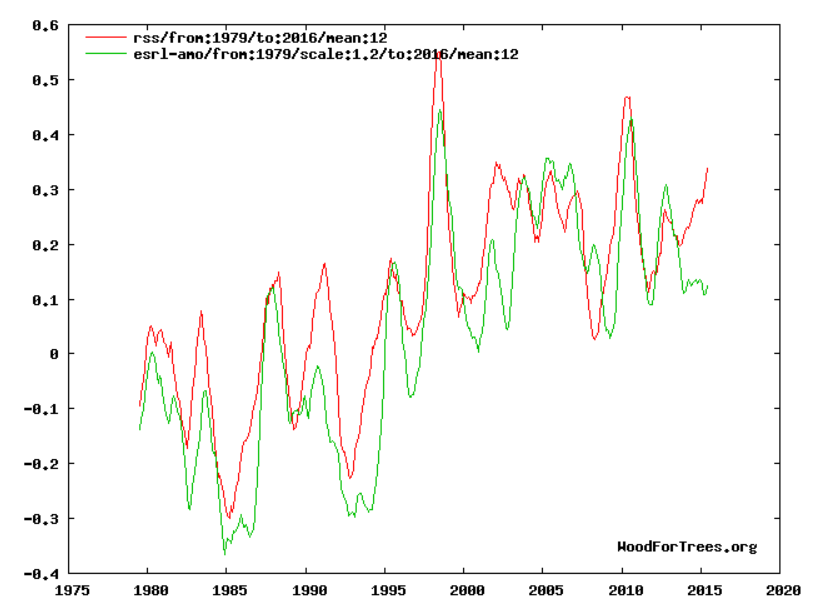
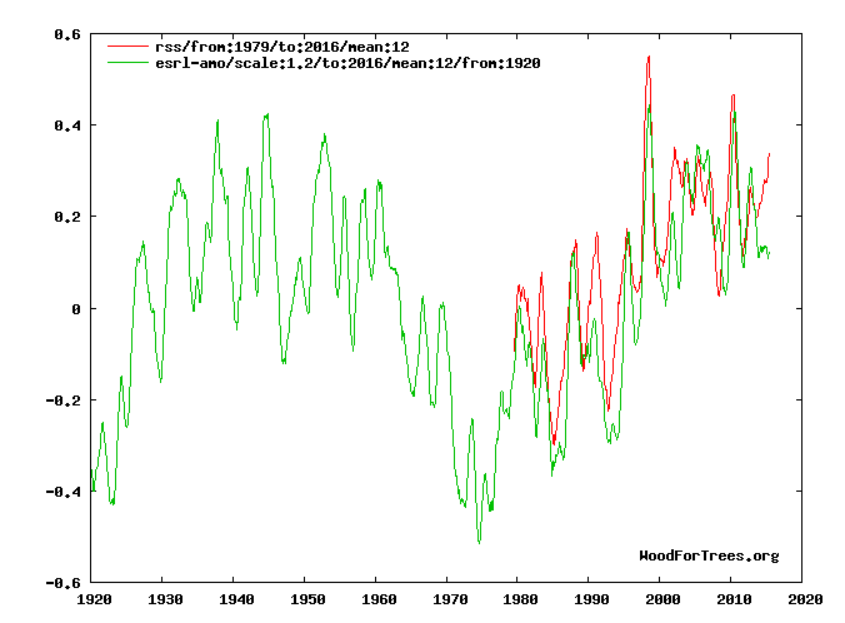
Troposphere temperatures are very closely tied to Atlantic Multidecadal Oscillation (AMO) ocean circulation. The correlation is almost perfect.

2016-05-08065630

Wood for Trees: Interactive Graphs

The name of this web site is realclimatescience.com, though most of the time I am discussing the mind-blowing CO2 junk science which currently pervades academia and government.

However, there are a few real scientists working on climate, and I was fortunate to have spent time with one who actually did understand how the climate worked. Dr. Bill Gray from CSU spent many hours explaining to me how ocean cycles drive the climate, and how they are driven in turn by cyclical changes in ocean salinty. Bill’s theory in a nutshell was that evaporation in the warm, sunny mid-Atlantic increases the salinity of the water there. As the salinity increases, the water becomes increasingly dense and eventually starts to dive down towards the colder sea floor – forcing colder, less saline water to the surface. This process repeats continuously, driving the AMO and other ocean currents. Bill’s success as a tropical meteorologist and hurricane forecaster was largely due to his understanding of the AMO.

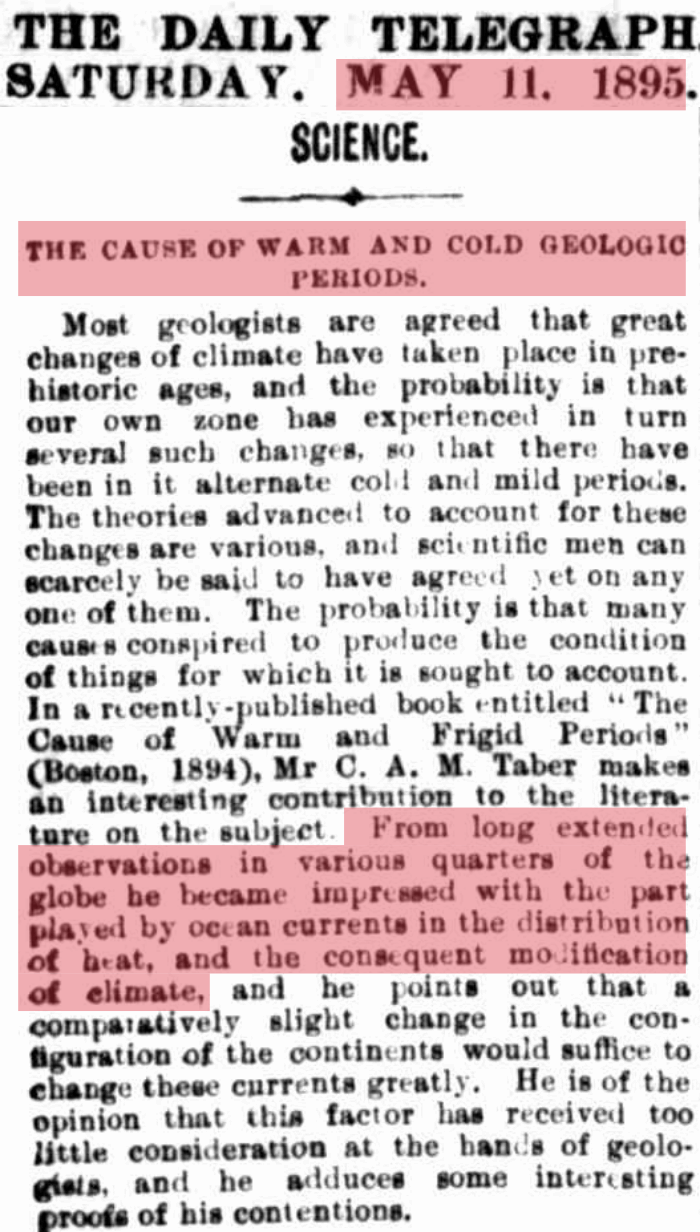
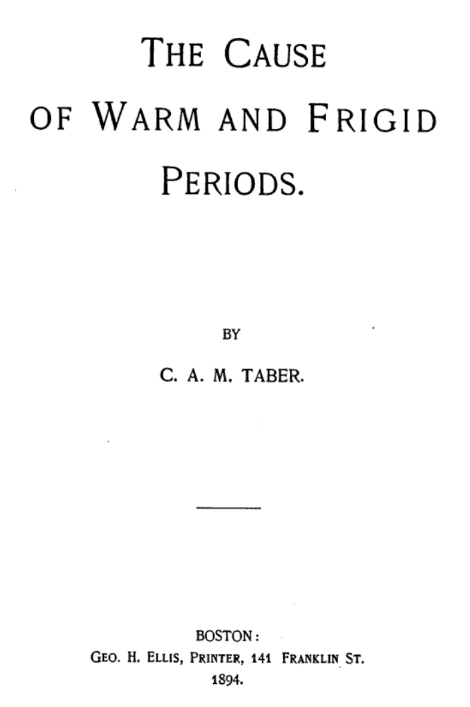
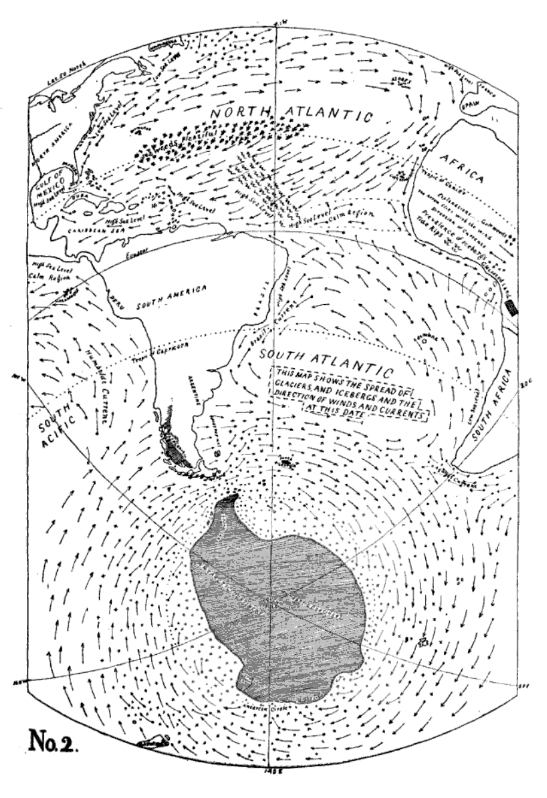
The understanding that ocean circulation drives the climate goes back to 1894, when an ocean traveler wrote a book and published in Scientific American an explanation of the connections. The author did not understand the mechanisms driving the changes in circulation, but he did keenly understand that climate change was driven by changes in ocean circulation.

Screenshot 2016-05-08 at 05.57.16 AM-down

11 May 1895 – SCIENCE. – Trove

Screenshot 2016-05-08 at 06.02.51 AM

Screenshot 2016-05-08 at 06.13.47 AMThe Cause of Warm and Frigid Periods – Charles Austin Mendell Taber
The author believed that changes in ocean circulation were the cause of ice ages, and NOAA still sees the connection.

Models of the ocean and atmosphere that interact with each other indicate that the AMO cycle involves changes in the south-to-north circulation and overturning of water and heat in the Atlantic Ocean. This is the same circulation that we think weakens during ice ages, but in the case of the AMO the changes in circulation are much more subtle than those of the ice ages. The warm Gulf Stream current off the east coast of the United States is part of the Atlantic overturning circulation. When the overturning circulation decreases, the North Atlantic temperatures become cooler.

Physical Oceanography Division –

After President Trump takes over in January, I hope we will see a restoration of science – and an end to the James Hansen/Al Gore driven junk science which has wrecked a generation.

Posted in Uncategorized | Leave a comment

Creating A Legitimate Global Temperature Record

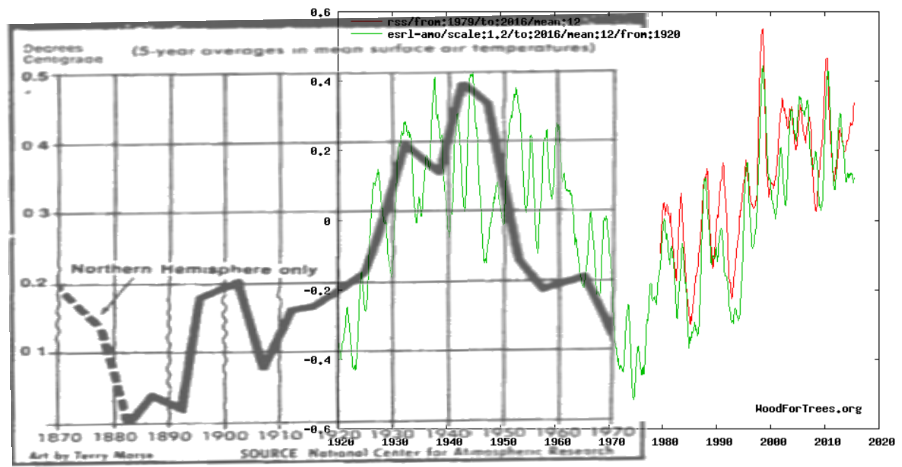
In my previous post, I showed how the AMO (Atlantic Multidecadal Oscillation) correlates with global temperatures.

2016-05-08110456

Wood for Trees: Interactive Graphs

Satellite temperatures only go back to 1979.  It would be nice to make correlations going back further, but the fraudsters at NASA are constantly tampering with the surface temperature record and have turned it into an meaningless political document.

NASA_Fig._A_2001vs2016

2001 version : Fig.A.ps   current version: Fig.A.gif 

NASA has completely erased the 1940-1970 global cooling, which was reported by NCAR and the National Academy of Sciences at the time, and was very well documented.

2016-04-16031015

Hiding The Decline Smoking Gun | Real Science

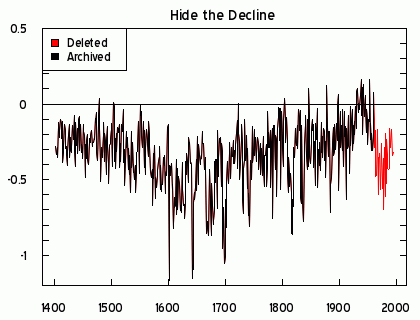
Briffa’s trees also showed the 1940-1970’s cooling, before the climategate team hid the decline.

briffa_recon

briffa_recon.gif (420×320)

NASA temperatures are garbage, but what we can do is use the 1974 NCAR graph for the period prior to 1970. Then it becomes clear that the 1940’s were just as warm as the recent peak around ten years ago, and that there has been no warming for the past 85 years.

2016-05-08112601

The AMO is current dropping, and it seems likely that we are headed into another long cooling period.

Posted in Uncategorized | Leave a comment

Backing Away From The Sea Level Scam

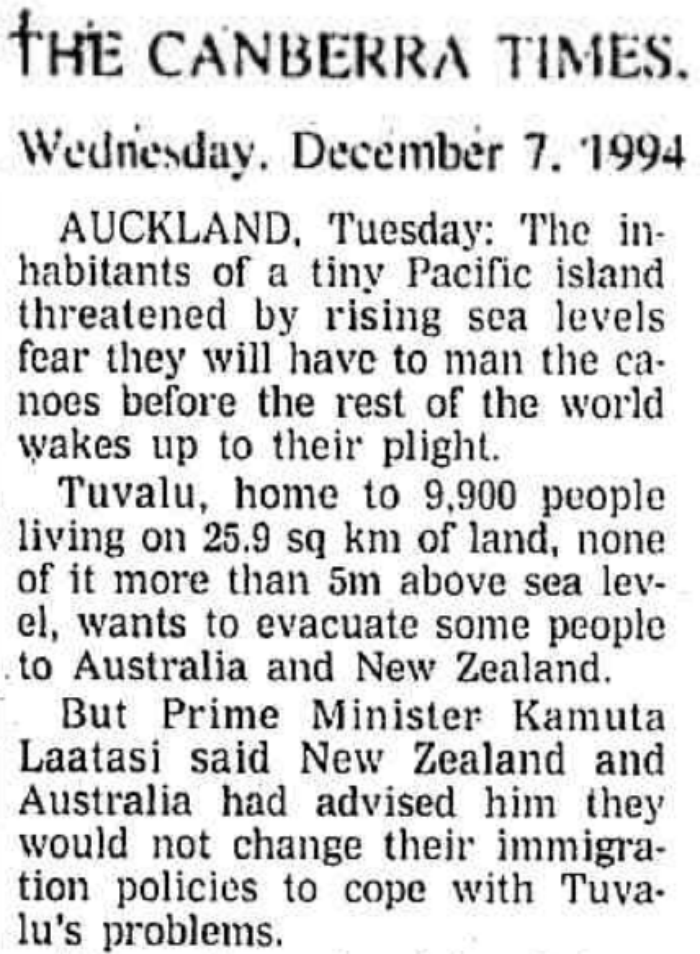
In 1994, the Prime Minister of Tuvalu wanted to evacuate the island to save themselves from rising seas.

2016-05-08161048-down

07 Dec 1994 – Rising sea level: islanders fear it could mean Tuvalu – Trove

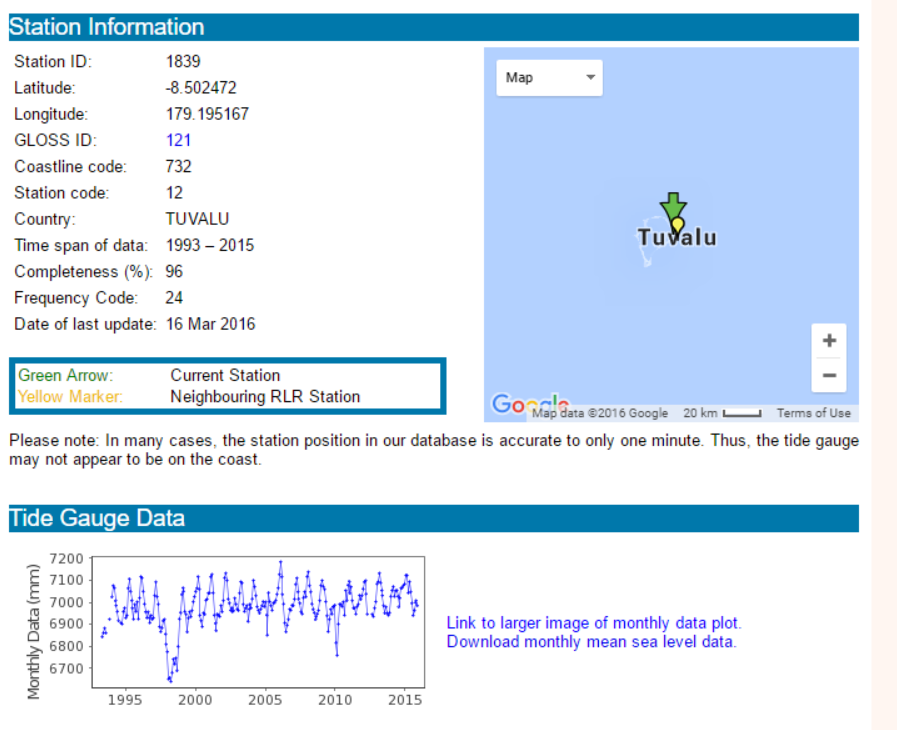
Since then, sea level has hardly changed at Tuvalu.

2016-05-08161223

Data and Station Information for FUNAFUTI B

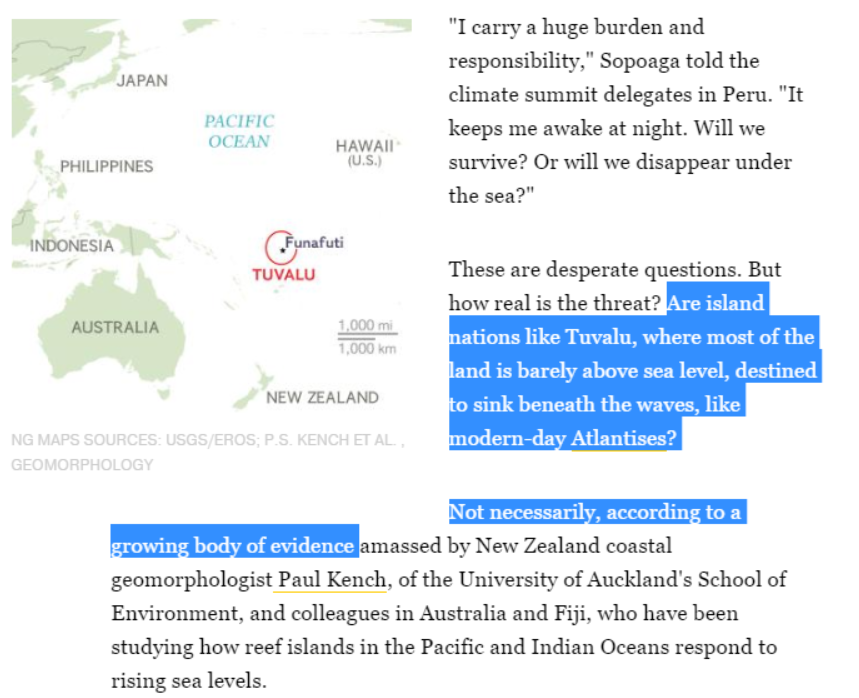
And after decades of hysteria, even National Geographic is starting to back away from the sea level scam.

2016-05-08161822

2016-05-08161831

2016-05-08162024

Will Pacific Island Nations Disappear as Seas Rise? Maybe Not

Like everything else about the climate scam, sea level rise is just one more thing for scientists to lie about in exchange for grant dollars.

Posted in Uncategorized | Leave a comment

Off To Land Of Bernie

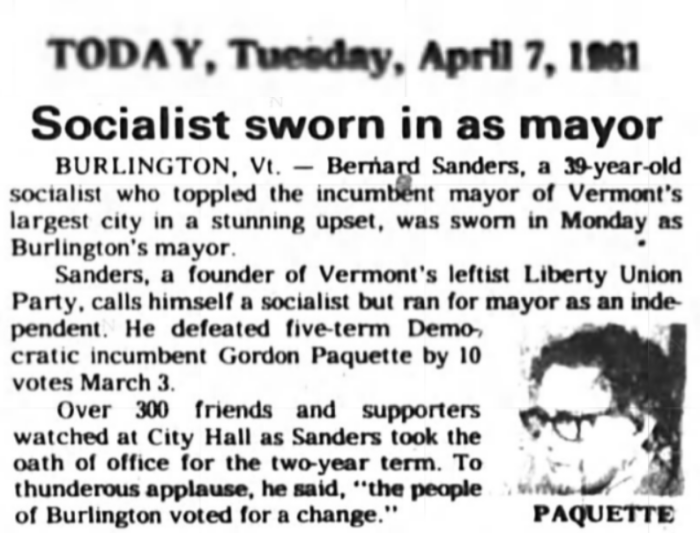
I’m going to be working this summer in Burlington, Vermont – where Bernie launched his war on prosperity 35 years ago.

2016-05-08072958-down

7 Apr 1981, Page 10A – Florida Today at Newspapers.com

It only took the self-proclaimed radical five months in office to get the city to turn against him. Being mayor was his “first real job in years” and he was used to living unemployed without plumbing or electricity, and not being able to pay the rent.

2016-05-08073421-down

, Page 65 – Herald and Review at Newspapers.com

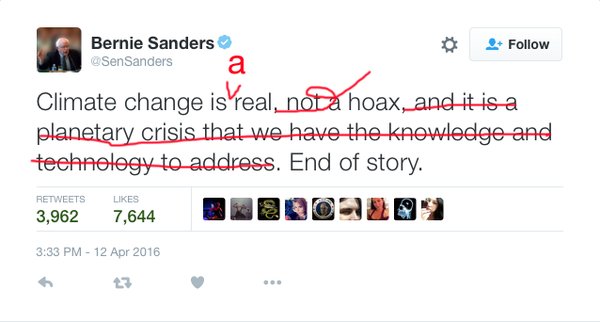
Now this genius wants to take away your plumbing and electricity too, to solve an imaginary climate crisis.

Cf80Y6tVIAAeleI Cgg9j_WUIAI48Au

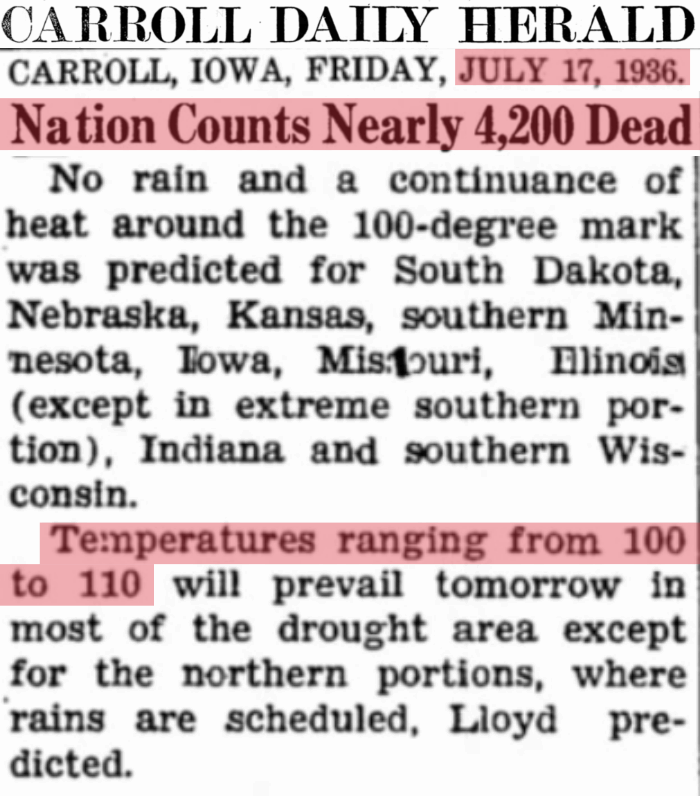
Bernie wants to return the climate to the low CO2 days of 80 years ago.

2016-05-08081051-down

, Page 1 – Carroll Daily Herald at Newspapers.com

Posted in Uncategorized | Leave a comment

Bernie – The Totalitarian

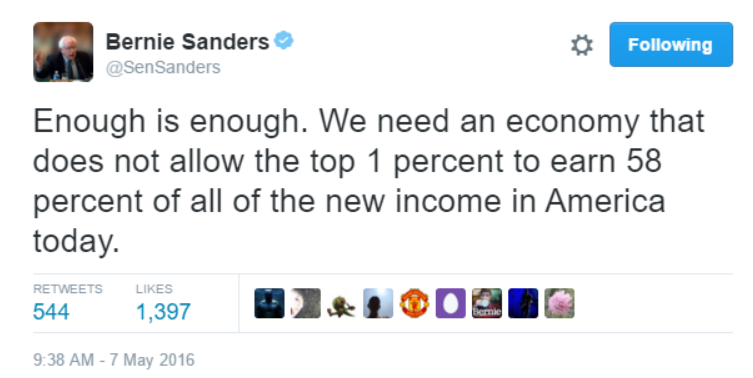
Bernie Sanders says he doesn’t want to “allow” people to succeed.

2016-05-07082301

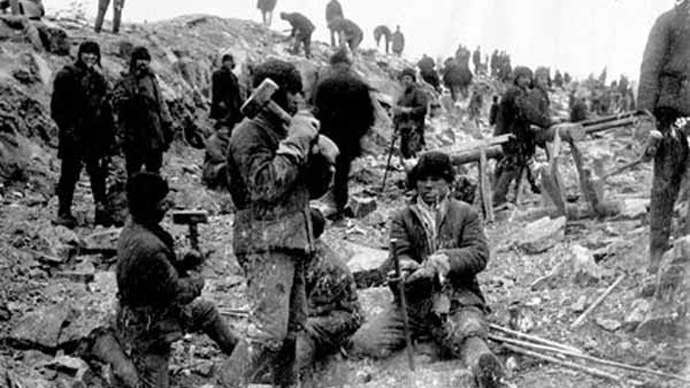
If you want the government to tell you what you can do and how much money you can earn, vote for this Bolshevik terrorist. People like Bernie killed 110 million civilians over the past century, in pursuit of equality and social justice.

3546756878

Posted in Uncategorized | Leave a comment

Pulling Back The Curtain Version 1.7

An exciting new release for Windows and Mac.

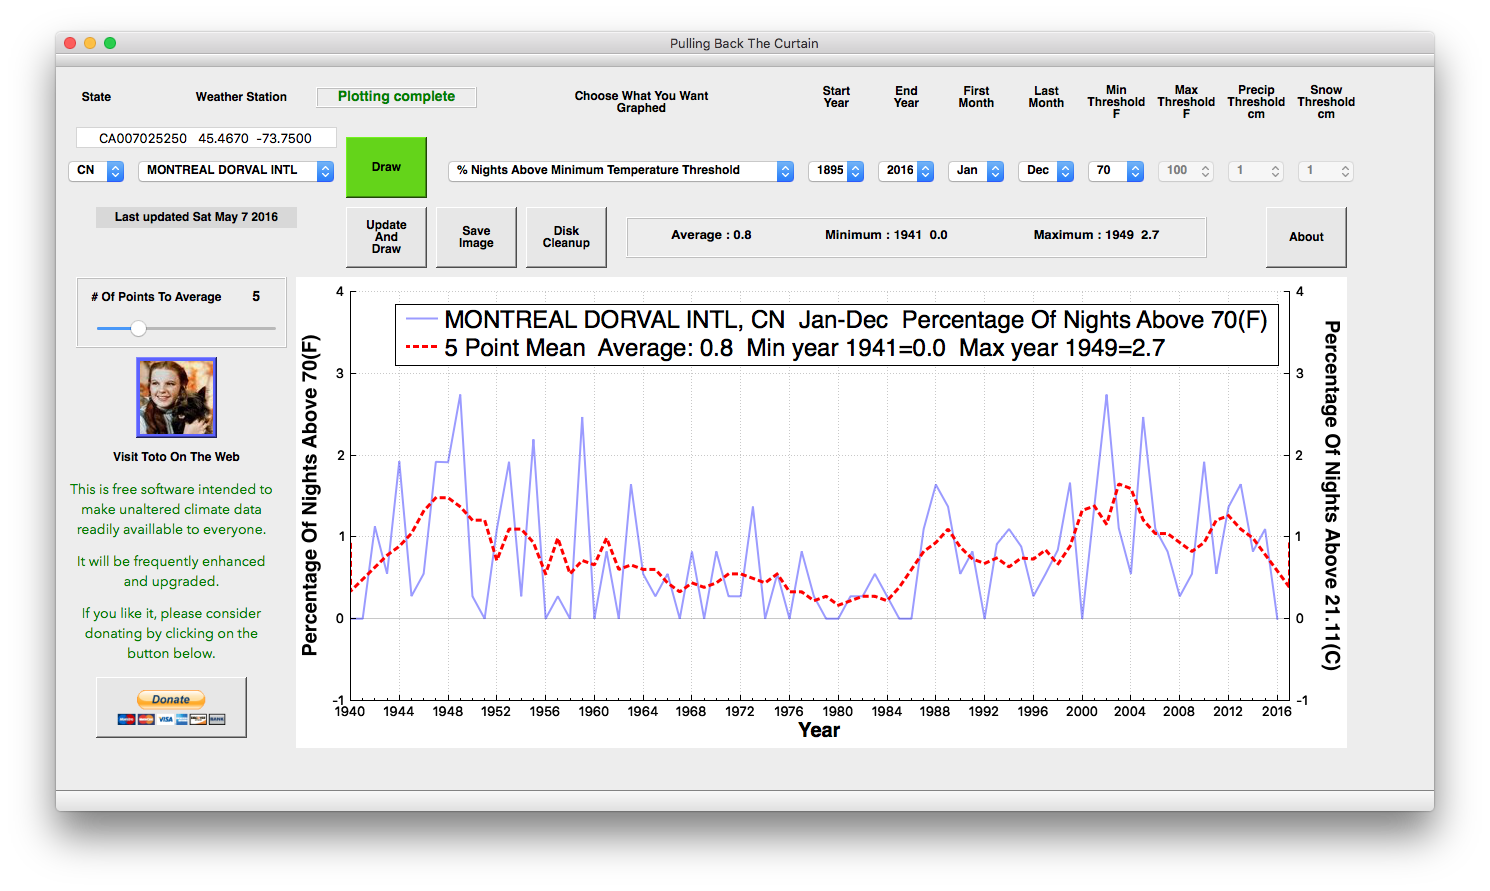
Version 1.7 adds all Canadian (CN) stations, and some UK and Icelandic (IC) stations. It also has a lot of new statistics like the one below.

Screenshot 2016-05-07 at 07.55.01 AM

Mac download :

downloadMac

Windows: download the zip file by clicking here.

2016-02-16-04-38-44

Or alternatively replace these two files in your current Windows directory:

PullingBackTheCurtain.exe          us_stations.txt

As always, the software is completely free and contains nothing nefarious. Some people get warnings from their virus protection extortion software.

Posted in Uncategorized | Leave a comment