Be Careful With Absolute Temperatures

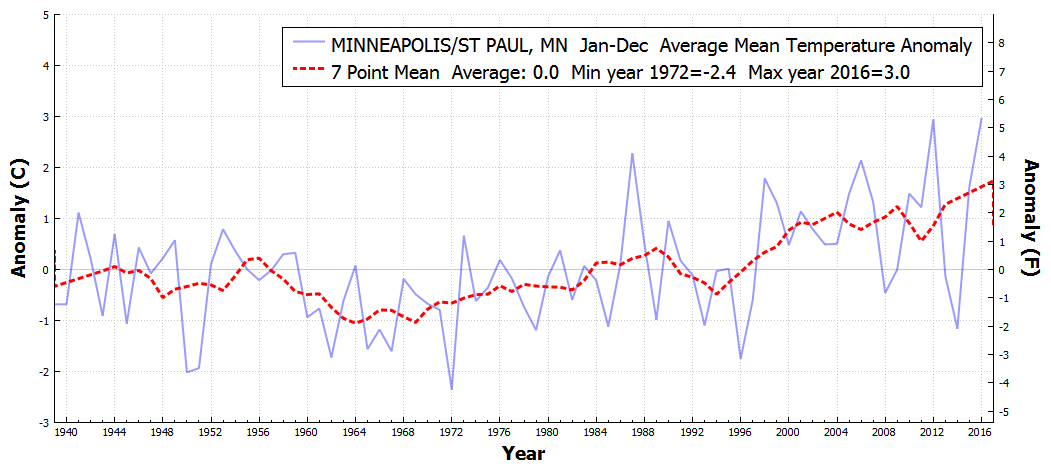
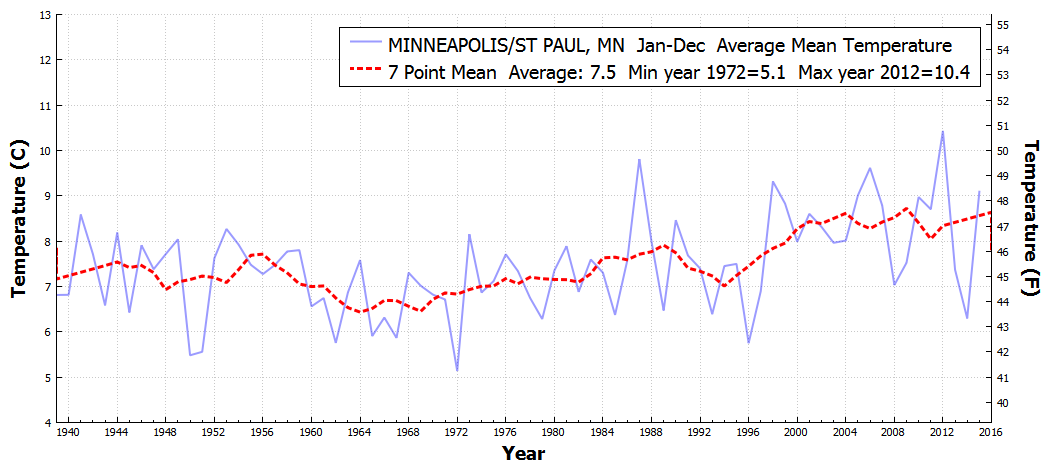
If you plot full year temperatures, 2016 looks cold – because there are no temperatures for summer averaged in. Summer 2016 hasn’t happened yet.

STPAUL_MN_AverageMeanTemperature_Jan_Dec_1940_2016

There are two solutions to this.

  1. Don’t plot the current year.

STPAUL_MN_AverageMeanTemperature_Jan_Dec_1940_2015

2. You can use anomalies instead of absolute temperatures. This is deceptive though because it isn’t representative of the full year either.

STPAUL_MN_AverageMeanTemperatureAnomaly_Jan_Dec_1940_2016

Posted in Uncategorized | Leave a comment

Obama’s NASA – “The Wrong Stuff”

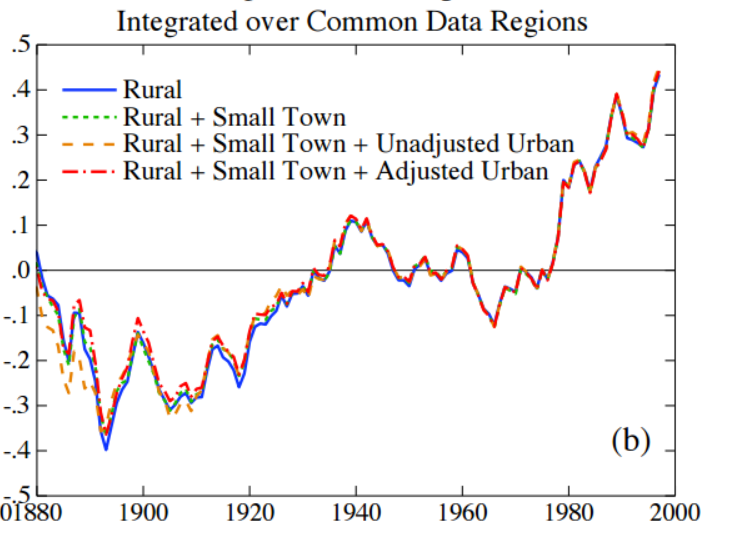
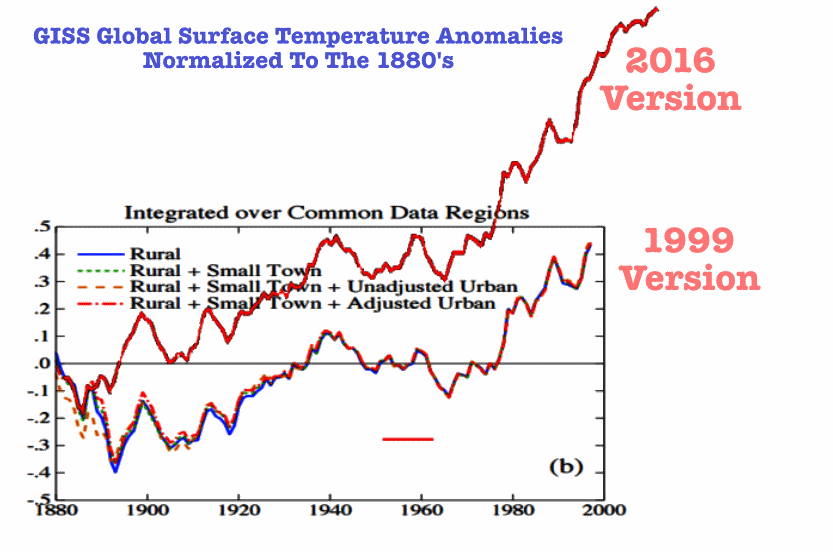
In 1999, NASA published this global temperature graph, showing 0.4C global warming from 1880 to 1997. They also showed that there was very little difference between rural and urban stations, indicating a high degree of confidence in their data.

2016-05-12052834

2016-05-11214844

1999_Hansen_etal_1.pdf

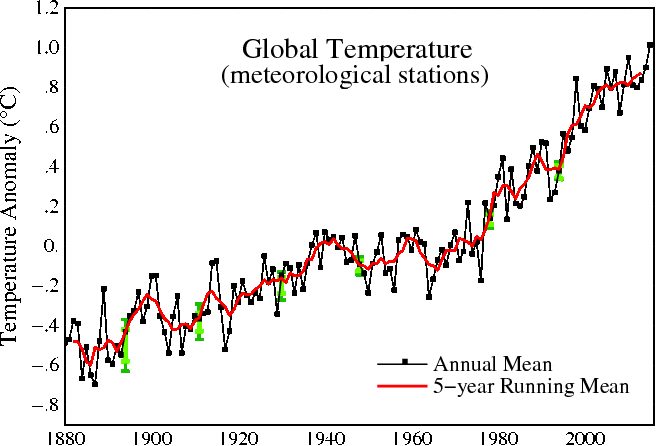
NASA’s current version of the same graph looks very different, showing about 1.0C global warming from 1880 to 1997. By altering the data they have more than doubled the amount of warming during the same time period.

Fig.A-7

I overlaid the two graphs at the same scale, and normalized to the earliest years. This shows how NASA has massively altered their graphs since 1999 to create a completely fake hockey stick of warming – which does not exist.

2016-05-12051413

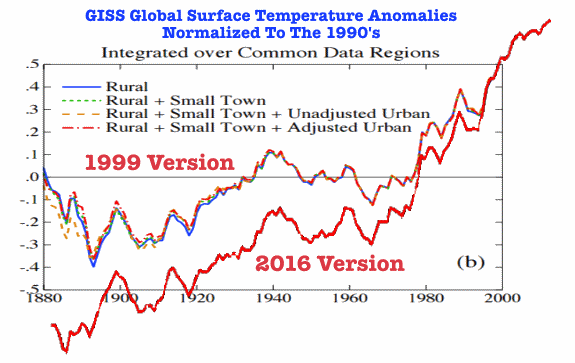
An alternative view of this normalizes to the most recent common years, the 1990’s. This view shows how they made the 1940’s spike disappear since 1990.

2016-05-12080522

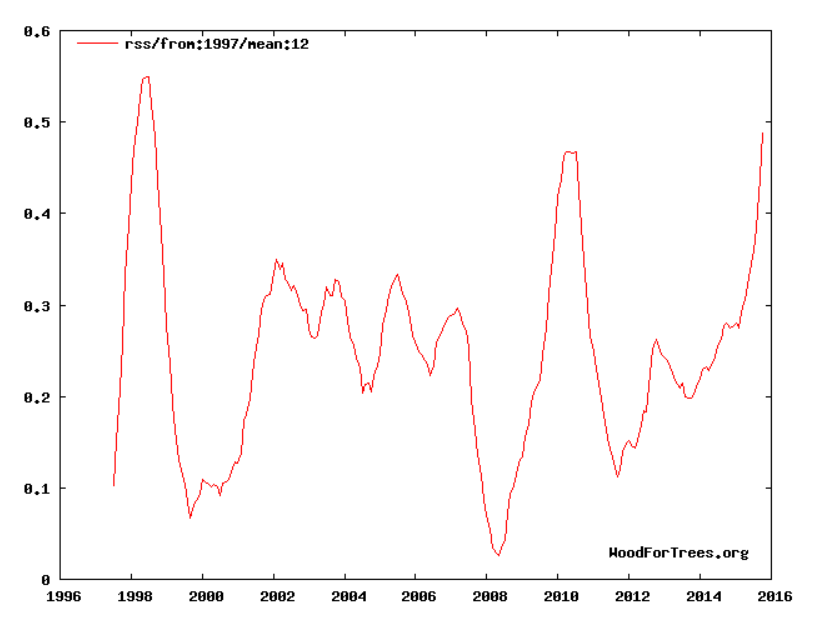
The fraud doesn’t end in 1997 though. NASA continues to show rapid warming after 1997, which is not present in the satellite temperature record.

2016-05-12054845Wood for Trees: Interactive Graphs

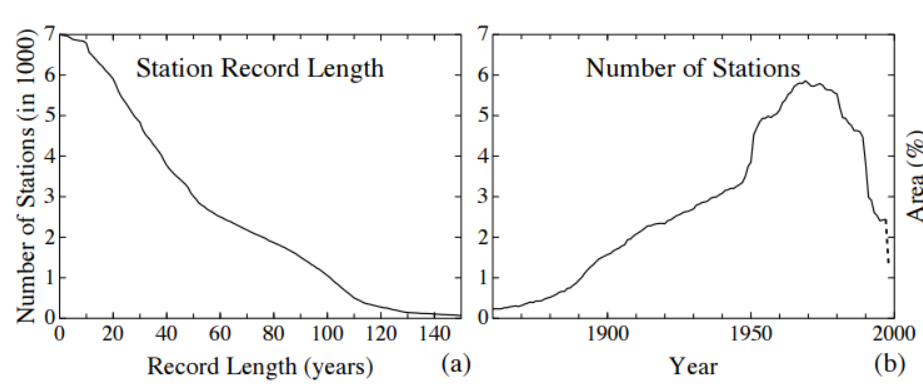
The next graph from the 1999 paper shows what is going on. The number of stations NASA is using has plummeted since the 1970’s. They are losing rural stations, causing the temperature record to be driven by urban stations – which are much warmer.

2016-05-12053554

NASA is engaged in transparently political junk science, which motivated  the astronauts, engineers and scientists  who made NASA great in past decades to send the NASA administrator this angry letter in 2012. Signatories included the only scientist to have walked on the moon, Harrison Schmitt.

March 28, 2012

The Honorable Charles Bolden, Jr.
NASA Administrator
NASA Headquarters
Washington, D.C. 20546-0001

Dear Charlie,

We, the undersigned, respectfully request that NASA and the Goddard Institute for Space Studies (GISS) refrain from including unproven remarks in public releases and websites. We believe the claims by NASA and GISS, that man-made carbon dioxide is having a catastrophic impact on global climate change are not substantiated, especially when considering thousands of years of empirical data. With hundreds of well-known climate scientists and tens of thousands of other scientists publicly declaring their disbelief in the catastrophic forecasts, coming particularly from the GISS leadership, it is clear that the science is NOT settled.

The unbridled advocacy of CO2 being the major cause of climate change is unbecoming of NASA’s history of making an objective assessment of all available scientific data prior to making decisions or public statements.

As former NASA employees, we feel that NASA’s advocacy of an extreme position, prior to a thorough study of the possible overwhelming impact of natural climate drivers is inappropriate. We request that NASA refrain from including unproven and unsupported remarks in its future releases and websites on this subject. At risk is damage to the exemplary reputation of NASA, NASA’s current or former scientists and employees, and even the reputation of science itself.

For additional information regarding the science behind our concern, we recommend that you contact Harrison Schmitt or Walter Cunningham, or others they can recommend to you.

Thank you for considering this request.

Sincerely,

(Attached signatures)

CC: Mr. John Grunsfeld, Associate Administrator for Science

CC: Ass Mr. Chris Scolese, Director, Goddard Space Flight Center

Ref: Letter to NASA Administrator Charles Bolden, dated 3-26-12, regarding a request for NASA to refrain from making unsubstantiated claims that human produced CO2 is having a catastrophic impact on climate change.

/s/ Jack Barneburg, Jack – JSC, Space Shuttle Structures, Engineering Directorate, 34 years

/s/ Larry Bell – JSC, Mgr. Crew Systems Div., Engineering Directorate, 32 years

/s/ Dr. Donald Bogard – JSC, Principal Investigator, Science Directorate, 41 years

/s/ Jerry C. Bostick – JSC, Principal Investigator, Science Directorate, 23 years

/s/ Dr. Phillip K. Chapman – JSC, Scientist – astronaut, 5 years

/s/ Michael F. Collins, JSC, Chief, Flight Design and Dynamics Division, MOD, 41 years

/s/ Dr. Kenneth Cox – JSC, Chief Flight Dynamics Div., Engr. Directorate, 40 years

/s/ Walter Cunningham – JSC, Astronaut, Apollo 7, 8 years

/s/ Dr. Donald M. Curry – JSC, Mgr. Shuttle Leading Edge, Thermal Protection Sys., Engr. Dir., 44 years

/s/ Leroy Day – Hdq. Deputy Director, Space Shuttle Program, 19 years

/s/ Dr. Henry P. Decell, Jr. – JSC, Chief, Theory & Analysis Office, 5 years

/s/Charles F. Deiterich – JSC, Mgr., Flight Operations Integration, MOD, 30 years

/s/ Dr. Harold Doiron – JSC, Chairman, Shuttle Pogo Prevention Panel, 16 years

/s/ Charles Duke – JSC, Astronaut, Apollo 16, 10 years

/s/ Anita Gale

/s/ Grace Germany – JSC, Program Analyst, 35 years

/s/ Ed Gibson – JSC, Astronaut Skylab 4, 14 years

/s/ Richard Gordon – JSC, Astronaut, Gemini Xi, Apollo 12, 9 years

/s/ Gerald C. Griffin – JSC, Apollo Flight Director, and Director of Johnson Space Center, 22 years

/s/ Thomas M. Grubbs – JSC, Chief, Aircraft Maintenance and Engineering Branch, 31 years

/s/ Thomas J. Harmon

/s/ David W. Heath – JSC, Reentry Specialist, MOD, 30 years

/s/ Miguel A. Hernandez, Jr. – JSC, Flight crew training and operations, 3 years

/s/ James R. Roundtree – JSC Branch Chief, 26 years

/s/ Enoch Jones – JSC, Mgr. SE&I, Shuttle Program Office, 26 years

/s/ Dr. Joseph Kerwin – JSC, Astronaut, Skylab 2, Director of Space and Life Sciences, 22 years

/s/ Jack Knight – JSC, Chief, Advanced Operations and Development Division, MOD, 40 years

/s/ Dr. Christopher C. Kraft – JSC, Apollo Flight Director and Director of Johnson Space Center, 24 years

/s/ Paul C. Kramer – JSC, Ass.t for Planning Aeroscience and Flight Mechanics Div., Egr. Dir., 34 years

/s/ Alex (Skip) Larsen

/s/ Dr. Lubert Leger – JSC, Ass’t. Chief Materials Division, Engr. Directorate, 30 years

/s/ Dr. Humbolt C. Mandell – JSC, Mgr. Shuttle Program Control and Advance Programs, 40 years

/s/ Donald K. McCutchen – JSC, Project Engineer – Space Shuttle and ISS Program Offices, 33 years

/s/ Thomas L. (Tom) Moser – Hdq. Dep. Assoc. Admin. & Director, Space Station Program, 28 years

/s/ Dr. George Mueller – Hdq., Assoc. Adm., Office of Space Flight, 6 years

/s/ Tom Ohesorge

/s/ James Peacock – JSC, Apollo and Shuttle Program Office, 21 years

/s/ Richard McFarland – JSC, Mgr. Motion Simulators, 28 years

/s/ Joseph E. Rogers – JSC, Chief, Structures and Dynamics Branch, Engr. Directorate,40 years

/s/ Bernard J. Rosenbaum – JSC, Chief Engineer, Propulsion and Power Division, Engr. Dir., 48 years

/s/ Dr. Harrison (Jack) Schmitt – JSC, Astronaut Apollo 17, 10 years

/s/ Gerard C. Shows – JSC, Asst. Manager, Quality Assurance, 30 years

/s/ Kenneth Suit – JSC, Ass’t Mgr., Systems Integration, Space Shuttle, 37 years

/s/ Robert F. Thompson – JSC, Program Manager, Space Shuttle, 44 years/s/ Frank Van Renesselaer – Hdq., Mgr. Shuttle Solid Rocket Boosters, 15 years

/s/ Dr. James Visentine – JSC Materials Branch, Engineering Directorate, 30 years

/s/ Manfred (Dutch) von Ehrenfried – JSC, Flight Controller; Mercury, Gemini & Apollo, MOD, 10 years

/s/ George Weisskopf – JSC, Avionics Systems Division, Engineering Dir., 40 years

/s/ Al Worden – JSC, Astronaut, Apollo 15, 9 years

/s/ Thomas (Tom) Wysmuller – JSC, Meteorologist, 5 years

NASA Scientists Dispute Climate Change – Business Insider

Posted in Uncategorized | Leave a comment

For Trump

I don’t live in the Bambi world of “ethical conservatives.” Either we protect the second Amendment, or we don’t.

2016-05-12120239

It is time for National Review to grow up.

ForTrump

Posted in Uncategorized | Leave a comment

Pulling Back The Curtain Version 1.9

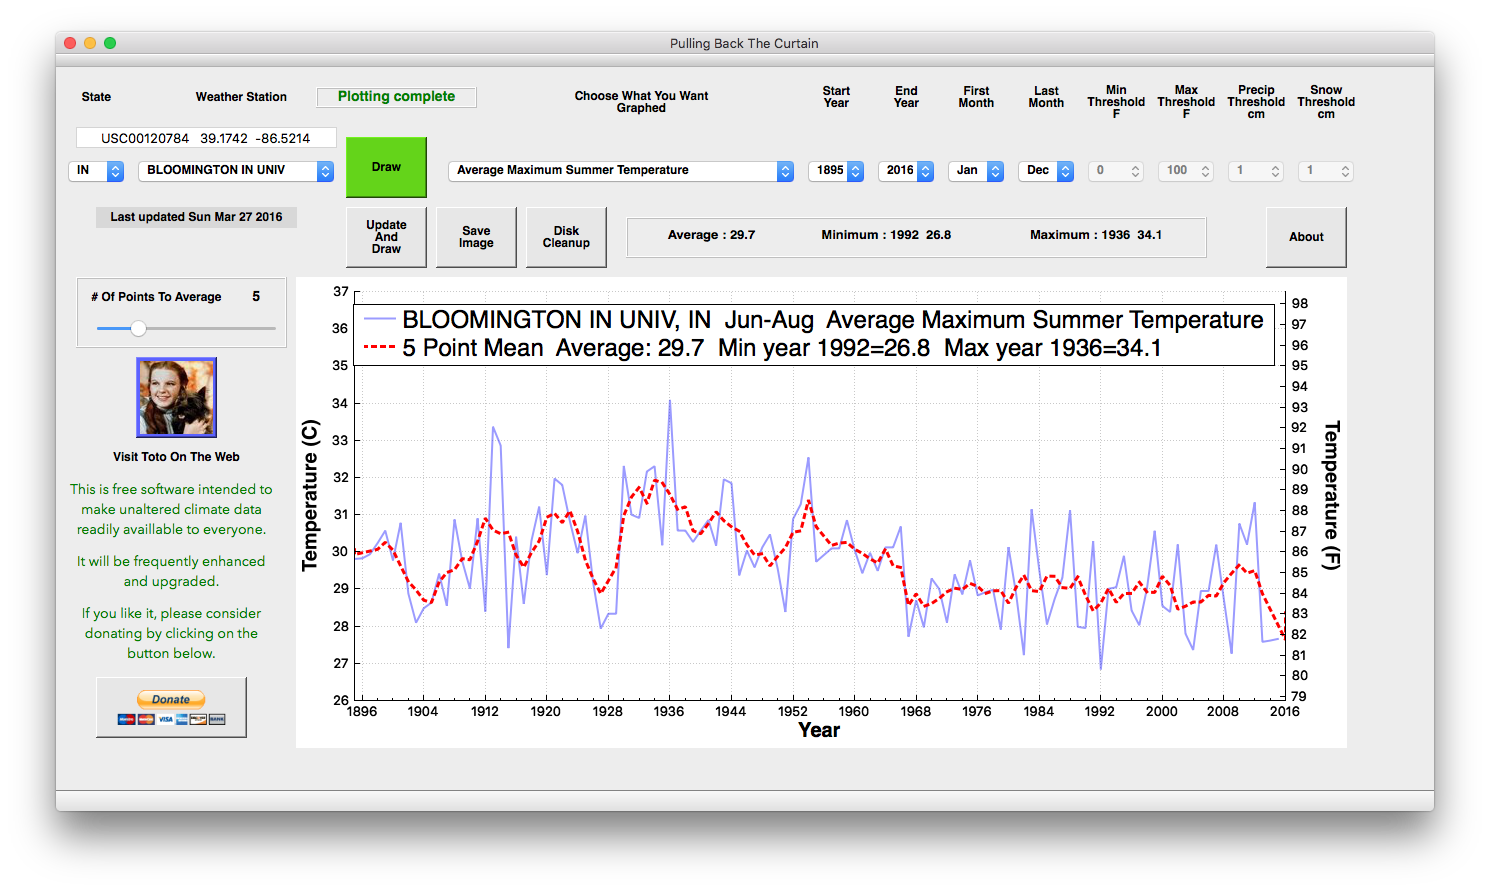
A new release for Windows and Mac. Version 1.9 adds average mean, minimum and maximum temperatures for all seasons.

Screenshot 2016-05-12 at 07.38.02 AM

Mac download :

downloadMac

Windows: download the zip file by clicking here.

2016-02-16-04-38-44

Or alternatively replace this file in your current Windows directory:

PullingBackTheCurtain.exe

As always, the software is completely free and contains nothing nefarious. Some people get warnings from their virus protection extortion software.

Posted in Uncategorized | Leave a comment

Reducing CO2 – To Save The Climate

It doesn’t matter how beautiful your theory is, it doesn’t matter how smart you are. If it doesn’t agree with experiment, it’s wrong.

  • Richard P. Feynman

Climate experts like James Hansen tell us that we need to reduce CO2 to prevent natural disasters. That theory is easy enough to test, because CO2 levels used to be lower, and we know what the climate was like at 305 PPM CO2.

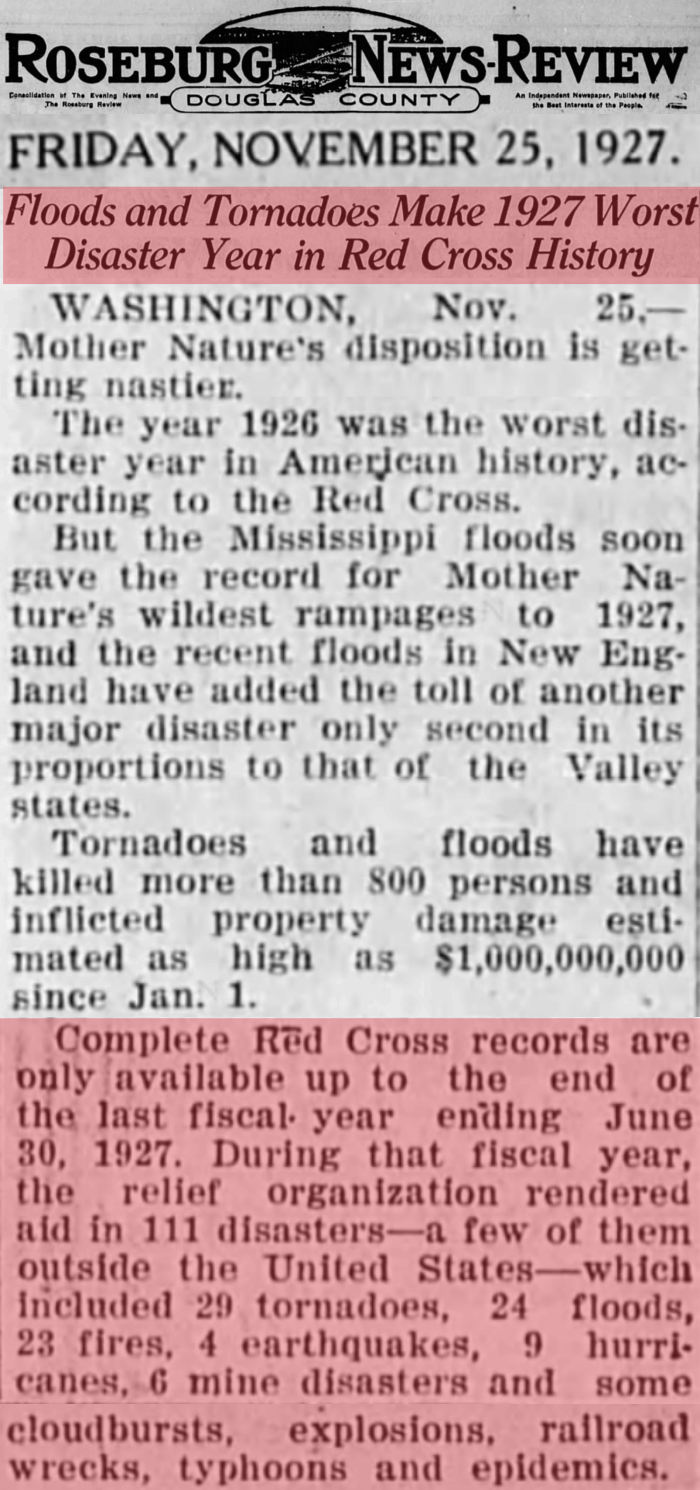
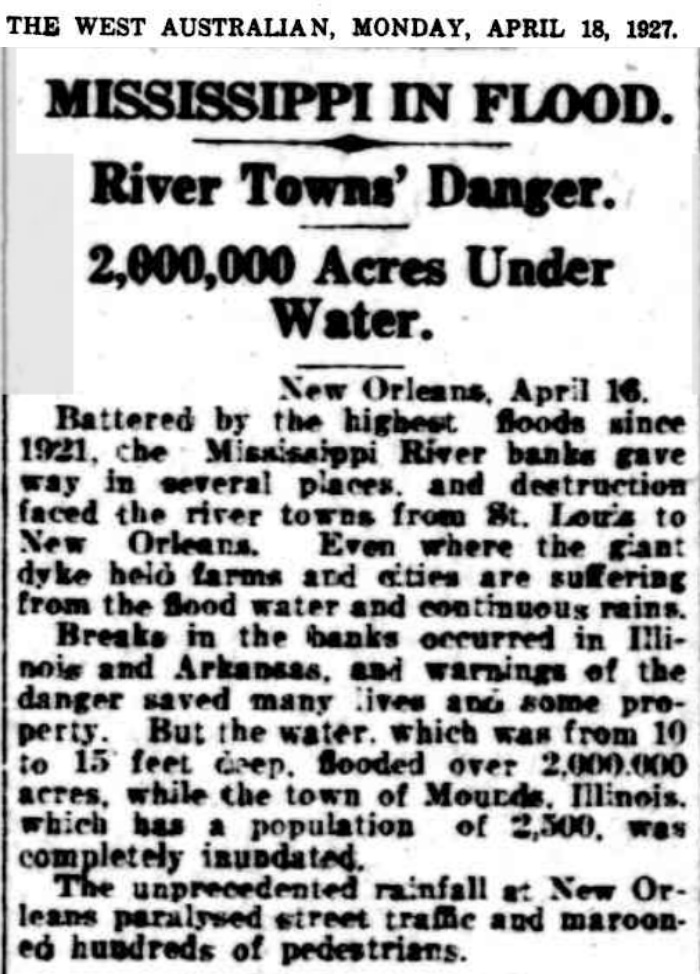
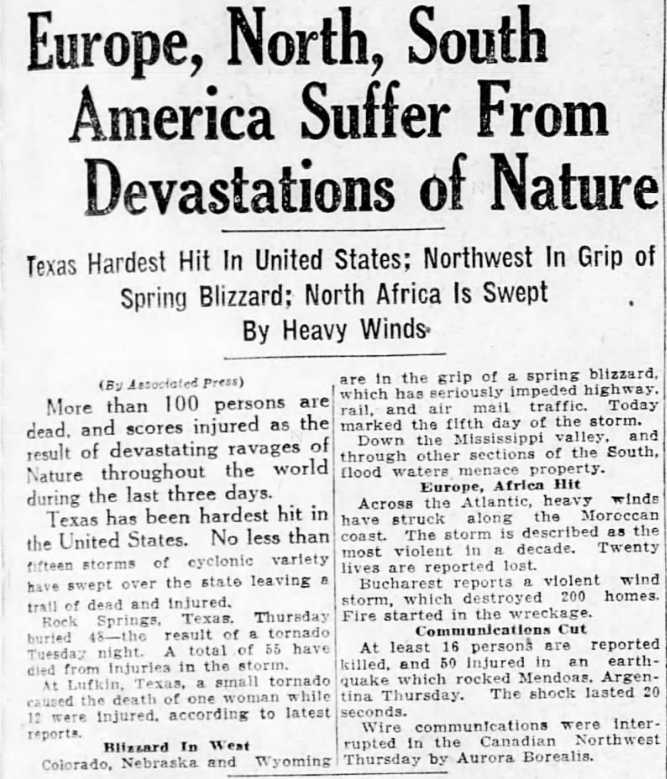
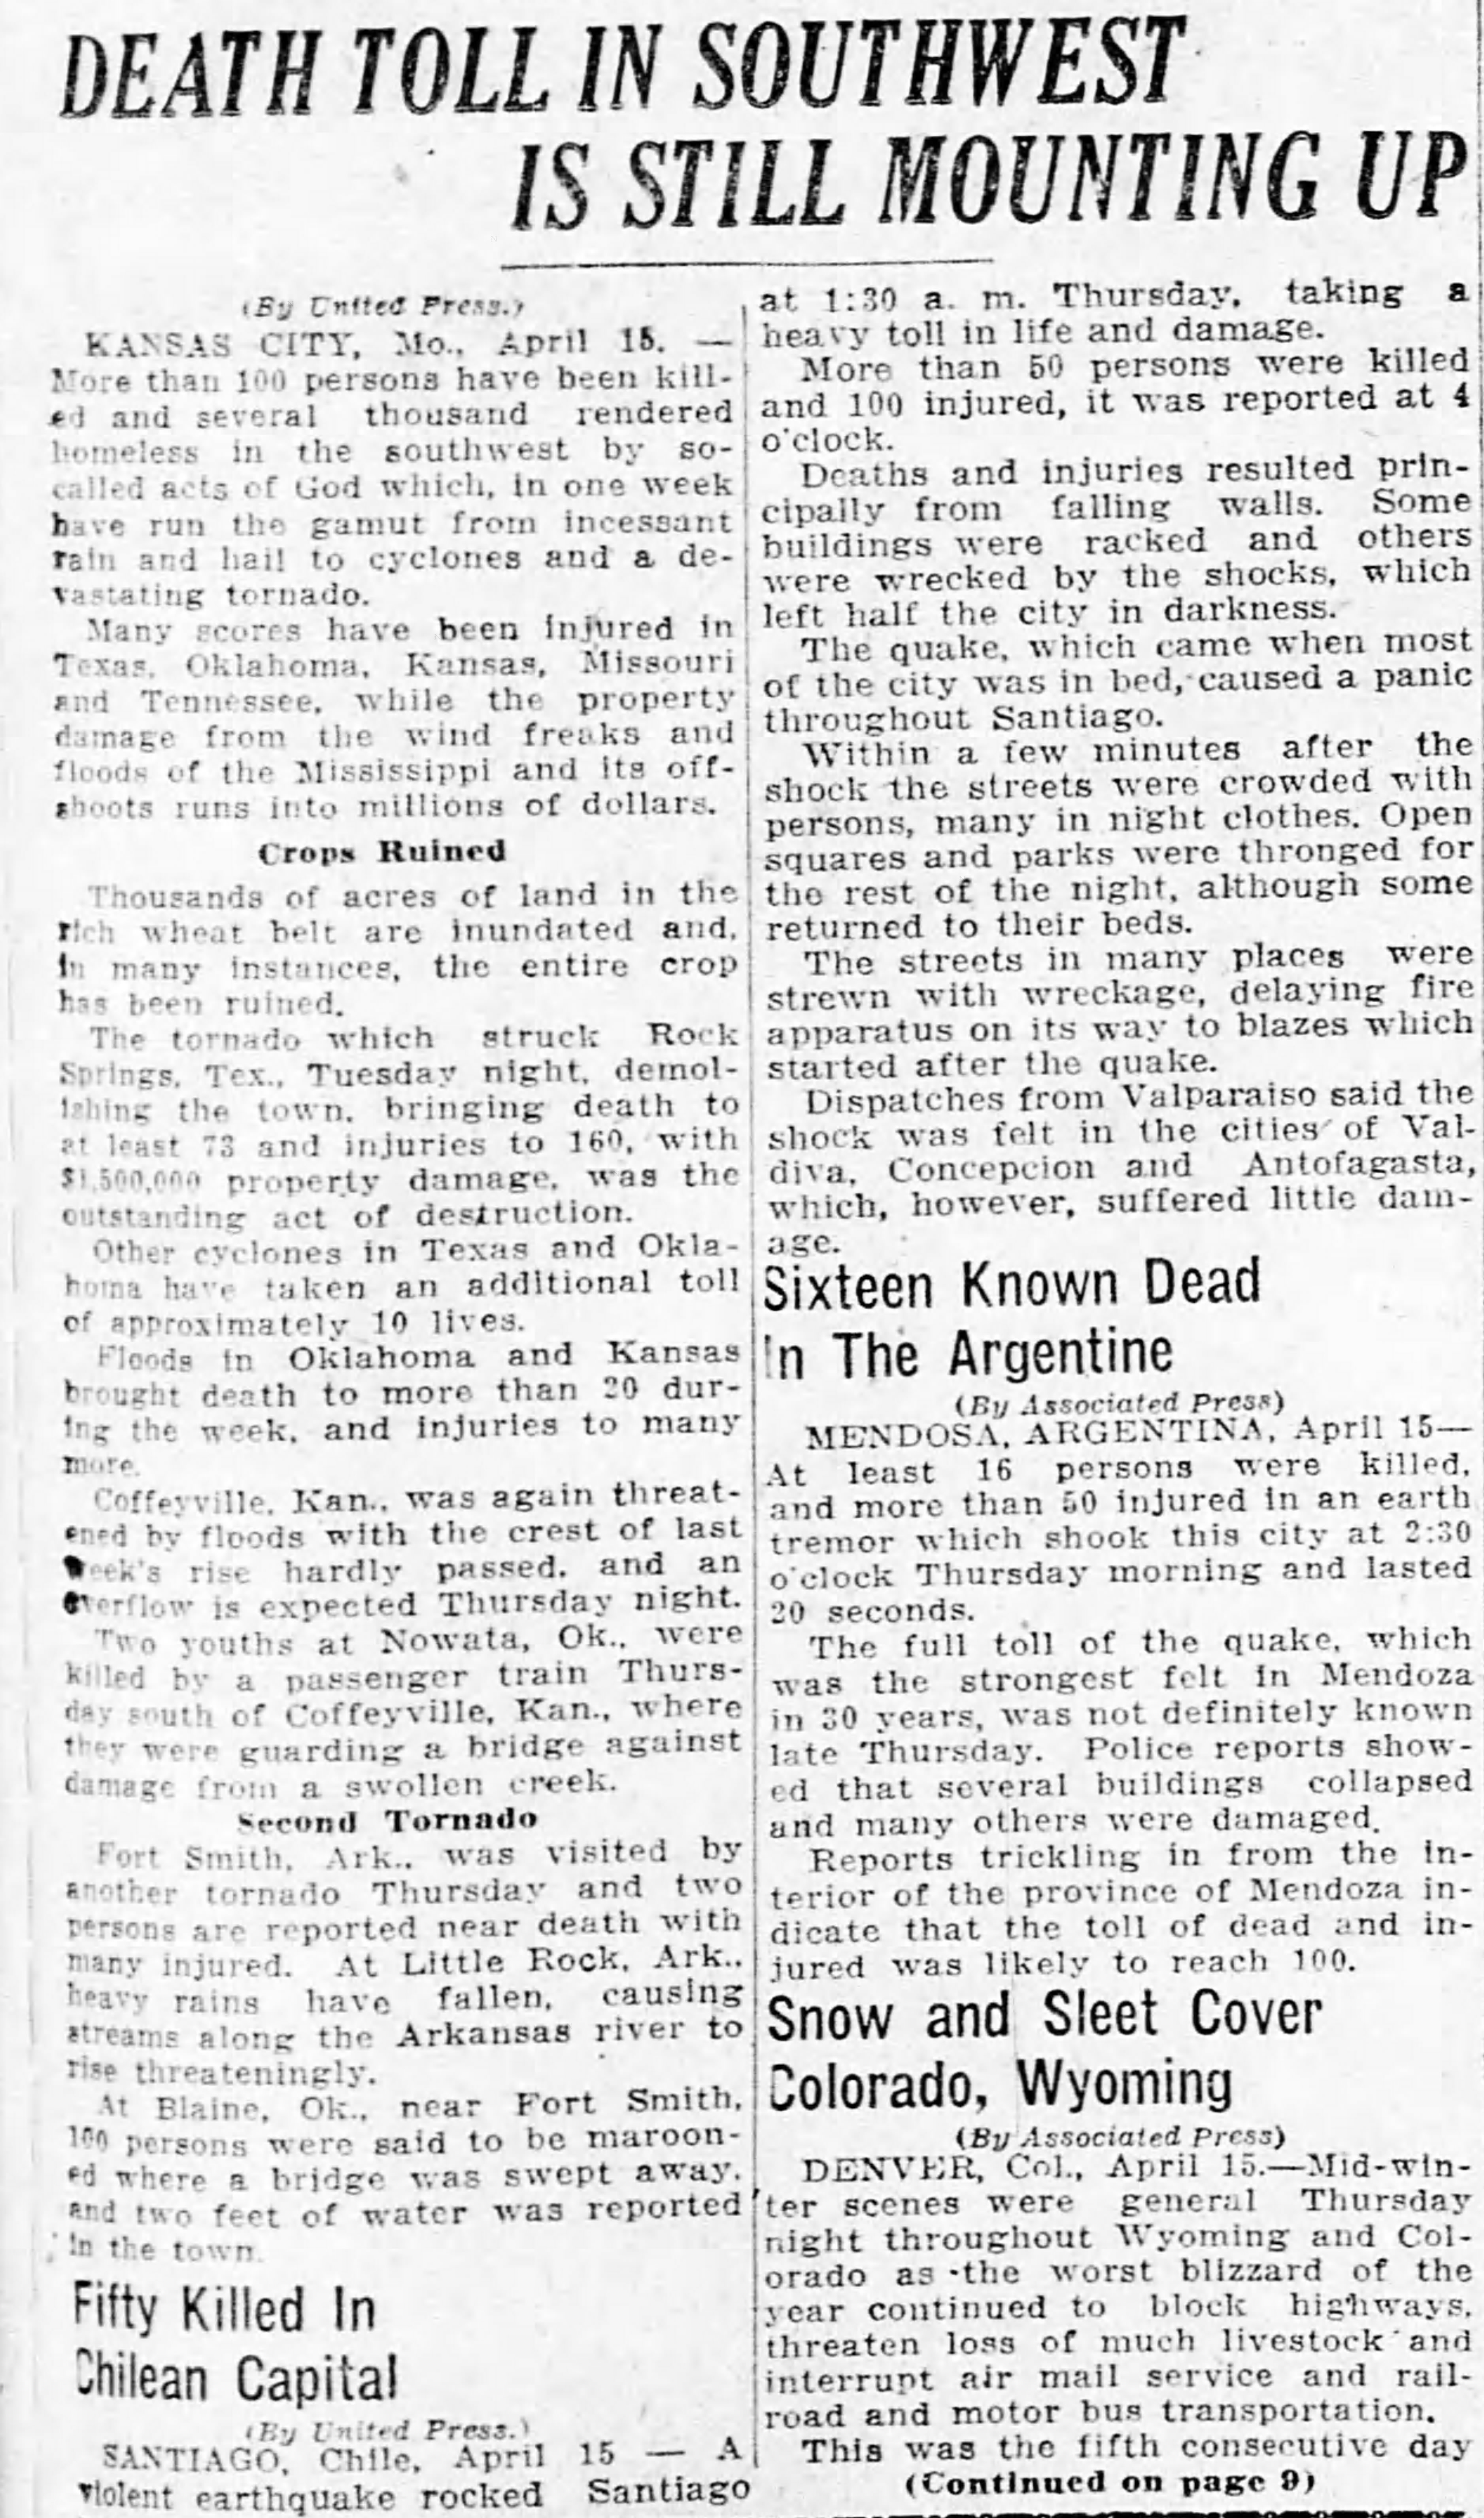
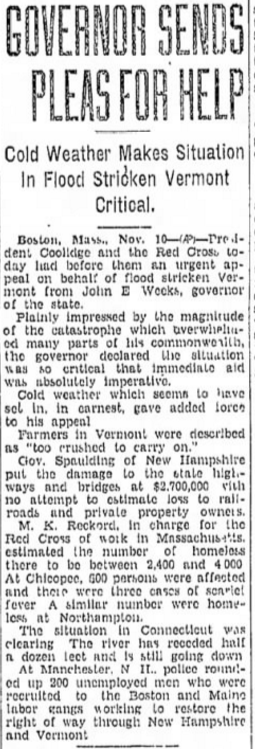
All indications are that the climate was much more extreme at lower levels of CO2. The years 1926 and 1927 brought almost daily catastrophes to the world, including the worst Mississippi River floods on record, and the worst floods in Vermont history.

2016-05-11061945-down

25 Nov 1927, Page 7

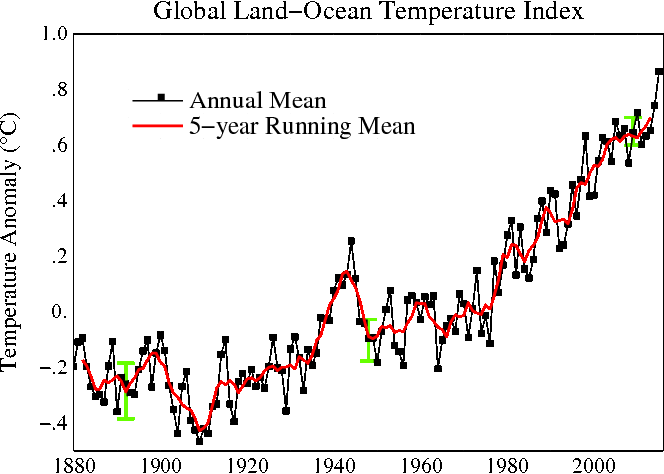
According to NASA, 1927 was one of the coldest years on record.

Fig.A2

Fig.A2.gif (664×474)

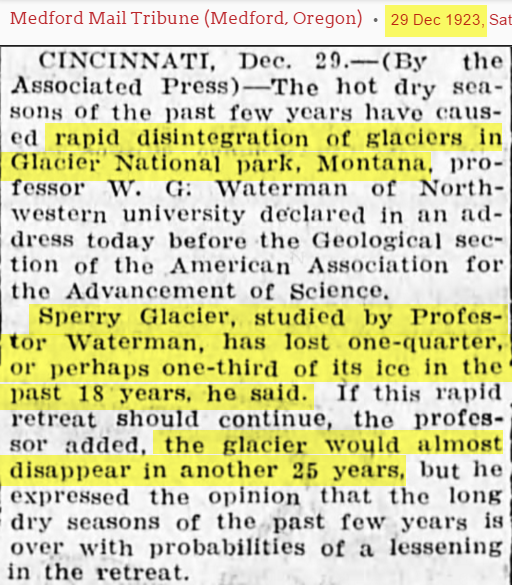
Glaciers were rapidly disappearing, and experts predicted that Glacier National Park would lose its glaciers by 1950.

2015-11-13-15-01-37

29 Dec 1923, Page 5

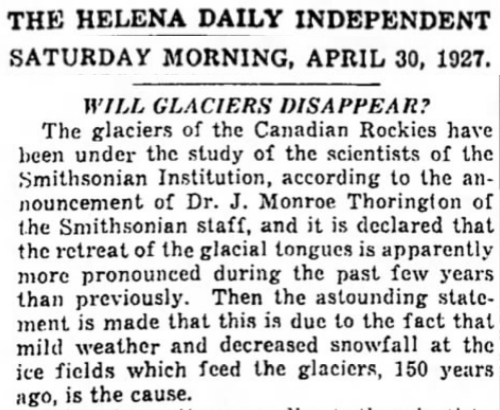
Canada’s glaciers were disappearing.

Screenshot 2016-01-25 at 04.01.13 AM-down

30 Apr 1927, Page 5 – at Newspapers.com

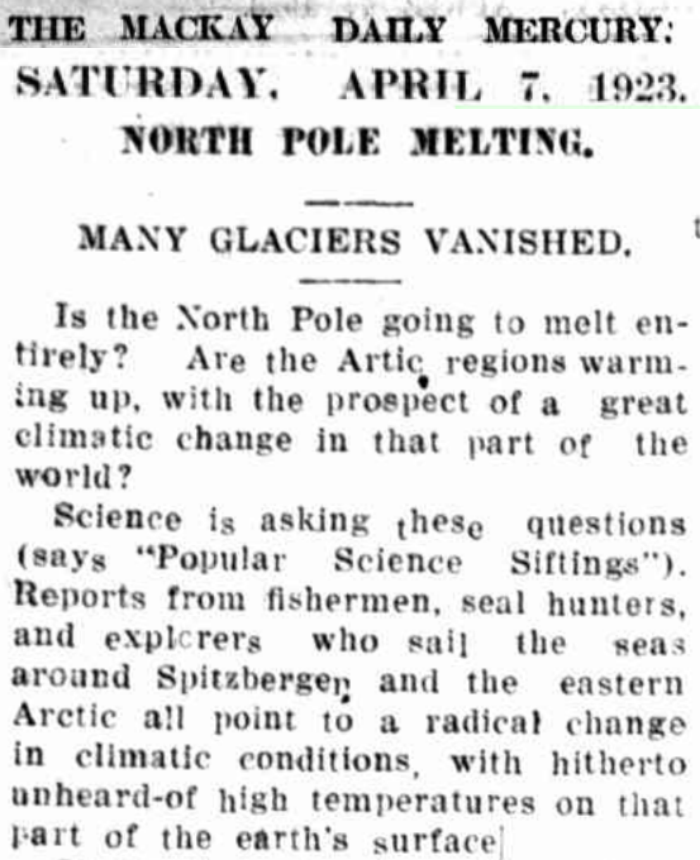
The Arctic was hot during NASA’s claimed coldest years on record, and scientists wondered if the North Pole was going to melt entirely.

Reports from fishermen, seal hunters, and explorers who sail the seas around Spitsbergen and the eastern Arctic all point to a radical change in climatic conditions, with hitherto unheard-of high temperatures on that part of the earth’s surface.
2016-05-11071329-down

07 Apr 1923 – NORTH POLE MELTING

The Mississippi River floods were massive.

2016-05-11063228

The_Des_Moines_Register_Sun__Jun_12__1927_

12 Jun 1927, Page 27

2016-05-11070434-down

18 Apr 1927 – MISSISSIPPI IN FLOOD

Germany suffered massive floods.

2016-05-11063509-down

12 Jul 1927, Page 19

Both sides of the Atlantic suffered massive devastation. Note that communications were disrupted by solar storms.

2016-05-11064139

2016-05-11064150

2016-05-11063835 The_Decatur_Herald_Fri__Apr_15__1927_

15 Apr 1927, Page 1 – The Decatur Herald

2016-05-11064520

2016-05-11064528

2016-05-11064509

10 Nov 1927, Page 1 – Ironwood Daily Globe

In 1927, CO2 levels were very low. An endless series of disasters struck the world, and glaciers were rapidly melting. What we can conclude from all this is :

  1. The climate was not better at lower levels of CO2
  2. The climate would not get better if we reduced CO2 levels
  3. The NASA temperature record is complete garbage
Posted in Uncategorized | Leave a comment

Mind Blowing Temperature Fraud In Boulder
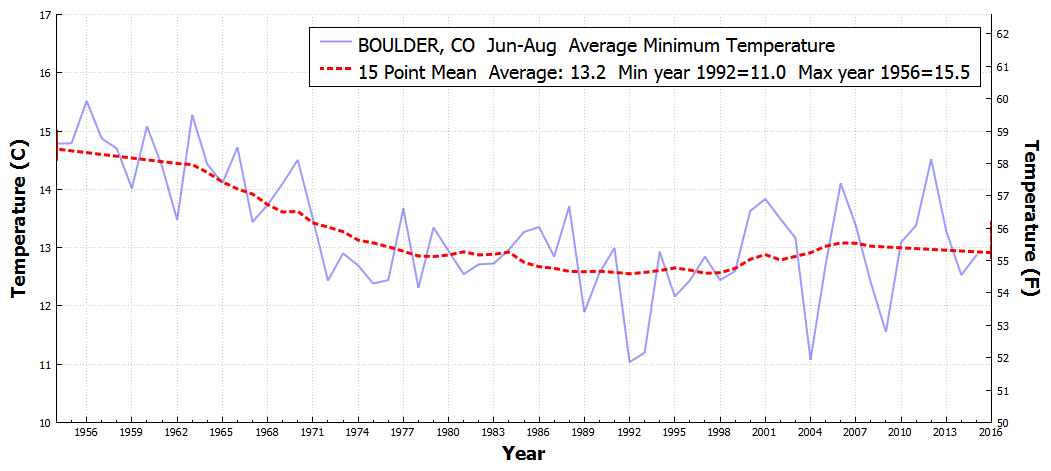
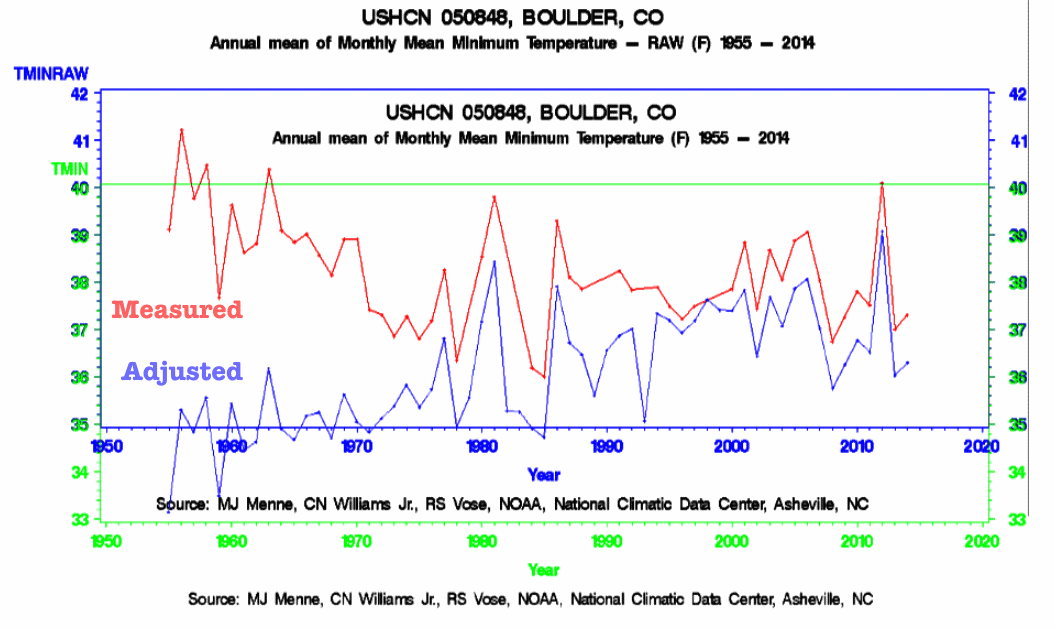
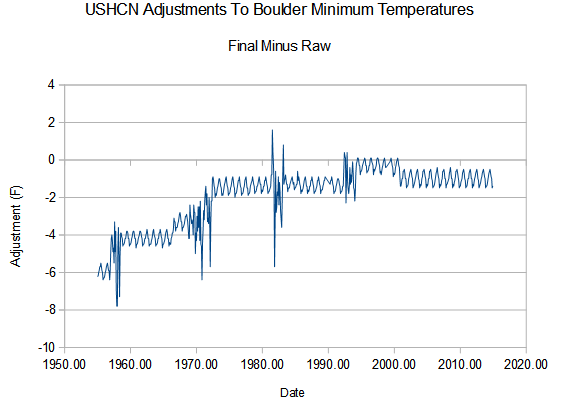
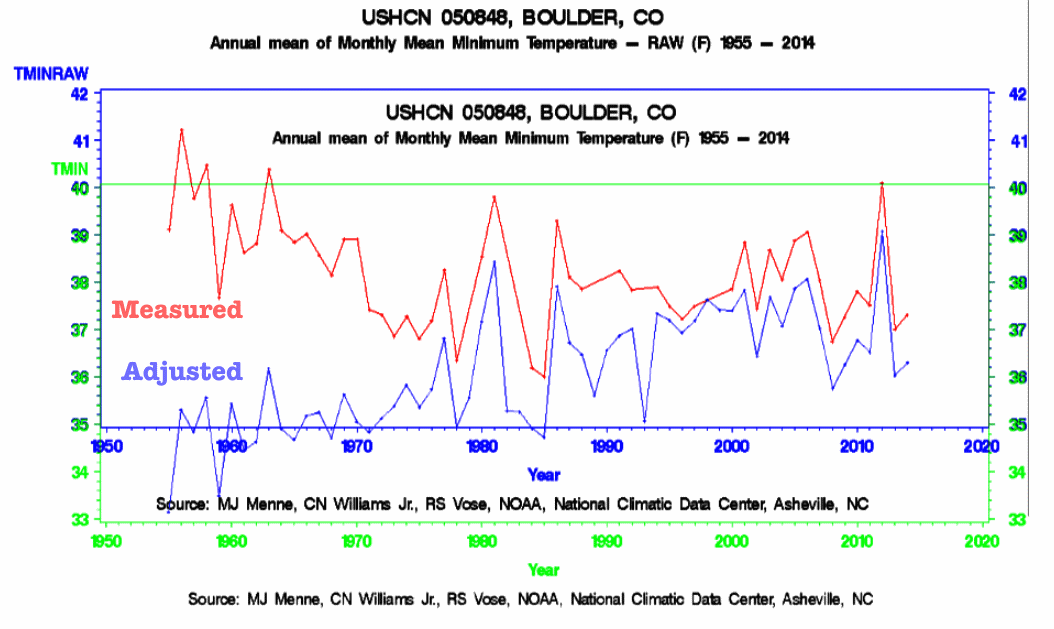
Measured minimum temperatures in Boulder, CO show a strong cooling trend over the last 60 years, but NOAA massively tampers with the data to turn it into a warming trend.
2016-05-11165016

The adjustments are as much as 7.8 degrees F.

2016-05-11171342

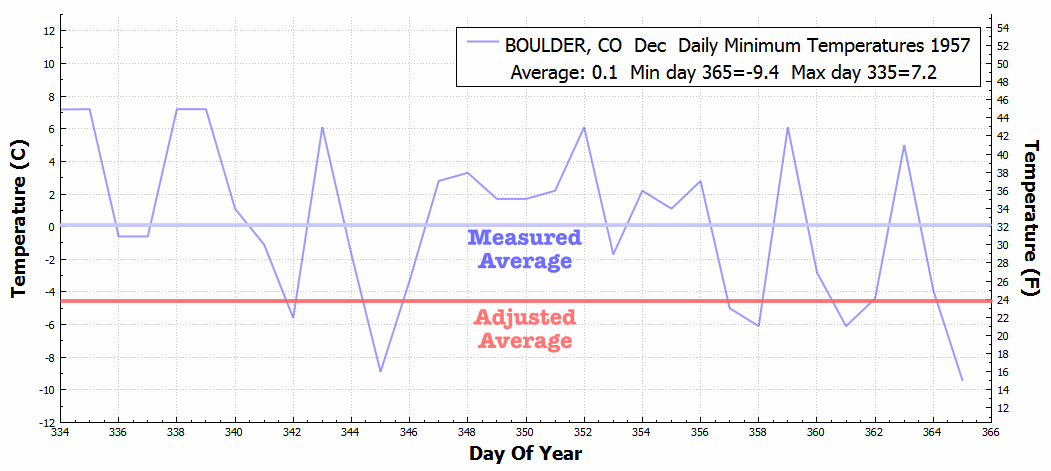
If we look at daily temperatures for December, 1957 it becomes clear how wildly fraudulent NOAA adjustments are.
BOULDER_CO_DailyMinimumTemperatureF_Dec_Dec_1957

They lowered the average temperature for the month by 7.8F, and made the average temperature minimum nearly as cold as the lowest temperature for the month. Almost every day of the month was above the adjusted average. The adjustments would correspond to an elevation change of well over 1,000 feet – and the city of Boulder is basically flat. This is the sort of fraud which US Government energy policy is based on.

Posted in Uncategorized | Leave a comment

NOAA UHI Adjustments Are A Farce

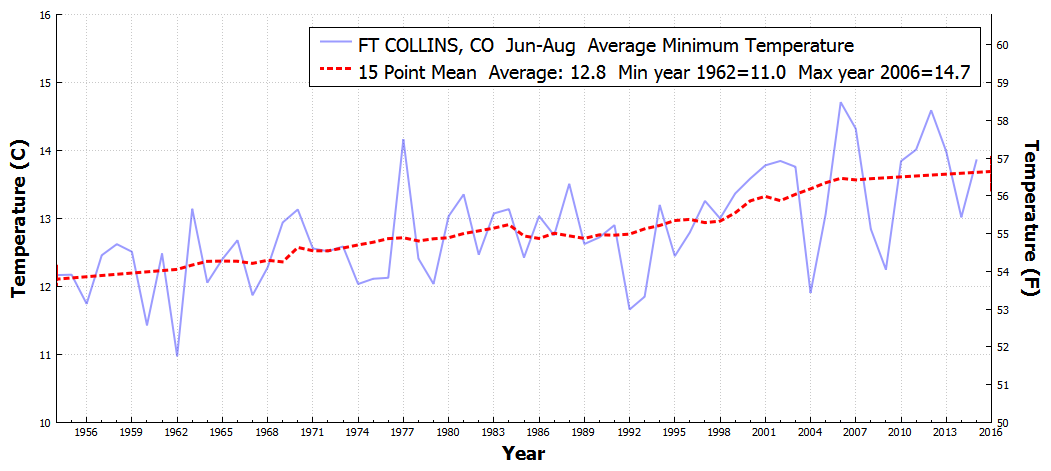
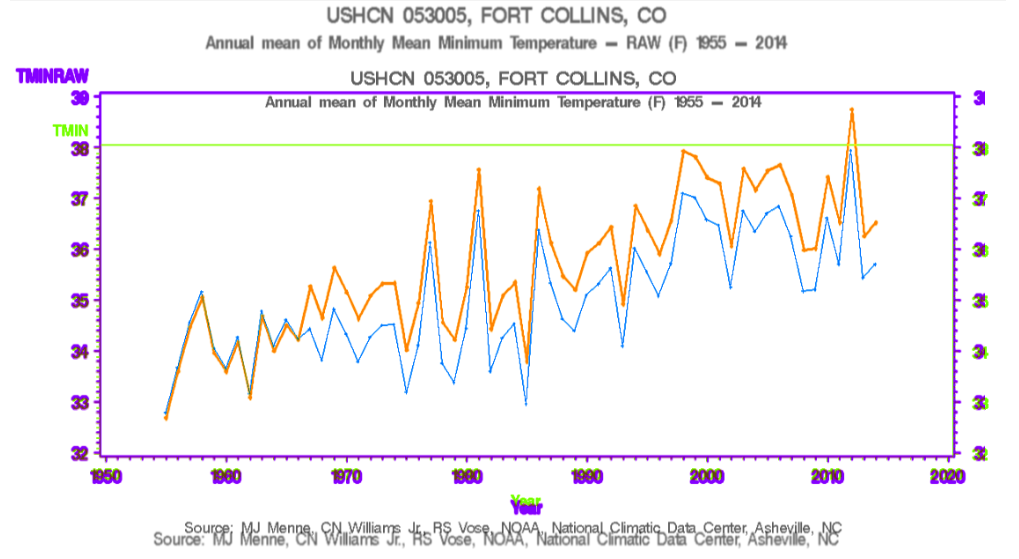
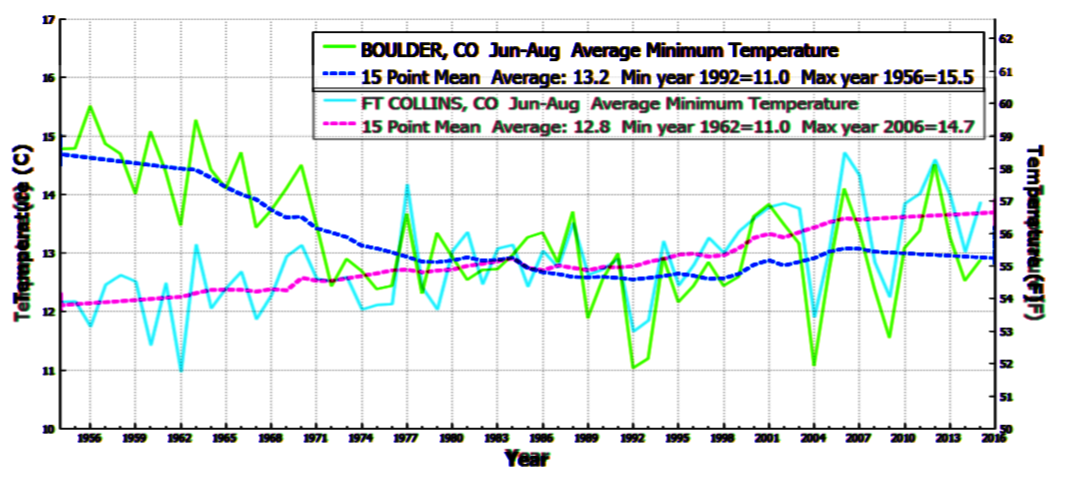
Summer nighttime temperatures in Fort Collins, Colorado have increased more than three degrees F over the past sixty years.

FTCOLLINS_CO_AverageMinimumTemperature_Jun_Aug_1955_2016

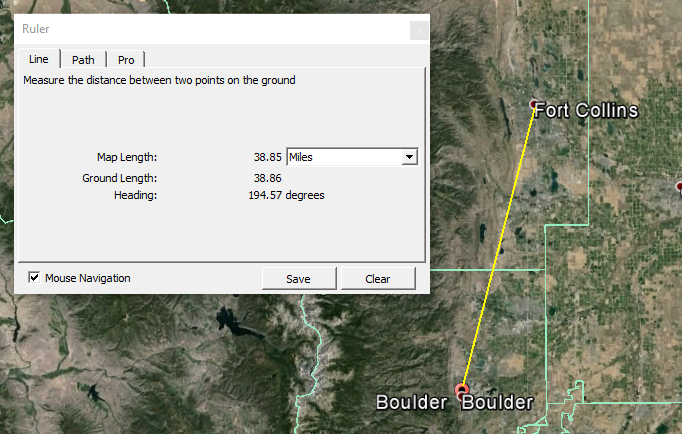
Boulder is locate 40 miles away, at the same elevation and very similar geography. Yet Boulder has seen the opposite trend. Summer nights have cooled nearly four degrees F.

2016-05-11141207

BOULDER_CO_AverageMinimumTemperature_Jun_Aug_1955_2016

There is a seven degree discrepancy in trend between the two stations. The next graph overlays the two at the same scale. Nights in Boulder used to be much warmer than Fort Collins, but now they are cooler.

2016-05-11140406

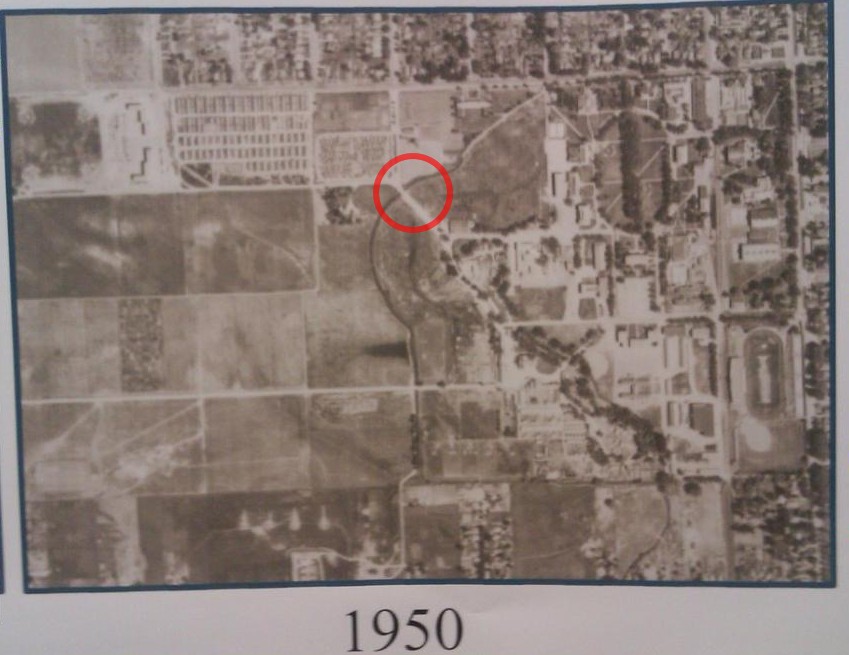
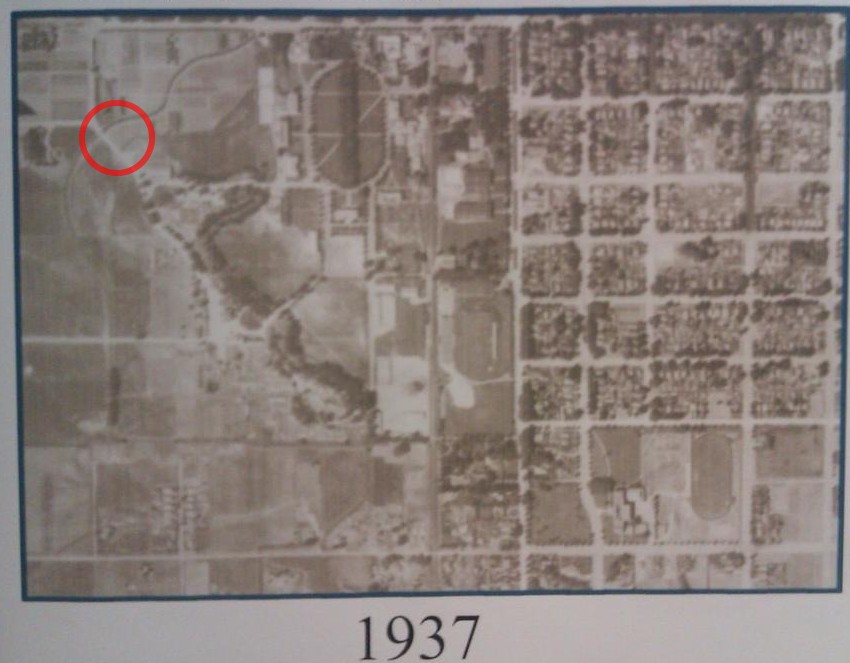
The Fort Collins weather station started out in a farm, and is now in the middle of a very busy parking lot and bus terminal.

In 1937, the station was located in the middle of a farm.

By 1950, the area was starting to get built up.

By 1969, the city had surrounded the weather station.

Now it is in the middle of a parking lot in the middle of a large urban area, which has tripled in size over the past 60 years.

ScreenHunter_619 Sep. 16 08.24

 Fort Collins has a major UHI problem. So how does NOAA handle it? They deduct less than one degree F, when they probably should be deducting closer to 7F.

2016-05-11143450

NOAA adjustments are a farce. They massively over adjust for TOBS, and massively under adjust for UHI – thus corrupting the temperature record beyond comprehension.  But it gets worse. Rather than correcting the broken Fort Collins temperatures, they massively corrupt the Boulder temperatures.

2016-05-11165016

Posted in Uncategorized | Leave a comment

A Colder Climate Is A Drier Climate

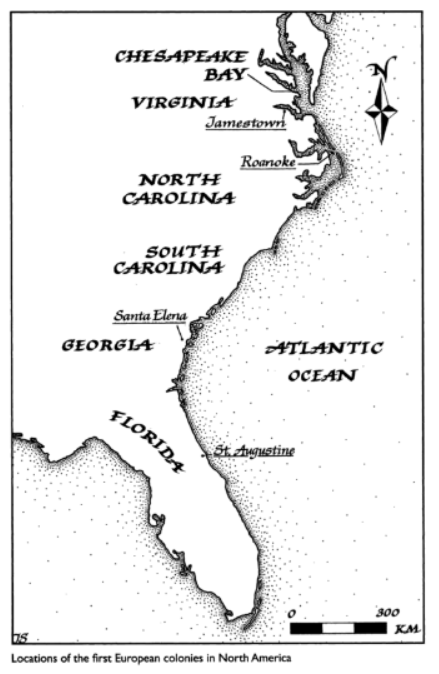
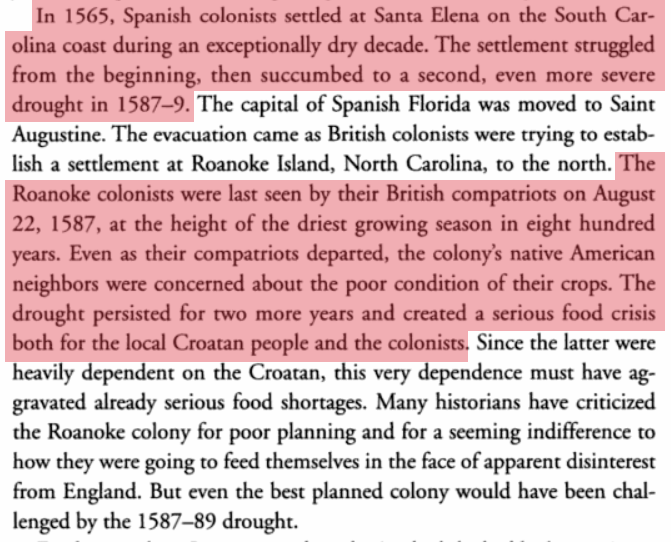
The first European colonists in the US were plagued by terrible droughts during the Little Ice Age. The Roanoke colonists faced the worst drought in 800 years.

2016-05-11124345

2016-05-11124329

2016-05-11123804

The Little Ice Age: How Climate Made History 1300-1850

Posted in Uncategorized | Leave a comment

Pulling Back The Curtain Version 1.8

An new release for Windows and Mac.

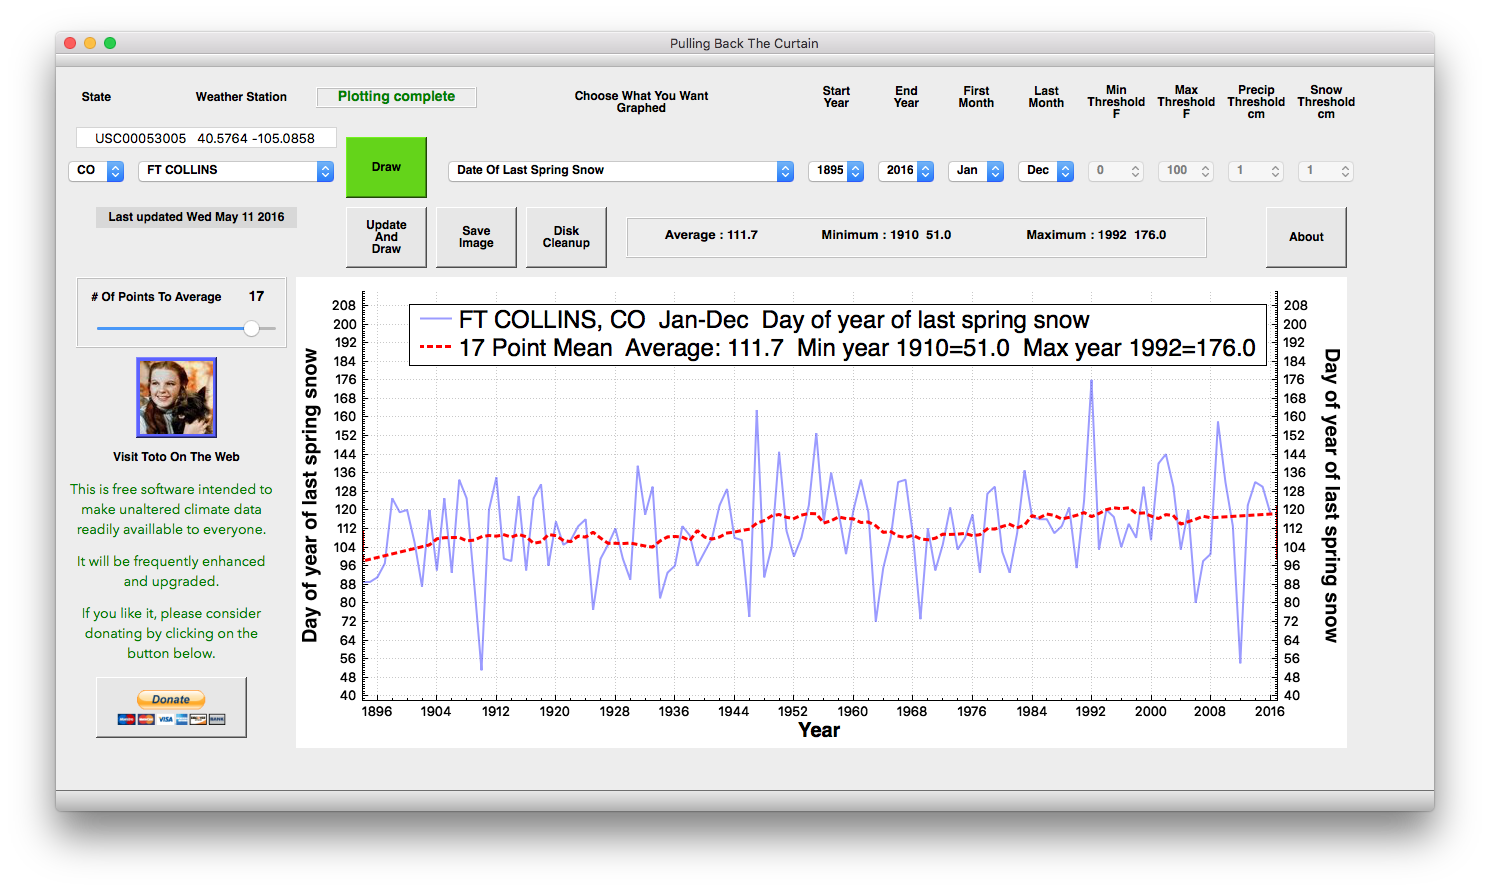
Version 1.8 adds two new statistics – the date of the last spring snow, and the date of the first autumn snow.

Screenshot 2016-05-11 at 09.06.01 AM

Mac download :

downloadMac

Windows: download the zip file by clicking here.

2016-02-16-04-38-44

Or alternatively replace this file in your current Windows directory:

PullingBackTheCurtain.exe

As always, the software is completely free and contains nothing nefarious. Some people get warnings from their virus protection extortion software.

Posted in Uncategorized | Leave a comment

Climate Debate Application For Android

CiH_areVAAAli0V

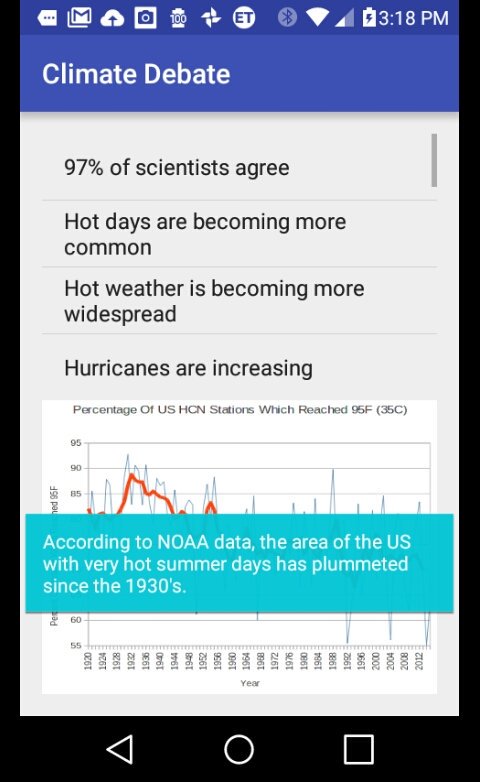
I wrote a simple Android application to assist in debating climate . This is an alpha version, and will require that you install Dropbox on your phone. It answers commonly made false claims from climate alarmists.

How-to-download-Android-apps-in-APK-file-format

There is no point downloading it except from an Android device. I will be enhancing it later. This version is mainly for testing.

Posted in Uncategorized | Leave a comment