Southern Hemisphere Temperature Fraud

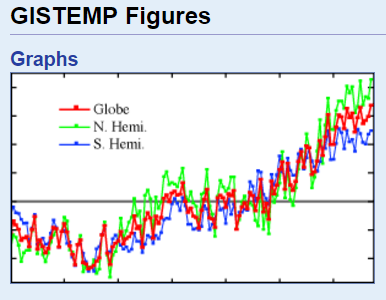
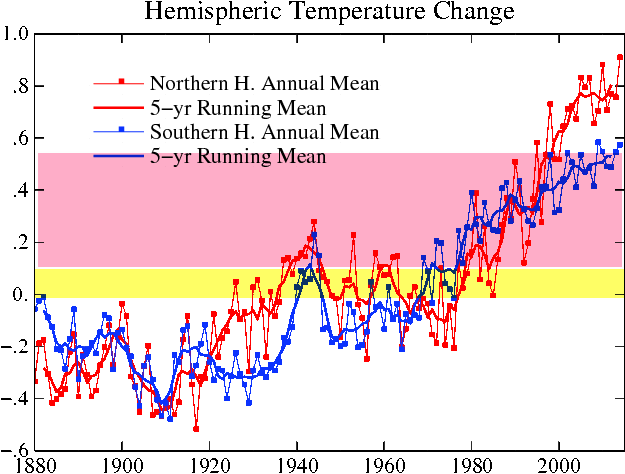
Government climate fraudsters claim that they know Southern Hemisphere temperatures back to 1880, and that they basically match northern hemisphere temperatures.

2015-12-20-09-14-00

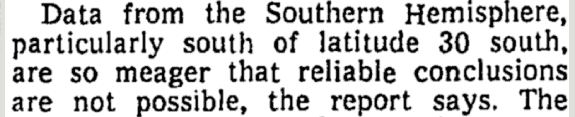
What Gavin forgot to mention is that the southern hemisphere graph is fake. In 1978, scientists agreed data south of 30S was too meager to be reliable.

PaintImage83ScreenHunter_10659 Oct. 04 06.22

TimesMachine: January 5, 1978 – NYTimes.com

The 1990 IPCC report showed that there was insufficient temperature data for analysis in much of the Arctic, most of the southern oceans, and all of the Antarctic.

PaintImage78

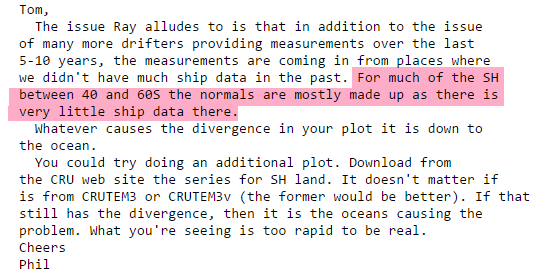
In Climategate E-Mails, Phil Jones admitted that much of his southern hemisphere ocean temperatures were made up, because there is no actual data.

2015-12-20-09-20-56

2729.txt

(h/t Gail Combs)

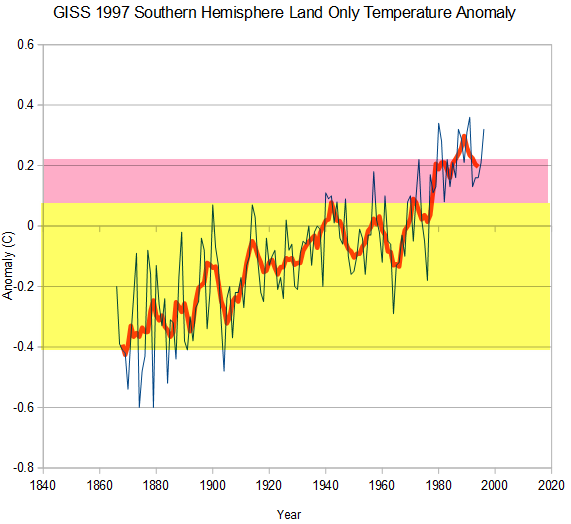
In 1997, NASA showed that three fourths of southern hemisphere land warming occurred before 1940.

2015-12-20-10-05-33

web.archive.org/web/19970714134657/http://www.giss.nasa.gov/Data/GISTEMP/ZonAnn.Ts.txt

Now let’s look at what the criminals at NASA have done since 1997. They now show almost no southern hemisphere warming before 1940, and 80% of warming occurring after 1940.

Fig.A3

Fig.A3.gif (625×474)

They accomplished this fraud largely by throwing in lots of non-existent ocean temperature data.

Posted in Uncategorized | 13 Comments

CRU Fraud – Making The Hiatus Disappear

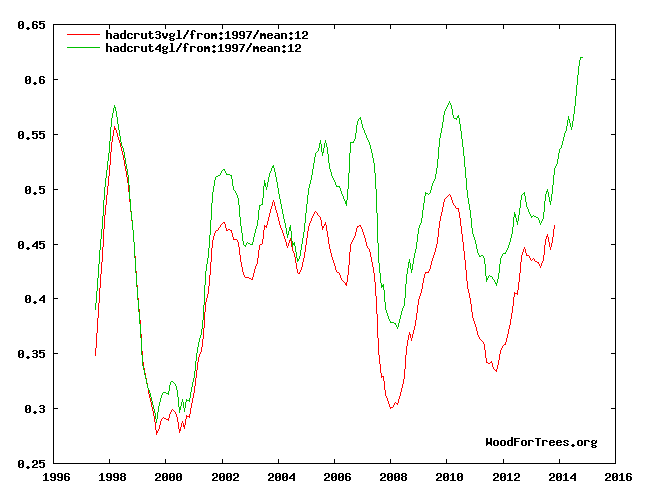
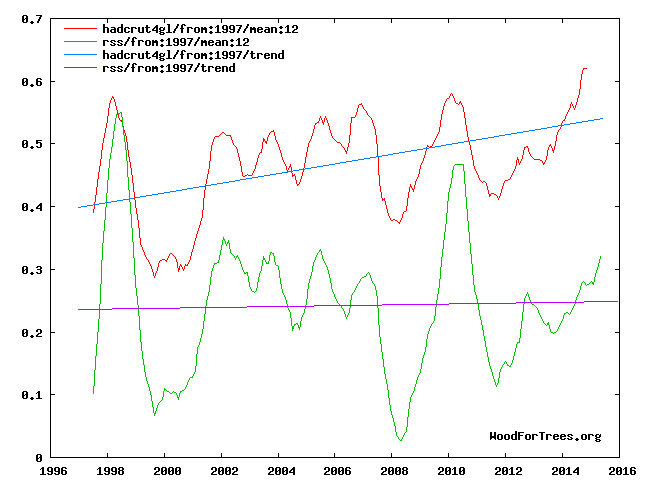
The Climatic Research Unit at the University of East Anglia used to show the “hiatus” very clearly. Then they talked it over with their fellow fraudsters at NOAA and NASA – and made the hiatus disappear by switching to a new version of their data.

2015-12-20-07-56-31

Wood for Trees: Interactive Graphs

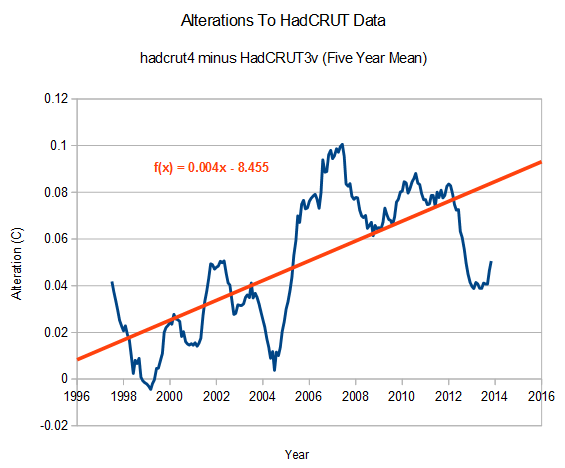
If you remove their recent 0.1 degree data tampering, then 1998 becomes the hottest year – which agrees with satellites.

2015-12-20-07-54-14

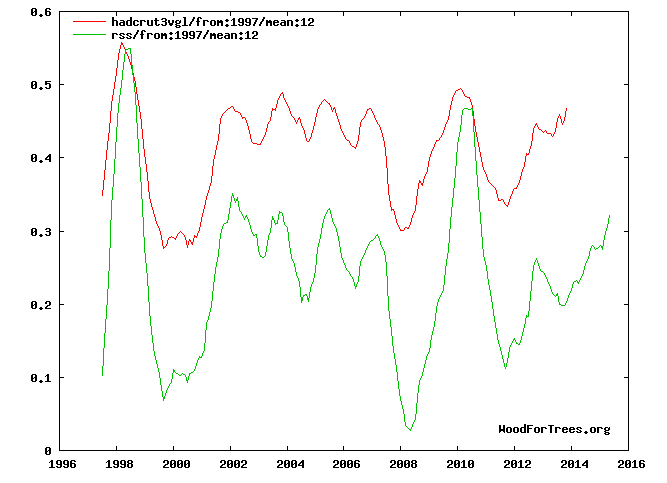
Previously, CRU had excellent agreement with satellites about the hiatus. Satellites are supposed to show larger swings than surface data, but the trend was the same. Also note how satellite data shows much larger spikes during El Nino events, like 1998 and 2010.

2015-12-20-08-06-36

The new CRU data creates a warming trend where there is none. But the real smoking gun of fraud is the divergence with satellites during the current El Nino. They should be converging, not diverging.

2015-12-20-08-13-58

Wood for Trees: Interactive Graphs

Posted in Uncategorized | 7 Comments

Gaia Continues To Pummel The Climate Fraud Team

2015-12-19-21-57-25

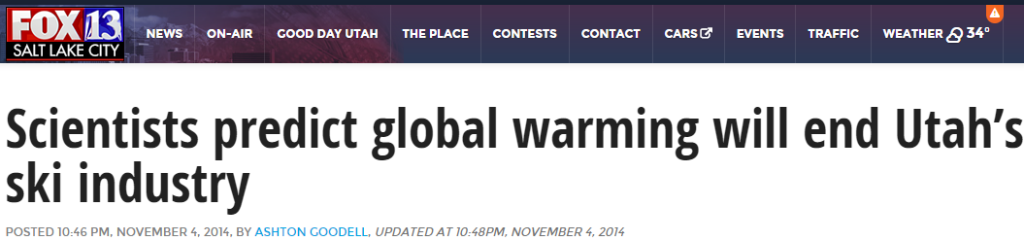
One year ago, scientists announced the demise of Utah skiing. This year they are getting buried in snow, and expecting several feet of snow this week in the mountains.

Posted in Uncategorized | 34 Comments

Climate Fraudsters Of The Day – The Washington Post

2015-12-20-03-14-20

70s around Christmas? It’s looking likely — and it would crush records – The Washington Post

The DC area has had temperatures 70 or above on Christmas Day in 1893, 1932, 1933, 1955,  1964 and 1982. It was 80 degrees at Farmville, VA on Christmas Day 1955.

The article isn’t quite as awful as the headline, but fails to mention that 70 degree weather on Christmas was much more common around DC when CO2 was below 350 PPM.

Posted in Uncategorized | 16 Comments

The Vicious Circle Of Climate Fraud

2015-12-19-18-07-44

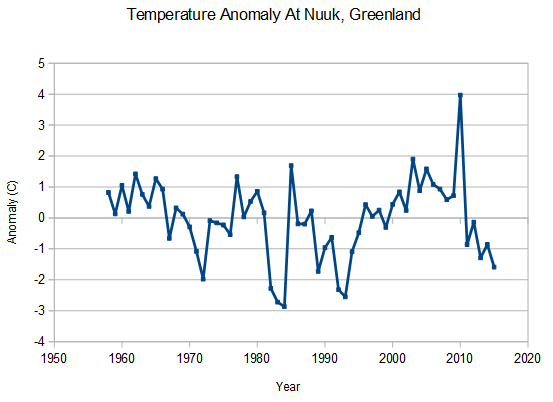
Greenland is cold, and getting colder. They were coerced into cutting off their essential energy supply by criminals like Barack Obama, and they want out. Only a complete moron like Bernie Sanders, Hitlery Clinton, or Martin O’Malley would believe that Greenland’s fossil fuel usage has any impact on the climate.

The ink hasn’t yet dried on the UN climate accord and one of the territories most at risk from global warning is already demanding an opt-out.

“We still have the option of making a territorial opt-out to COP21,” Kim Kielsen, the prime minister of Greenland, said during a visit to Copenhagen on Monday. “We have an emissions quota of 650,000 tonnes of CO2, which is the same as a single coal-fired power plant in Denmark, or a minor Danish city.”

Kielsen oversees a self-governing territory within the Kingdom of Denmark. With a size roughly that of Mexico and a population that’s smaller than the Cayman Islands’, Greenland is the least densely populated country in the world. More than 22,000 people live in the capital Nuuk, while the remaining 34,000 are dispersed over an area of 2.2 million square kilometers.

 As a result, the most common way for locals to traverse its icy expanses is via highly polluting planes.

“We want to solve that issue as we have considerably larger geographical distances to cover,” Kielsen said after a meeting with Danish Prime Minister Lars Loekke Rasmussen and their colleague from the Faroe Islands, another autonomous territory within the Kingdom of Denmark.

A recent study found that one of Greenland’s biggest glaciers is melting at a faster rate than previously estimated, adding to concerns that global warming may already be posing a risk to sea levels in the North Atlantic.

Greenland May Seek UN Climate Deal Opt-Out Amid Emissions Goal – Bloomberg Business

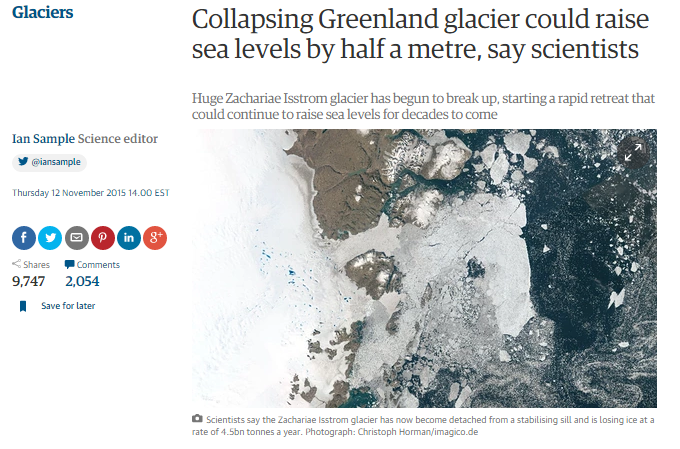
Yes, NASA recently wrote a fraudulent study claiming that the Zachariae Isstrom glacier is “collapsing.”

2015-11-15-05-36-17

Collapsing Greenland glacier could raise sea levels by half a metre, say scientists | Environment | The Guardian

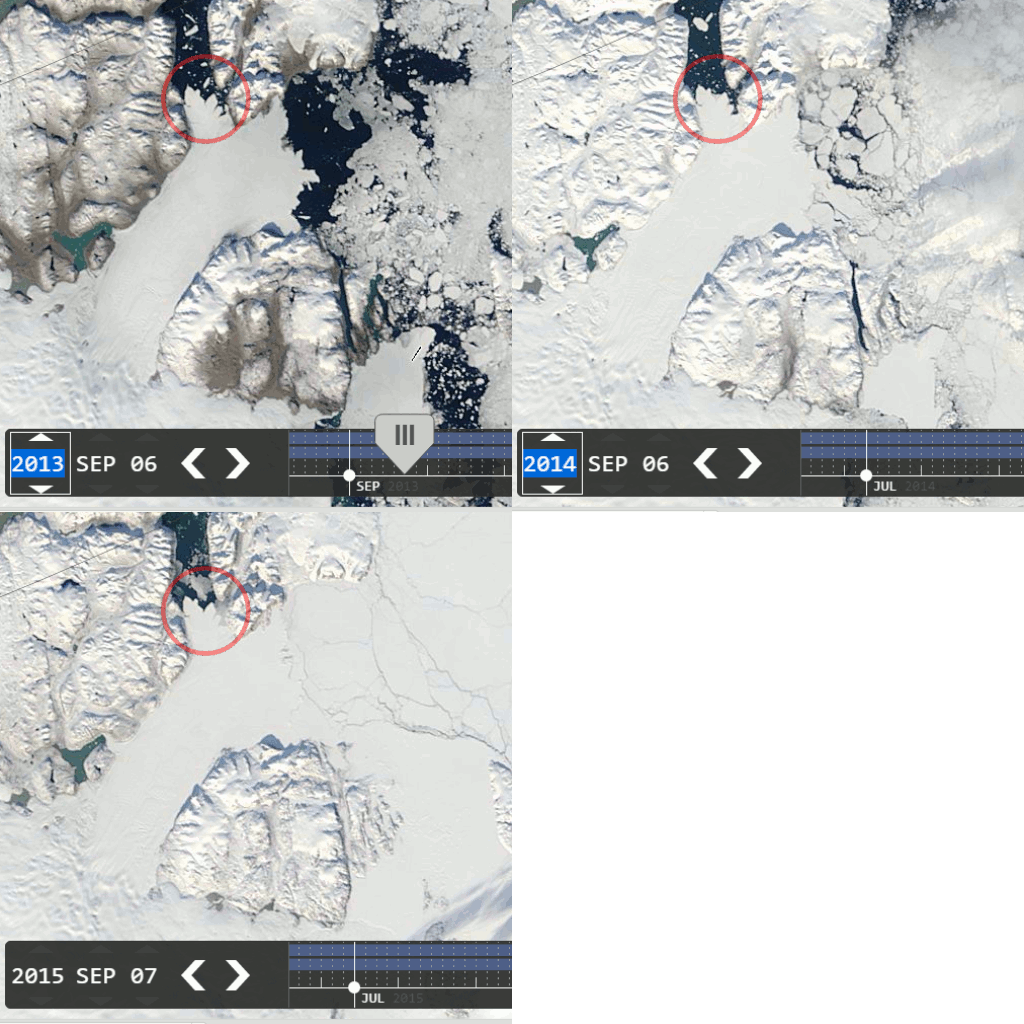
Only problem is, NASA satellite photos show that the glacier is growing, not shrinking

Zachariae2013-2015

2015 : EOSDIS Worldview
2014 : EOSDIS Worldview
2013 : EOSDIS Worldview

The process can be summarized as :

Fraudulent junk science from agencies like NASA feeds brainless politicians making idiotic illegal treaties which hurt billions of people, leading to mind-blowingly stupid decisions – and providing more money for fraudulent junk science for agencies like NASA.

Posted in Uncategorized | 17 Comments

Merry Christmas From Ted Cruz And Family

Posted in Uncategorized | 12 Comments

Understanding Gun Control

Last weekend, the New York Times ran a front page editorial demanding gun confiscation. Their plan has historic precedent.

2015-12-19-08-25-29

Middlesboro Daily News – Google News Archive Search

2015-12-19-08-32-24

Posted in Uncategorized | 124 Comments

Visualizing Tom And Gavin’s Destruction Of The Temperature Record

2015-12-19-04-55-44

Data.GISS: GISS Surface Temperature Analysis

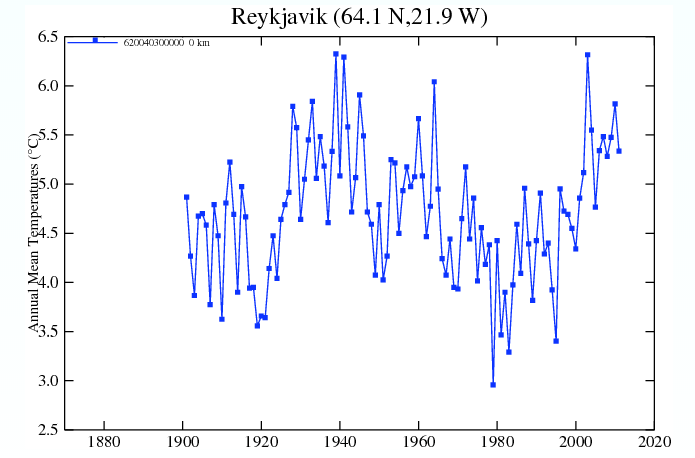
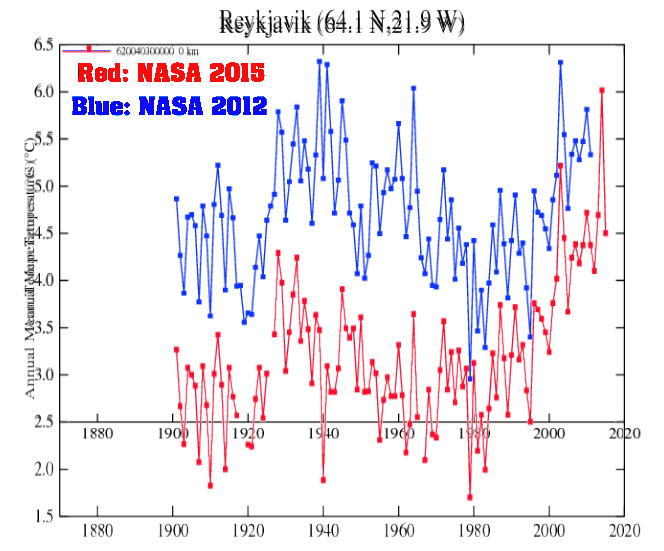
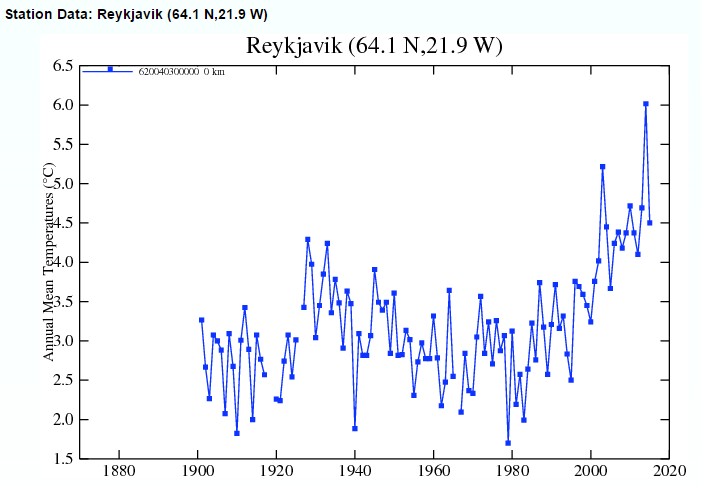
The Northern Hemisphere/Arctic warmth of the 1930’s and 1940’s needed to disappear, because it wrecked the global warming scam. So Tom Karl of NOAA and Gavin Schmidt of NASA simply altered the data to make the warmth disappear. The graph below shows how they rewrote the temperature history at Reykjavik, Iceland between 2012 and 2015.

2015-12-15-05-03-15

2012 version: Data.GISS: GISS Surface Temperature Analysis
2015 version: Data.GISS: GISS Surface Temperature Analysis

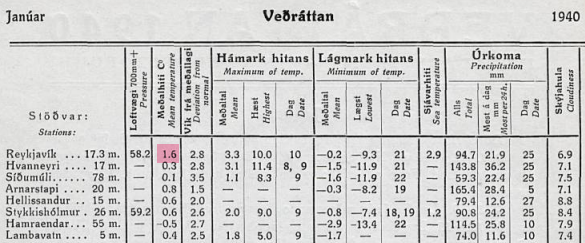
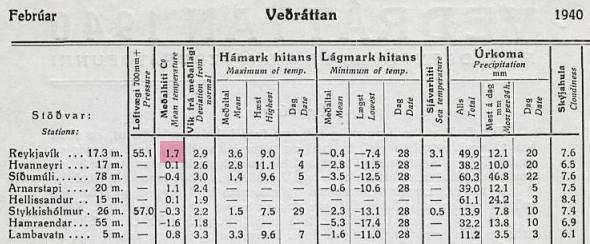
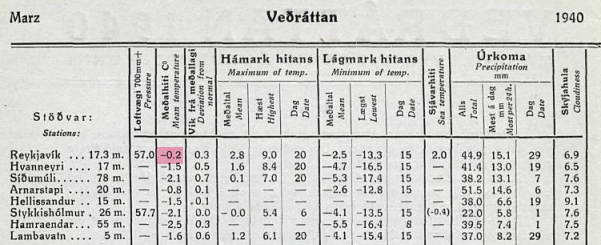
Here are the original Icelandic records showing the first three months of 1940 – Temperatures averaged 1.6C, 1.7C and -0.2C respectively.

2015-12-19-04-36-23

2015-12-19-04-36-472015-12-19-04-37-14

(h/t RobertV)

Veðráttan, 17. árgangur 1940, Júní – Timarit.is

Tom and Gavin needed to get rid of that warmth, so they subtracted 3.2 C from the measured temperatures for all three months.

2015-12-19-04-46-57

data.giss.nasa.gov/tmp/gistemp/STATIONS/tmp_620040300000_14_0/station.txt

Their data tampering created a 100% fraudulent hockey stick of warming – needed by Barack Obama to push his climate change scam.

2015-12-19-04-51-14

Data.GISS: GISS Surface Temperature Analysis

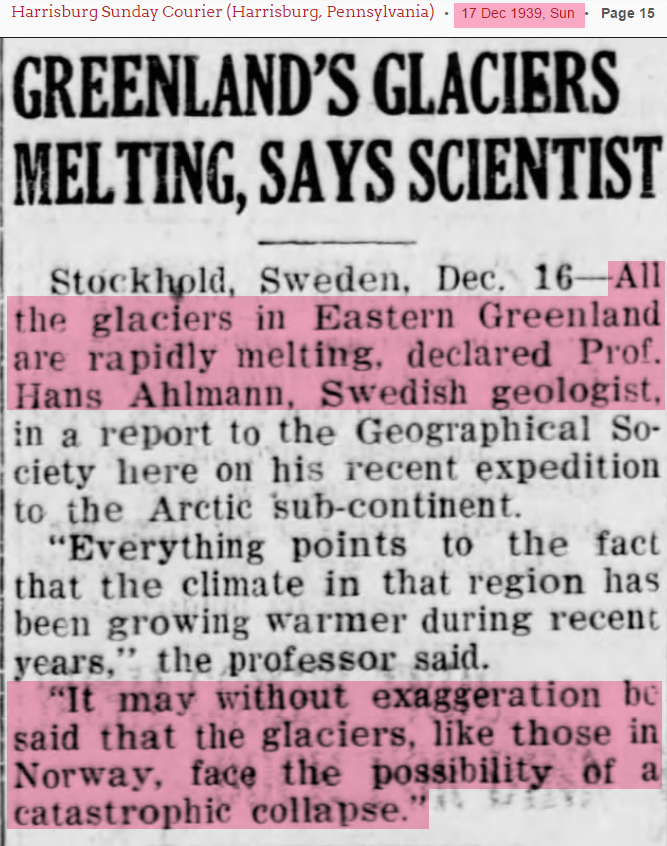
The warmth of the 1940’s and subsequent cooling was well documented. In 1939, Glaciers from Greenland to Norway were facing “catastrophic collapse”

2015-12-14-03-46-06

17 Dec 1939, Page 15 – at Newspapers.com

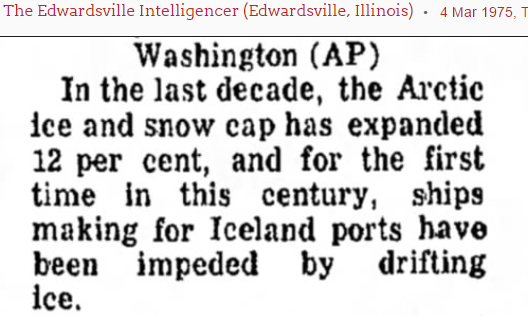
But by 1975, Arctic ice was rapidly expanding and blocking Icelandic seaports. Just as the unaltered temperature data showed.

2015-12-19-04-53-49

4 Mar 1975, Page 9 – at Newspapers.com

The NOAA/NASA/CRU temperature records are fraudulent – generated by political hacks posing as scientists.

From: Tom Wigley <[email protected]>
To: Phil Jones <[email protected]>
Subject: 1940s
Date: Sun, 27 Sep 2009 23:25:38 -0600
Cc: Ben Santer <[email protected]>

It would be good to remove at least part of the 1940s blip, but we are still left with “why the blip”.

di2.nu/foia/1254108338.txt

Mike,
Can you delete any emails you may have had with Keith re AR4? Keith will do likewise… Can you also email Gene [Wahl] and get him to do the same? I don’t have his new email address. We will be getting Caspar [Ammann] to do likewise.
Cheers, Phil

junksciencearchive.com/FOIA/mail/1212063122.txt

Hopefully the next president will clean up this massive fraud being committed by government agencies.

2015-12-15-05-09-47

Posted in Uncategorized | 37 Comments

“A Messiah Of Absurdity”

In 1932, the New York Times wrote a very accurate description of the madness America faces today.

The majority of [his] followers are men and women who have lost their spiritual anchorage 

2015-12-19-03-21-06

To them civilization is no longer a protection but a menace. The skyscraping factory chimneys of which they had been so proud may one day sound the signal of the doom of a mad world.

2015-12-19-03-25-46

Logic no longer appeals to them, and what they want is insanity. A Messiah must come, even if he is a Messiah of Absurdity.

2015-12-19-03-27-53

Nothing can be worse than ‘reality! Let madness reign supreme!

Continue reading

Posted in Uncategorized | 10 Comments

NOAA Global Temperature Fraud

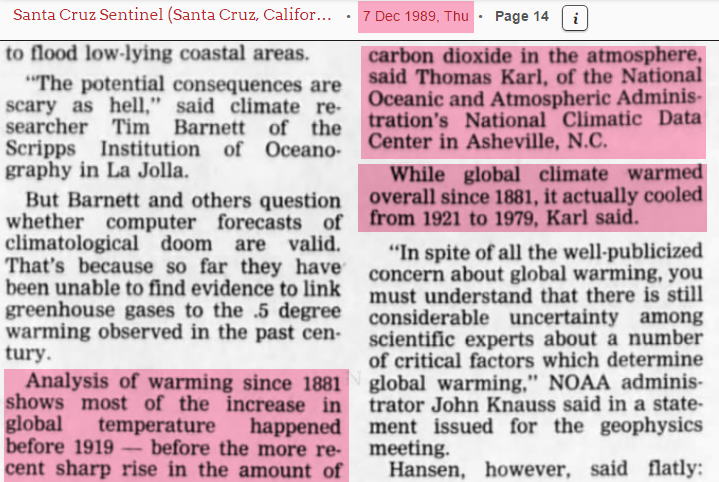
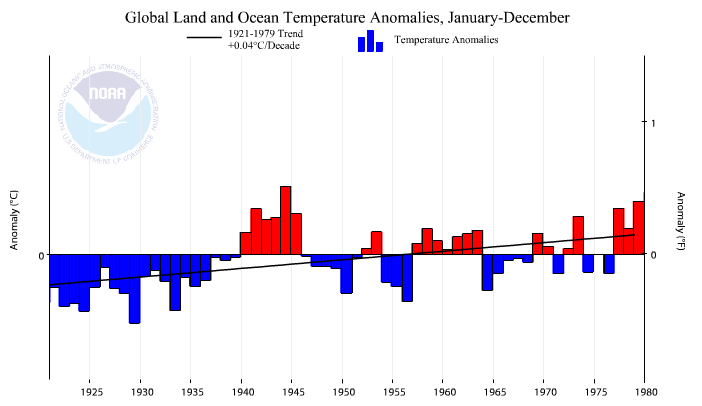
In 1989, Tom Karl at NOAA reported that almost all global warming occurred before 1919, and that Earth cooled from 1921 to 1979.

Image-131 (1)

7 Dec 1989, Page 14 – at Newspapers.com

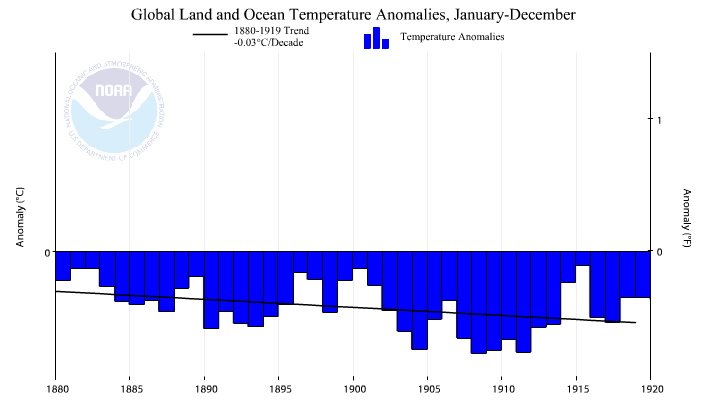
NOAA now shows the exact opposite. Cooling before 1919 and warming after 1921. Tom Karl simply altered the data to meet the global warming agenda.

2015-12-18-12-47-47

Climate at a Glance | National Centers for Environmental Information (NCEI)

2015-12-18-12-44-25

Climate at a Glance | National Centers for Environmental Information (NCEI)

Posted in Uncategorized | 14 Comments