It is too cold to divest right now. Climate activists are stuck in their fossil fuel heated homes this weekend.
FFY postpones Global Divestment Day action | Yale Daily News
It is too cold to divest right now. Climate activists are stuck in their fossil fuel heated homes this weekend.
The UN says “yes you are correct, and we are going to ignore it”


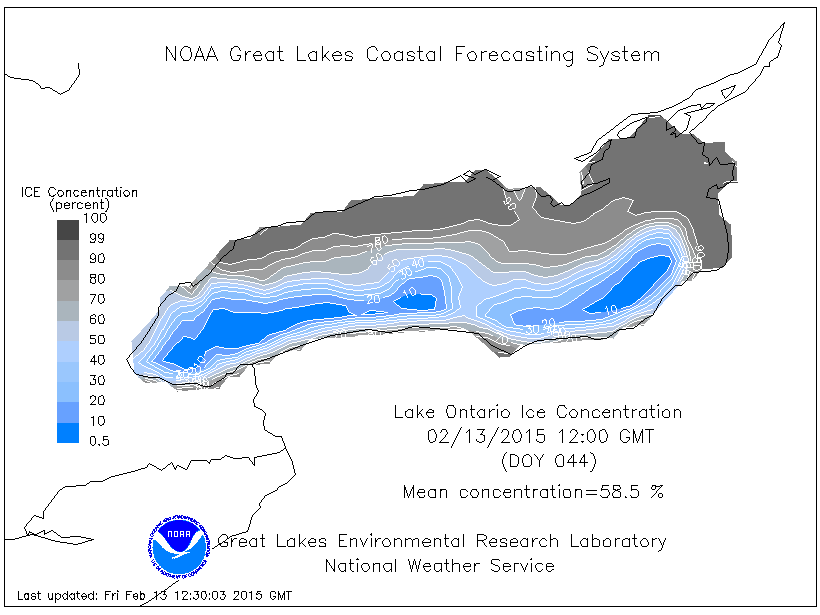
Lake Ontario doesn’t freeze over very often. But it may happen this weekend.
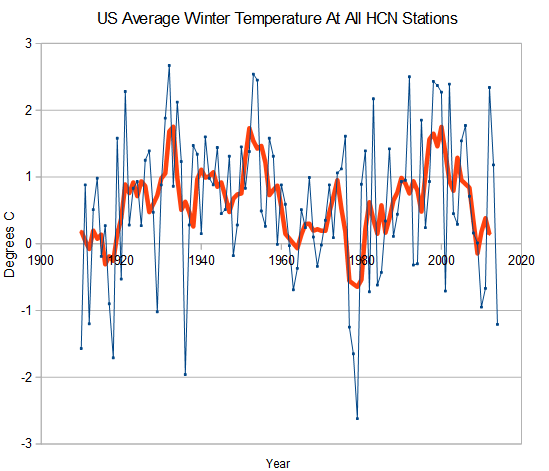
Heidi climate fraud central claims that US winters are getting warmer, particularly in the upper midwest.
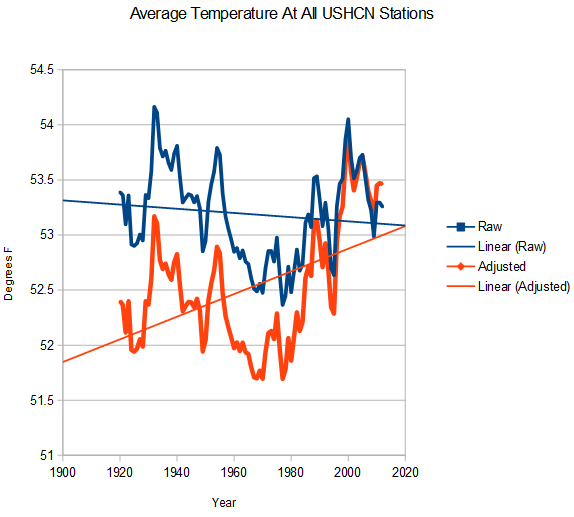
She accomplished this trick by starting at the coldest decade of the century, ending in one of the warmest years, and using tampered USHCN data. The actual data shows that US winter temperatures are plummeting, as everyone who lives here knows.
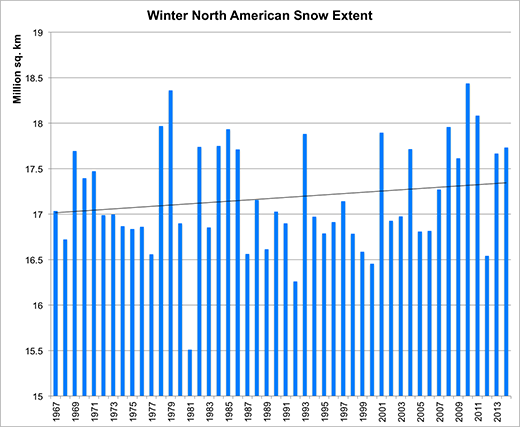
North American winter snow cover is increasing, because the snow line is pushing further south – due to cold air.
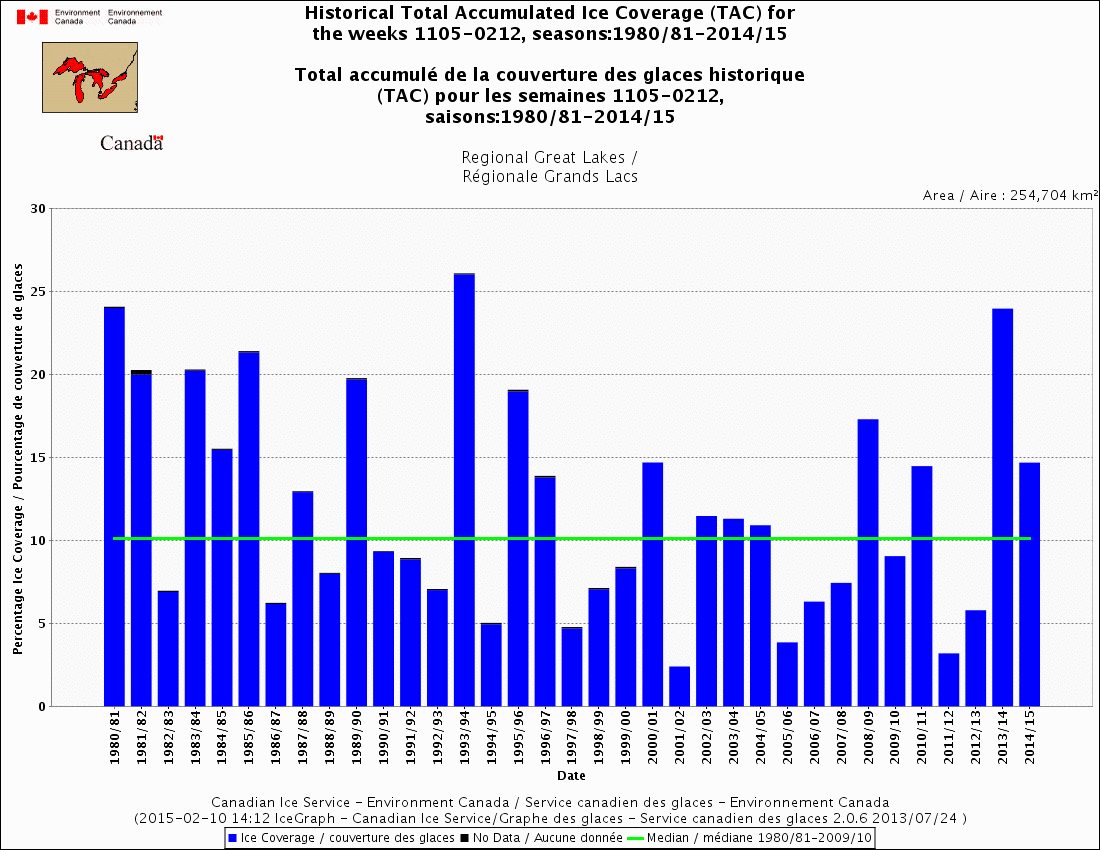
Four of the last seven years have had above normal ice on the Great Lakes. Obviously the upper Midwest is not having warmer winters.
Snow and ice don’t lie. The freezing point of water hasn’t changed.
Heidi says anyone who disagrees with her fraud should be de-certified.
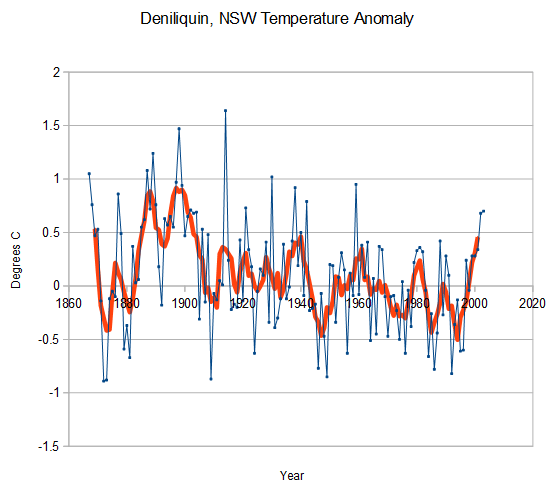
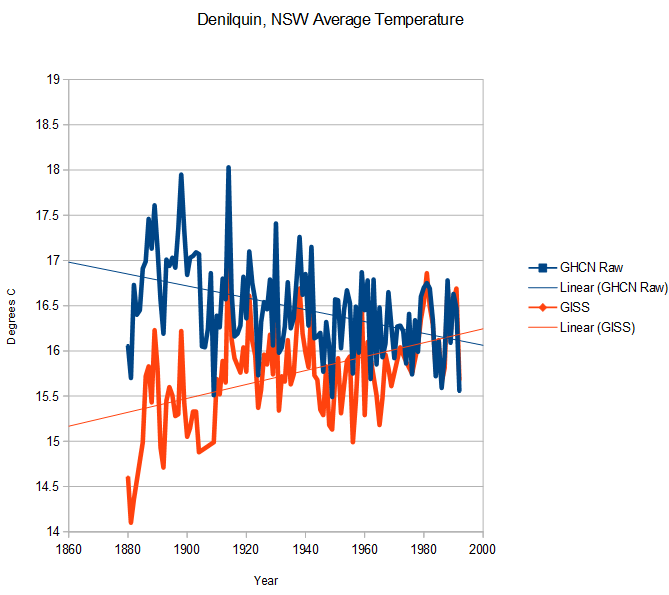
Deniliquin is a small town located 270 km north of Melbourne and 370 km west of Canberra. It is one of the oldest stations in Australia and operated through 2003. The station showed a general cooling trend since the 1890s
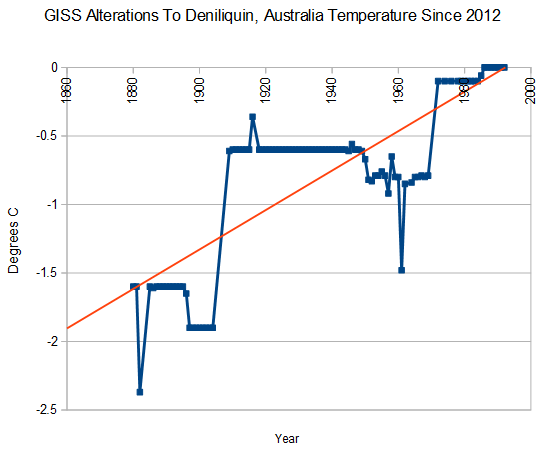
Gavin made the cooling disappear a few years ago, and turned cooling into warming.
In order to hide the hot past, he knocked almost 2.5 degrees off of older temperatures.
This turned a sharp cooling trend into a strong warming trend.
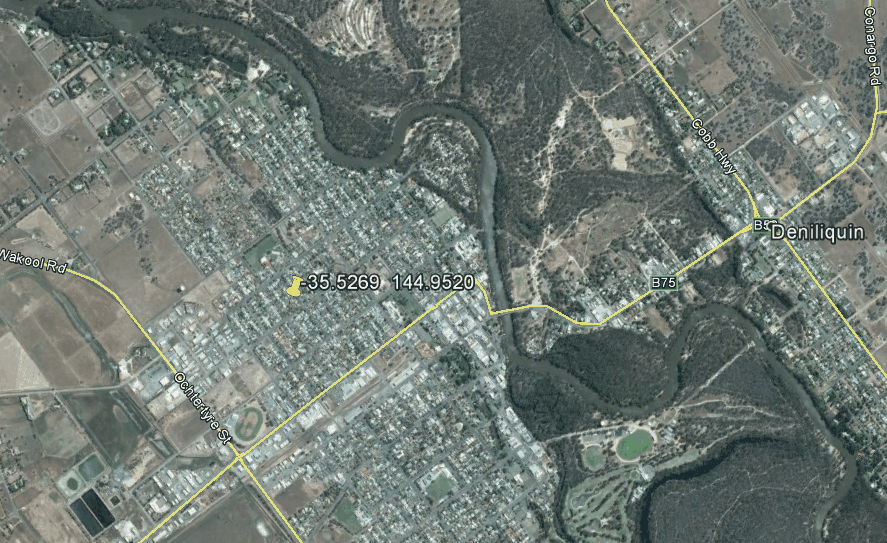
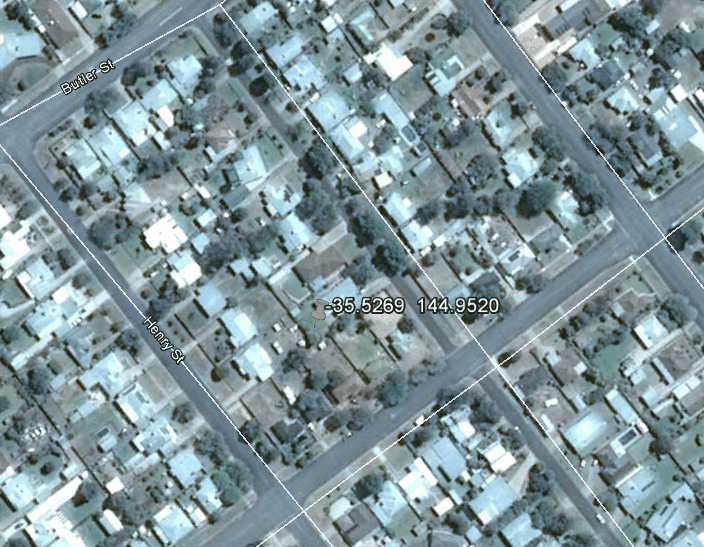
Satellite photography shows that Deniliquin is fairly rural, but the station is in the middle of a neighborhood and was undoubtedly affected by the paving of the roads and growth of the town.
Influence of Urban Heating on the Global Temperature Land Average using Rural Sites Identified from MODIS Classifications
Wickham C1 , Rohde R2 , Muller RA3,4 *, Wurtele J3,4 , Curry J5 , Groom D3 , Jacobsen R3,4 , Perlmutter S3,4 , Rosenfeld A3 and Mosher S6
The effect of urban heating on estimates of global average land surface temperature is studied by applying an urban-rural classification based on MODIS satellite data to the Berkeley Earth temperature dataset compilation of 36,869 sites from 15 different publicly available sources
We observe the opposite of an urban heating effect over the period 1950 to 2010, with a slope of -0.10 ± 0.24°C/100yr (2? error) in the Berkeley Earth global land temperature average. The confidence interval is consistent with a zero urban heating effect, and at most a small urban heating effect (less than 0.14°C/100yr, with 95% confidence) on the scale of the observed warming (1.9 ± 0.1°C/100 yr since 1950 in the land average from Figure 5A).
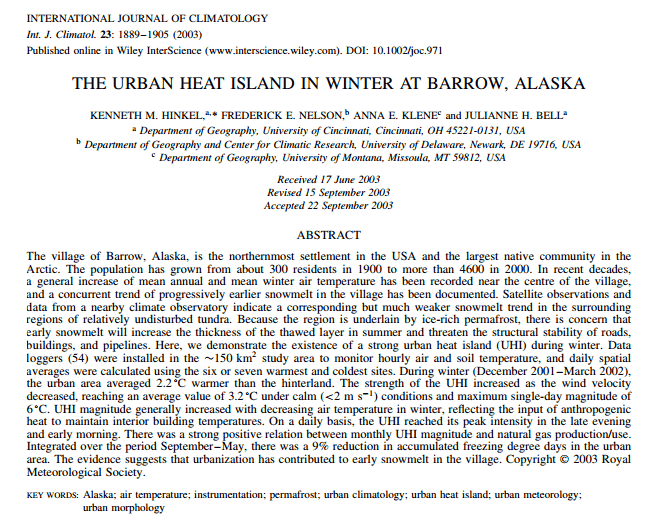
Everyone knows there is an urban heat island effect. This has been understood for a couple of centuries. The weather forecaster says every night “a few degrees cooler in outlying areas.” Many cities have had studies done showing five to ten degrees warming in town relative to truly rural areas. Even tiny towns like Barrow, AK have 2-3C UHI effects
So how did Mosher and Curry come to a conclusion so utterly daft?
They made the standard climate science mistake of doing a bunch of math on a problem they don’t understand. Barrow would certainly appear as a rural site in their methodology, yet Barrow has 2-3C UHI.
I routinely observe 5 degrees F warming just going from open space on my bicycle into an adjacent neighborhood. The presence of any asphalt, brick, heated houses and snow removal in the area has a marked effect on temperature. How could they not have an effect?
Over the past hundred years suburban sprawl and pavement has spread everywhere. This has had a marked effect on the surface temperature record, and has nothing to do with urban lights. There is no reason to expect that downtown areas would have changed much over the past century, because they were already paved over. It is the semi-rural areas which have expanded and been paved over. Curry and Mosher see UHI warming in supposedly rural sites, but don’t recognize it as UHI warming – because their methodology is flawed.
Garbage in/garbage out. Standard fare for peer-reviewed climate science. Next I will show you what actual UHI science looks like.
I did a survey of the ten oldest stations in New South Wales And Victoria, circled below. Three rural stations were not included because of obvious problems with the data, but none showed any warming.
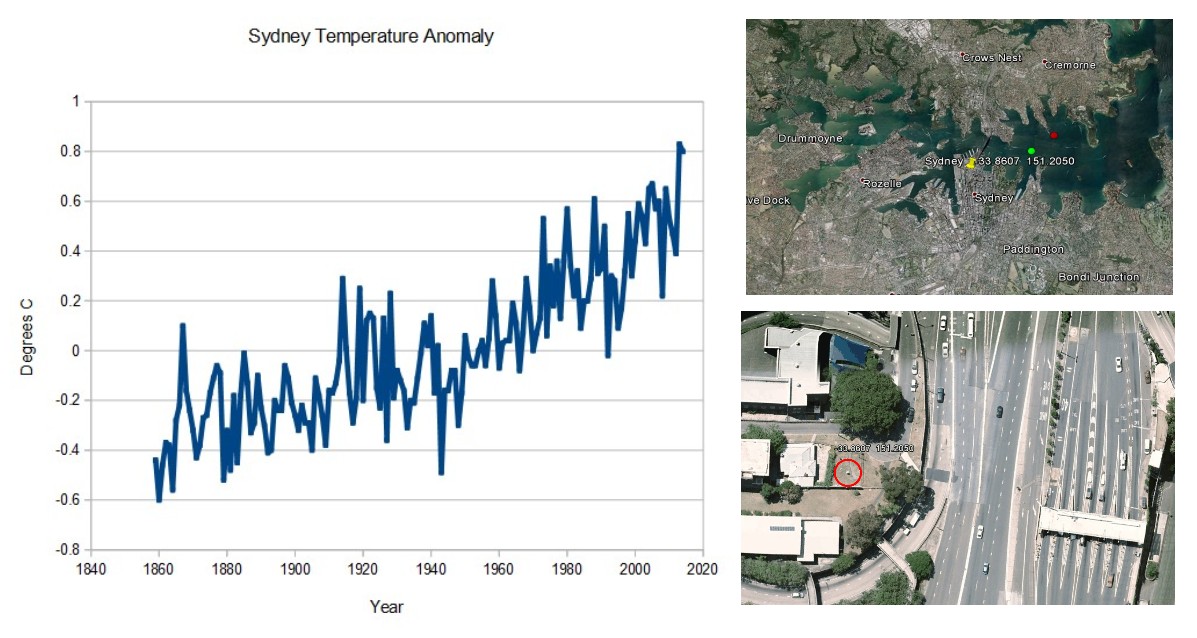
MELBOURNE REGIONAL OFFICE ASN00086071 DENILIQUIN (WILKINSON ST) ASN00074128 BATHURST GAOL ASN00063004 SYDNEY (OBSERVATORY HILL) ASN00066062CAPE OTWAY LIGHTHOUSE GSN ASN00090015BOURKE POST OFFICE ASN00048013WAGGA WAGGA (KOORINGAL) ASN00072151FORBES (CAMP STREET) ASN00065016INVERELL COMPARISON ASN00056017GUNNEDAH POOL ASN00055023
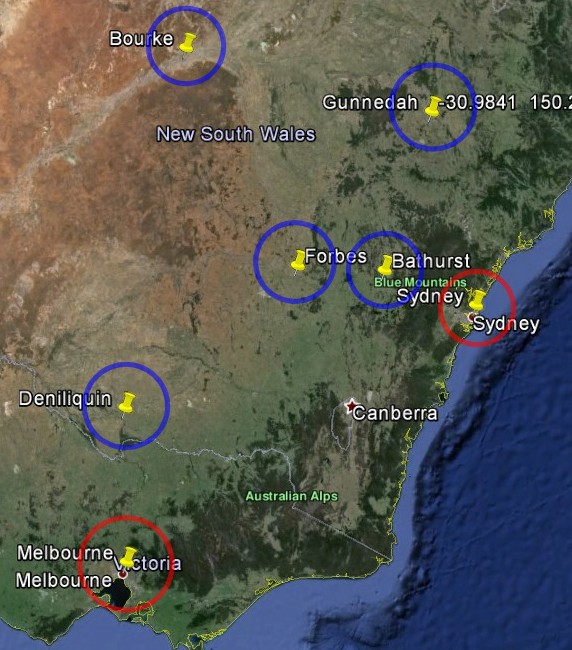
The two urban stations at Melbourne and Sydney both showed strong warming, and both have disastrously poor siting of their thermometers in the middle of large cities.
By contrast, all of the rural stations show a long term cooling trend, with some recent warming. (Note that there is no data for the most recent years with some of the rural stations.)
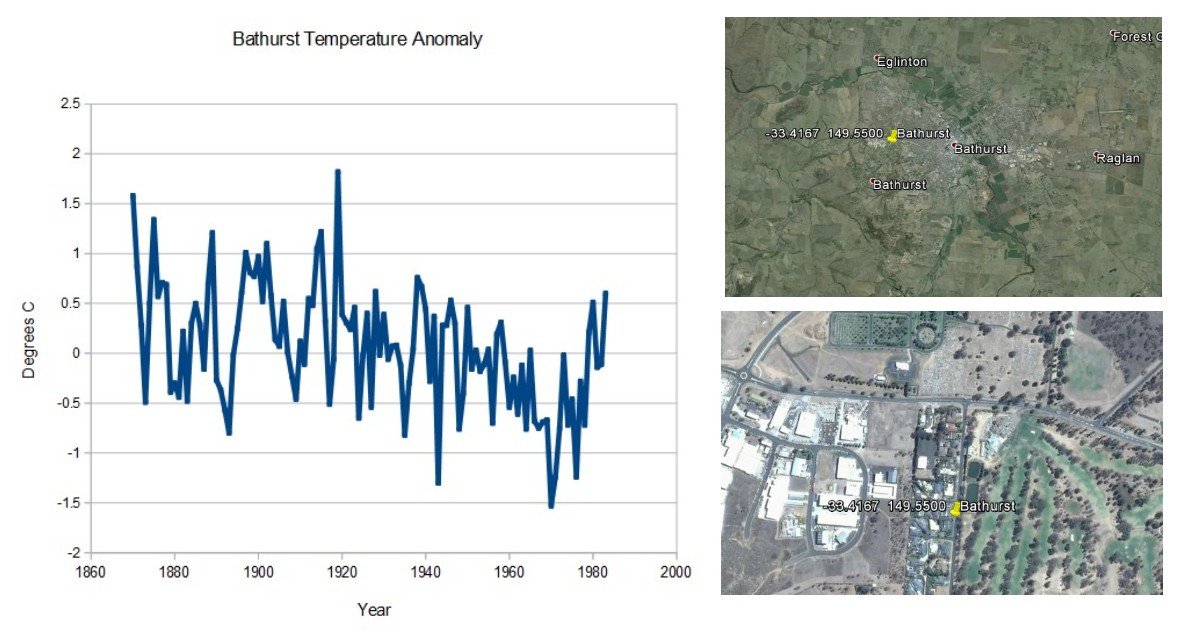
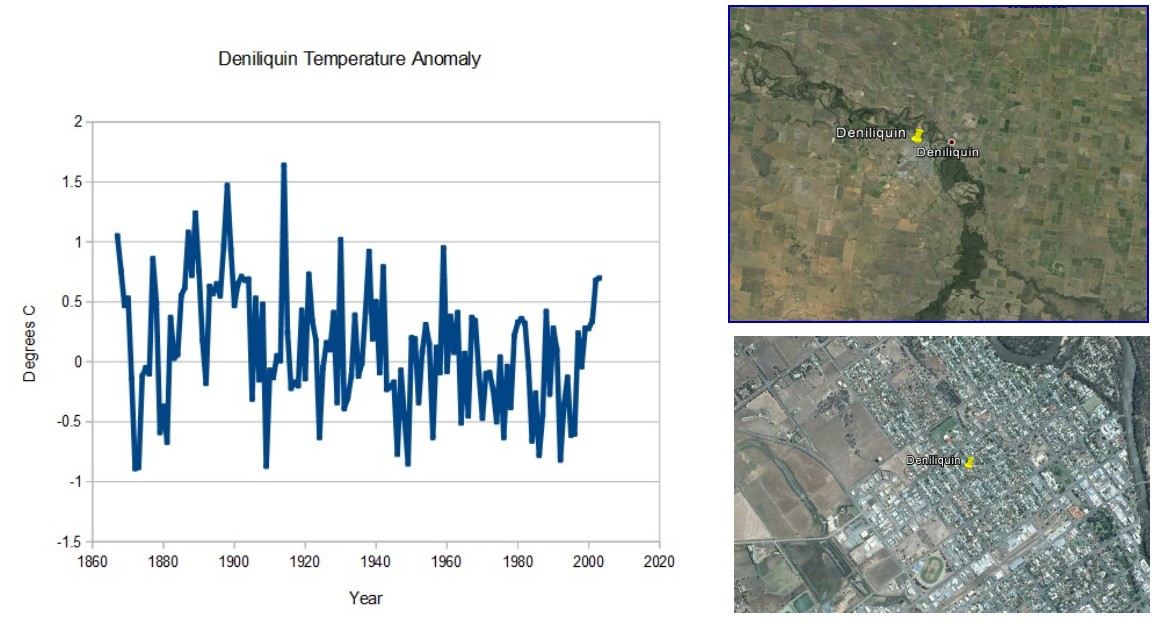
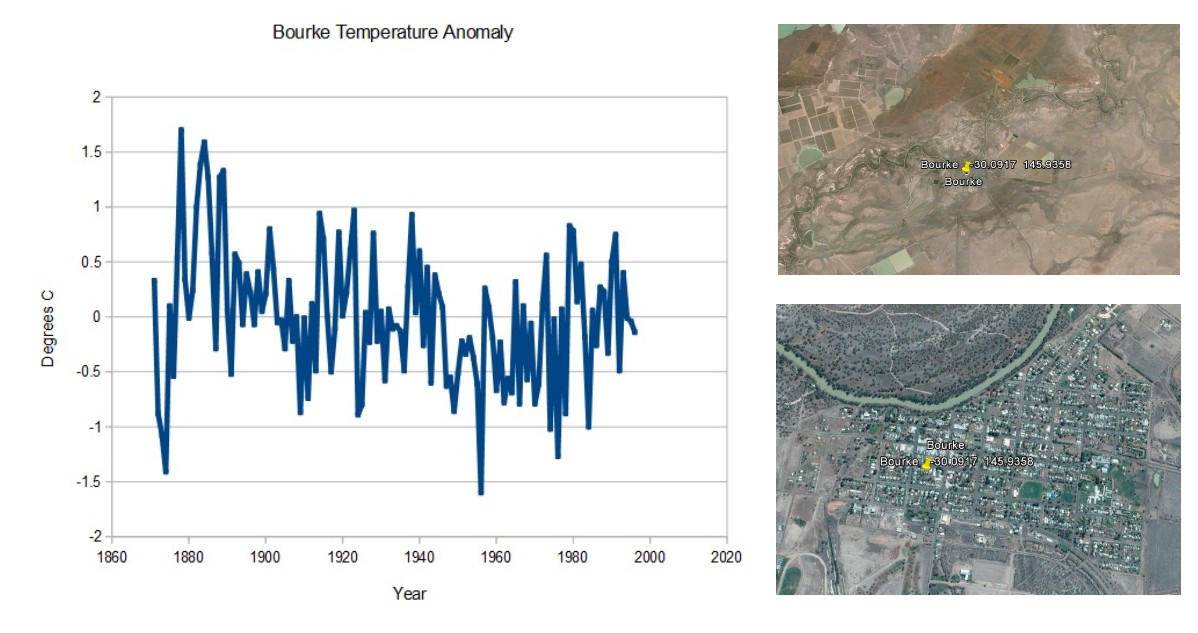
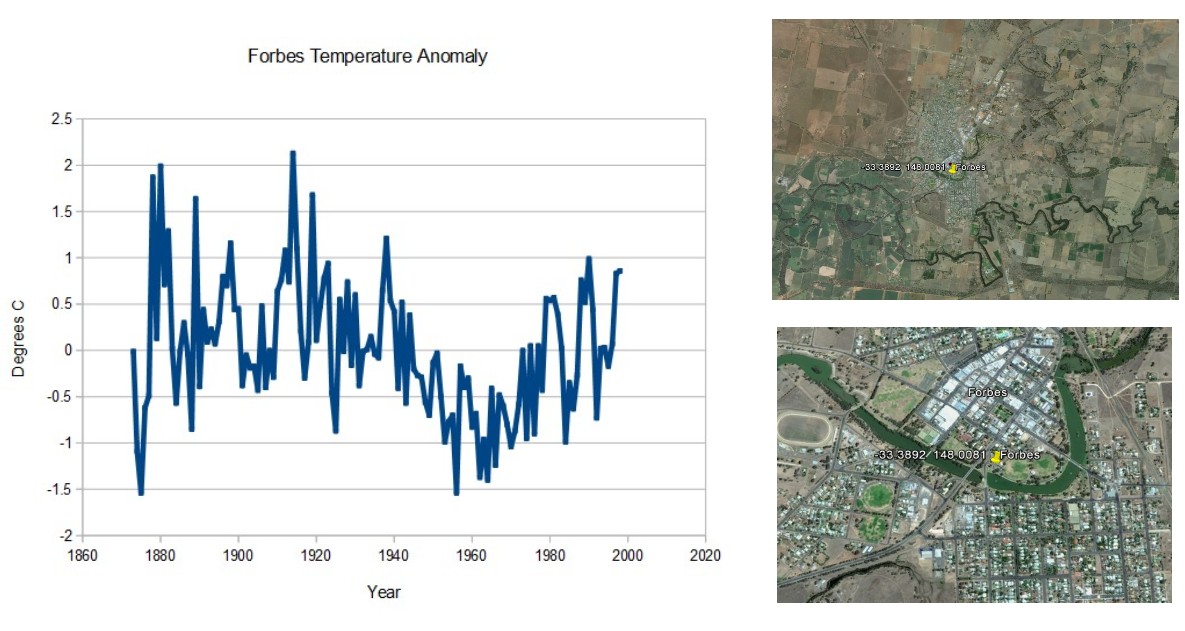
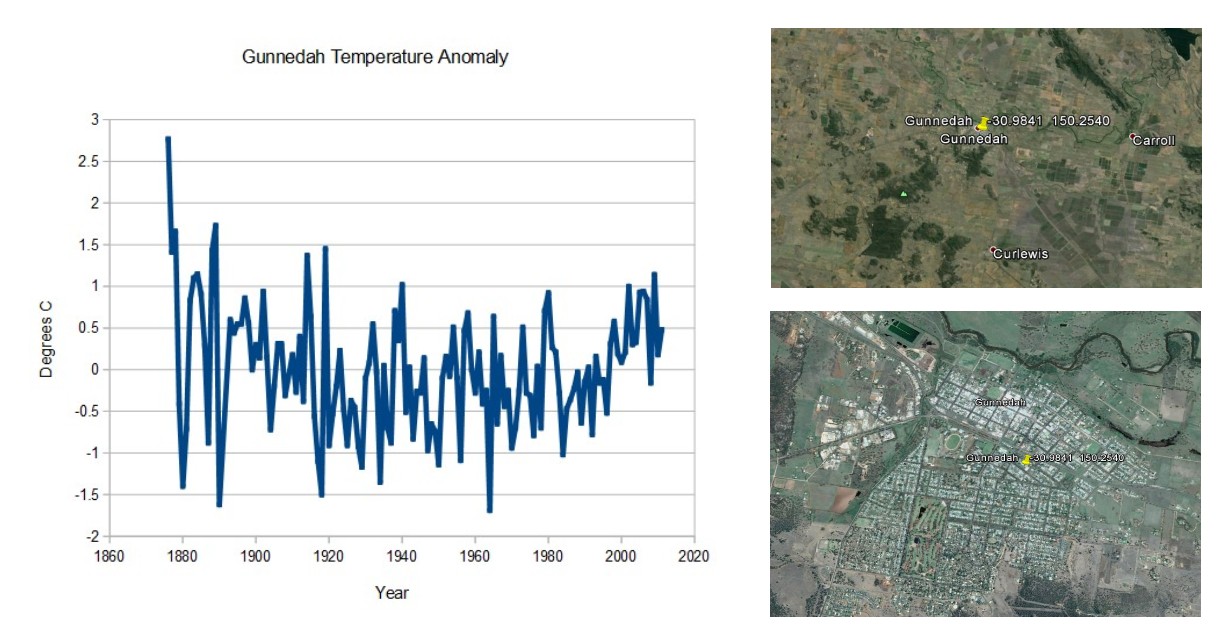
The only conclusion which can be derived from this is that Australia has not warmed long-term, and that BOM claims of record temperatures are due to UHI and/or data tampering.
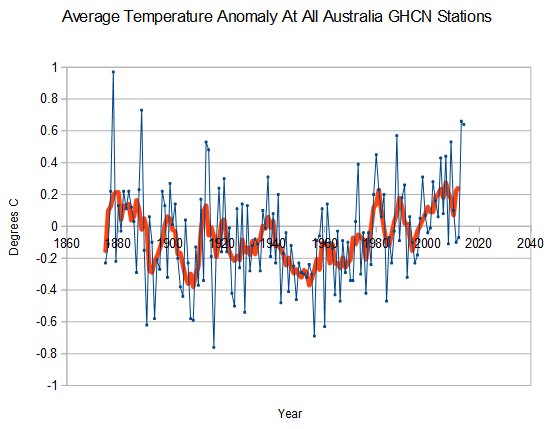
For all GHCN stations in Australia, there is no net warming since 1880
Curry and Mosher tell us that there is no UHI and no warming due to data tampering. First rate comedy.
Only 110 degrees of warming needed to start the Greenland meltdown.

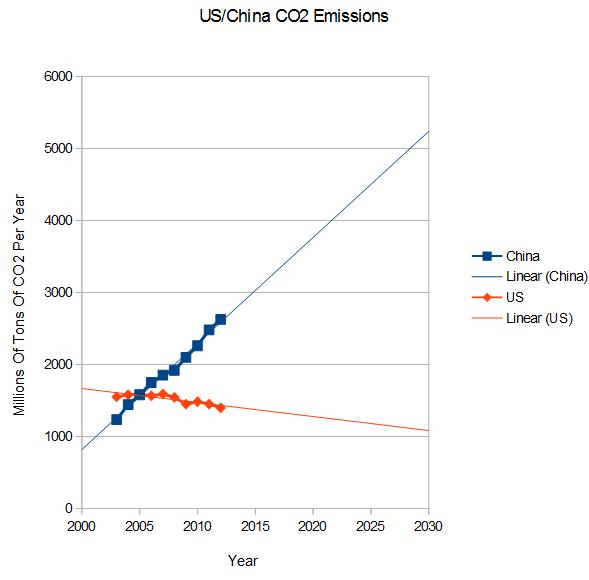
After making a deal with China where the US throttles its energy supply, and China doubles their CO2 emissions through the year 2030 – Obama has done the same with India. The deal has India more than doubling their coal output.
India’s climate change pledge won’t hinder its coal output plan – Economic Times
What Obama is doing has nothing to do with CO2 or climate, because any changes the US makes are in the noise of what is going on in Asia. Obviously there is a different agenda, which requires an army of progressive useful idiots.
When we had the big blowup last summer where Anthony Watts accused me of being wrong about high percentages of missing station data across the entire USHCN data set, Judy Curry finally figured it out after Paul Homewood posted a few examples of what was going on at specific stations.
And two days ago, Judy posted some crap from Zeke and Mosher accusing Paul Homewood of cherry-picking a few stations.
The rules are simple.
This really isn’t that hard to understand.
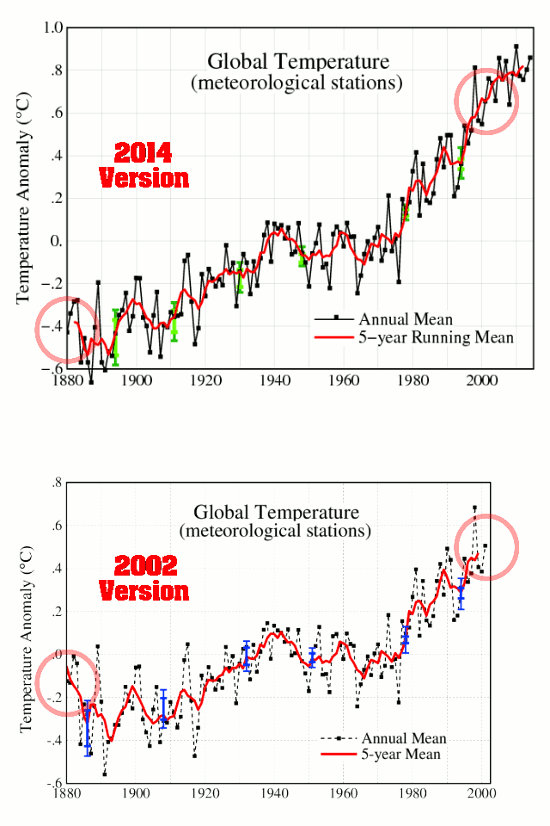
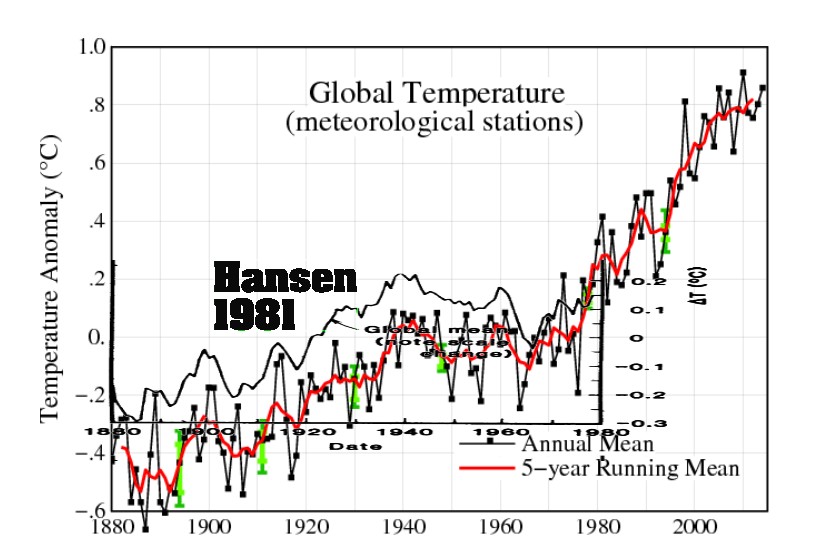
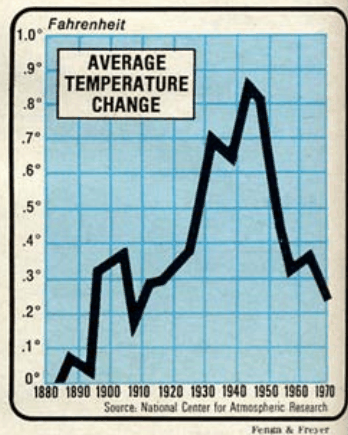
Government agencies produce graphs like these of “independent temperature analysis”
These graphs don’t even vaguely match their own previously published data. The only way they could have ended up so similar is by collusion. Claims of independence are bullshit. Phil Jones admitted that they don’t have any reliable historical SST data over huge swaths of ocean.