





Disrupting the Borg is expensive and time consuming!

Google Search
-
Recent Posts
- Vandalism At The Reflecting Pool
- Fifty Years Ago Today
- Truth Or Consequences
- US Climate Trend Maps
- Declining Spring Snow Cover In Northern New Mexico
- You Can’t Fool Mother Nature
- Cattle And The Climate
- One Atomic Bomb Per Hour
- New Video : Analyzing Oil And Gas
- Is Antarctica Melting?
- High Speed Analysis And Visualization
- El Nino To The Rescue?
- Fake News Update
- Growth Of Antarctic Sea Ice
- 65 Years Of Progress!
- El Nino To The Rescue?
- Worst March Drought On Record
- ChartGL Process Control Demo
- The Biggest Money Laundering Scam
- Drought In The Headwaters Of Lake Powell
- Unrealistic Expectations Of Water Availability
- Did Bill Gates Do This?
- Worst March Drought On Record In The US
- The Real Hockey Stick Graph
- Analyzing The Western Water Crisis
August 2026 M T W T F S S 1 2 3 4 5 6 7 8 9 10 11 12 13 14 15 16 17 18 19 20 21 22 23 24 25 26 27 28 29 30 31 Recent Comments
- Chuck on Truth Or Consequences
- Gerald Machnee on Fifty Years Ago Today
- conrad ziefle on Fifty Years Ago Today
- Bob G on Truth Or Consequences
- Weylan McAnally on One Atomic Bomb Per Hour
- conrad ziefle on Declining Spring Snow Cover In Northern New Mexico
- Bob G on You Can’t Fool Mother Nature
- Ivan G Wainwright on You Can’t Fool Mother Nature
- conrad ziefle on You Can’t Fool Mother Nature
- Bob G on You Can’t Fool Mother Nature
Eisenhower’s Prophetic Warning From 55 Years Ago
In 1960, Eisenhower foresaw the possibility of a moron like Obama following him.
The prospect of domination of the nation’s scholars by Federal employment, project allocation, and the power of money is ever present and is gravely to be regarded.
Yet in holding scientific discovery in respect, as we should, we must also be alert to the equal and opposite danger that public policy could itself become the captive of a scientific-technological elite.
– President Eisenhower 1960
Posted in Uncategorized
22 Comments
It Is The UHI, Stupid
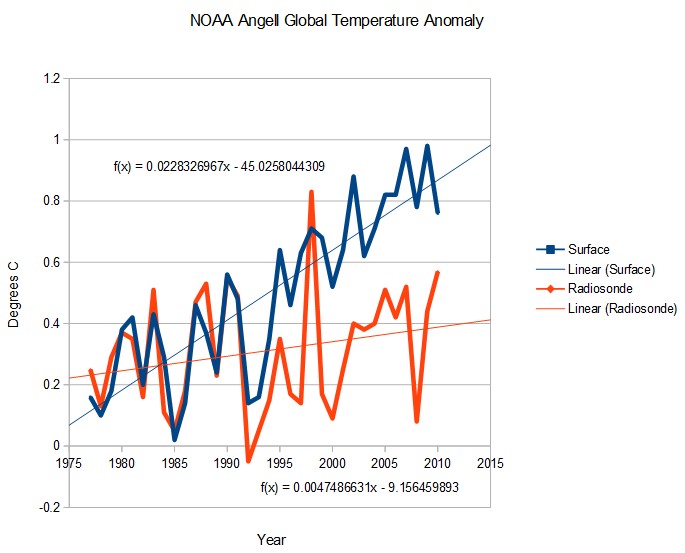
Since the PDO shift in 1977, surface temperatures are increasing four times faster than 850-300 mb radiosonde temperatures.
Climate experts ignore this, because it doesn’t support the necessary propaganda required to keep funding flowing.
Posted in Uncategorized
14 Comments
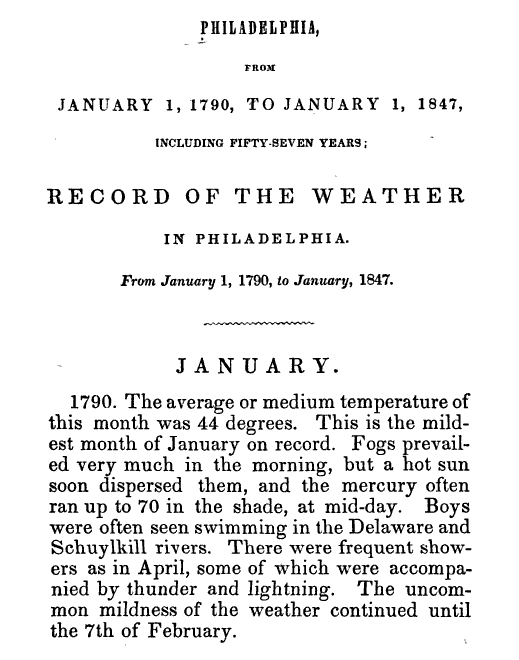
Philadelphia Was 14 Degrees Colder Last Month Than 1790
Philadelphia averaged 30F last month – fourteen degrees colder than January, 1790.
Posted in Uncategorized
9 Comments
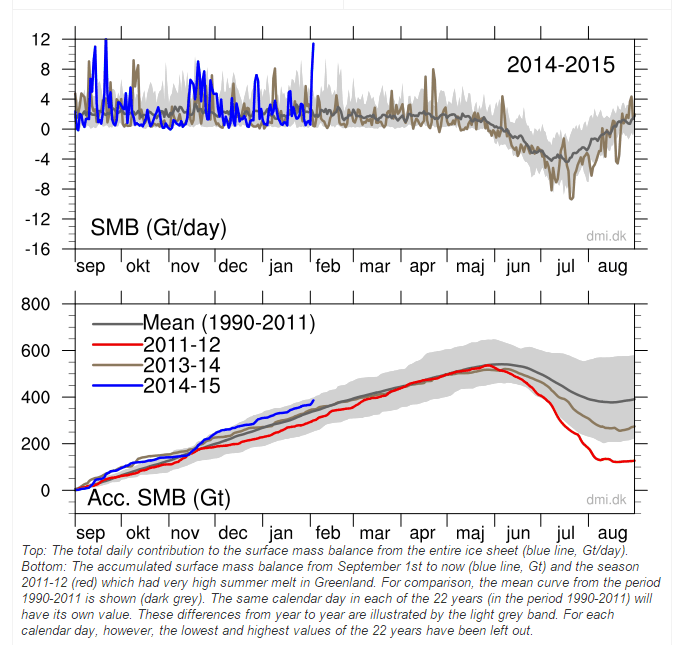
After Another Record Snowfall, Greenland Approaches A Record For Mass Gain
Greenland just gained 12 billion tons of snow in one day, and is approaching a record amount of mass gain.
This is the part where alarmists say “glaciers are calving faster than new ice is forming.” They don’t understand that glacial flow is a delayed response to the accumulation of excess snow. They also don’t understand that small changes in gravity measurements are useless for measuring changes of ice mass in a dynamic geological environment.
Posted in Uncategorized
19 Comments
100% Of Reported US Warming Since 1990 Is Fake
The animation below flashes between the average of measured adjusted USHCN temperatures, and the estimated (infilled) ones – which are marked with an “E”
As you can see, all US warming since 1990 is due to infilling fake data. And even the measured zero warming temperatures have been tampered with using various other adjustments.
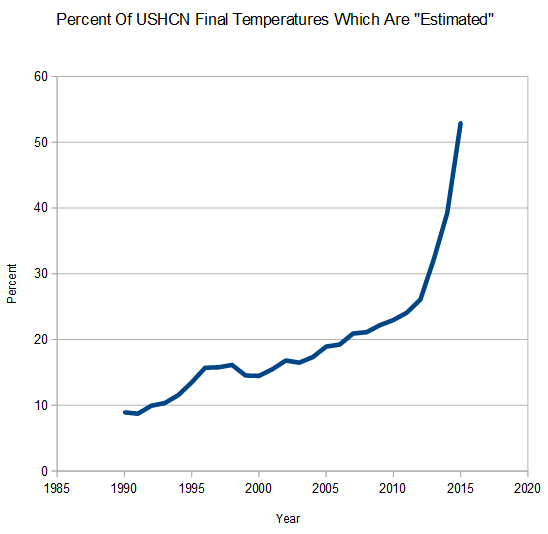
USHCN is losing data at a spectacular rate over the last three years, with more than 50% of the 2015 data marked as estimated, and nearly 40% of the 2014 data marked as estimated.
Temperature analysis reported by NCDC to 0.01 degrees are scientific malfeasance. They probably aren’t accurate within 1.0 degrees.
Posted in Uncategorized
20 Comments
NCDC Data Fabrication Is Skewed Towards Warming
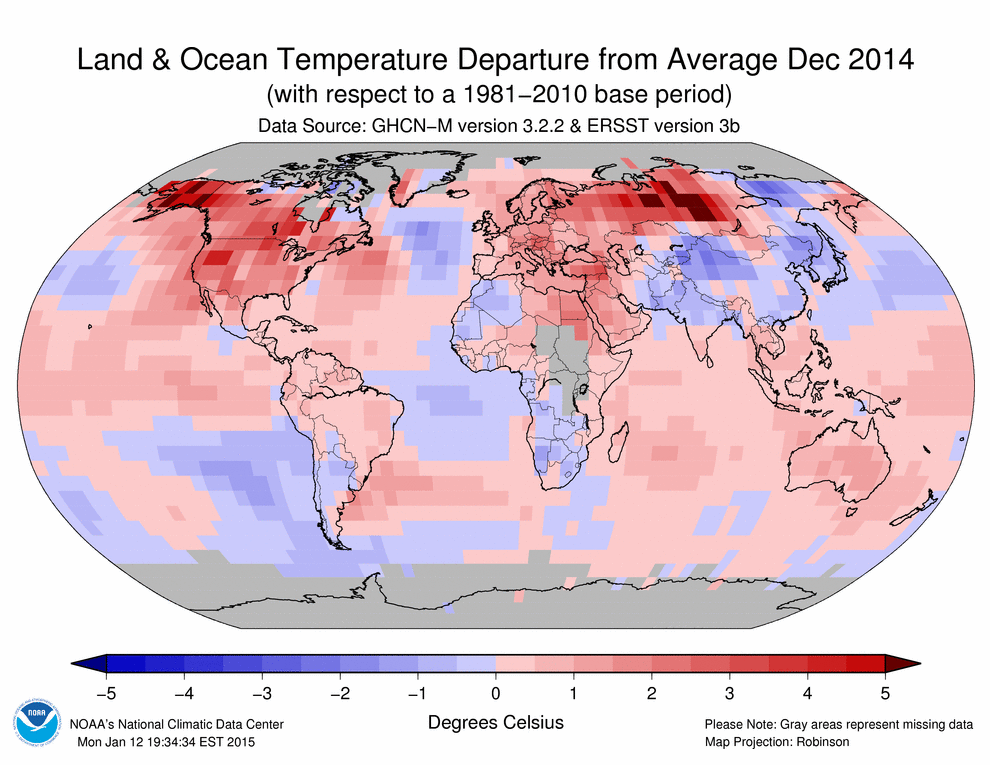
NCDC publishes lots of bright red maps like this one, where most of the surface temperatures are fake.
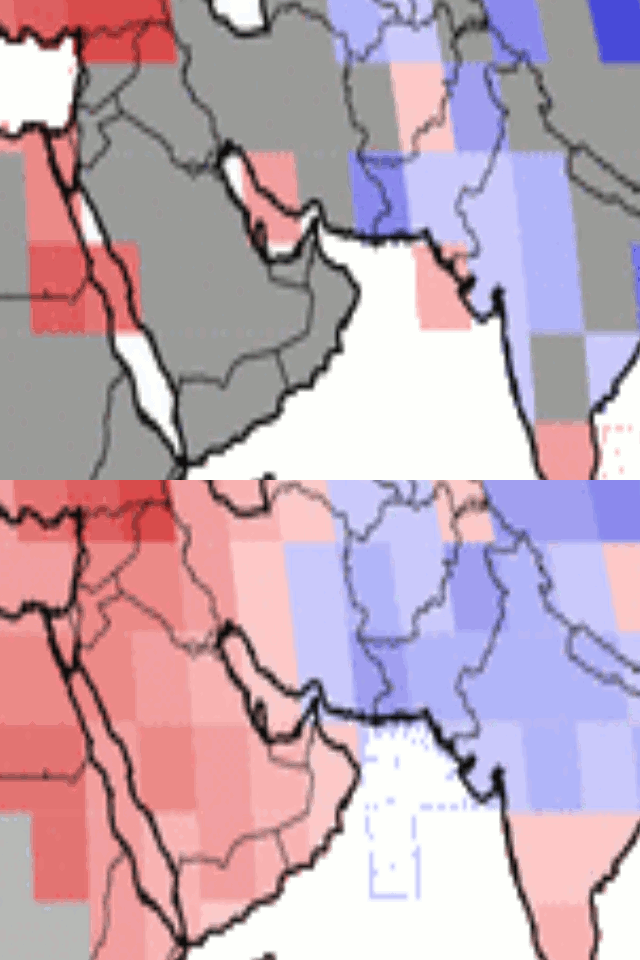
The animation below flashes between the measured and reported data. In December, 2014 they turned Saudi Arabia red hot without a single thermometer reading in the country, despite the fact that most of the measured data in the region was below normal.
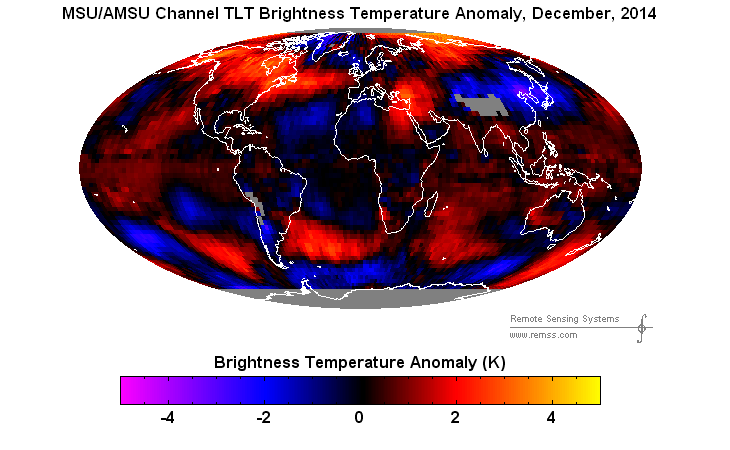
Satellite data showed that most of Saudi Arabia was cooler than normal in December
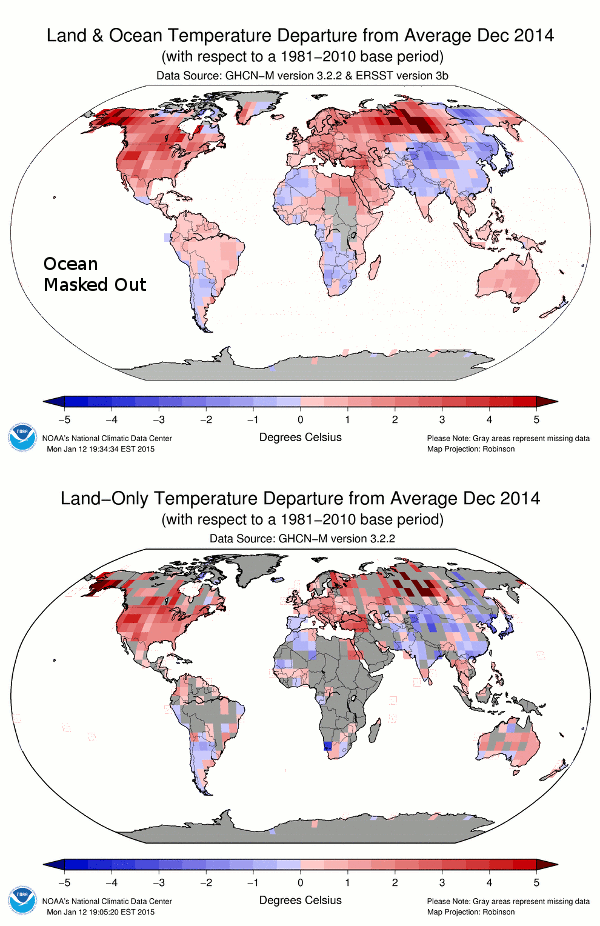
NCDC creates fake temperatures for the majority of the land surface using an algorithm which skews temperatures upwards, then reports a record temperature by 0.02 degrees.
Scientific malfeasance doesn’t get much worse than this.
Posted in Uncategorized
7 Comments
Odds Of Gavin And Tom’s Data Tampering Being Correct Are Close To Zero
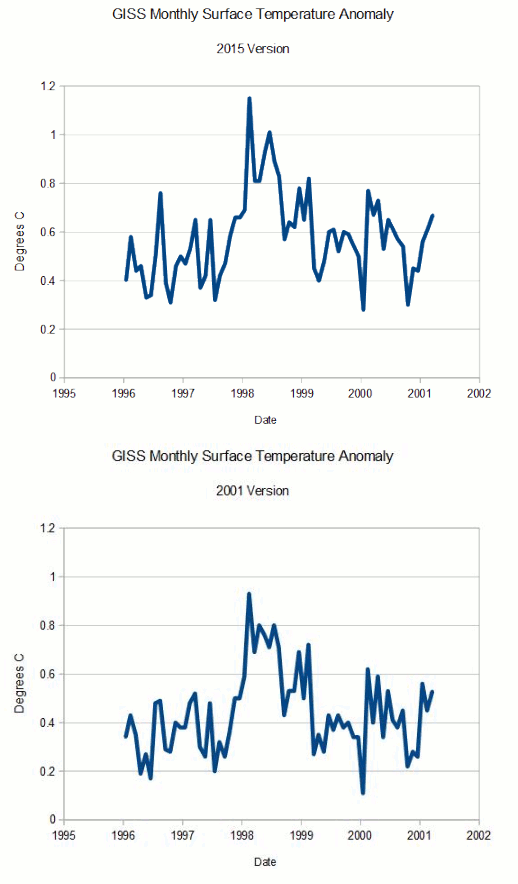
In my previous post, I showed the spectacular data tampering at GISS during the 1990’s. But it is much worse than it seems. GISS publishes a data set called Fig C which keeps the monthly temperature anomalies over a certain time window.
The animation below shows all of the overlapping months reported in the 2001 and 2015 data sets. As you can see, every single month except one has been adjusted upwards. The odds of that happening randomly are very close to zero.
I am reminded every day by alarmists that Anthony Watts and Judith Curry have criticized my work exposing this tampering, and I would appreciate these highly respected skeptics clearly setting the record straight about what they believe is incorrect about this analysis.
Posted in Uncategorized
46 Comments
One Of My Favorite Videos
[youtube=https://www.youtube.com/watch?v=Uuzmub5PXNQ]
Posted in Uncategorized
22 Comments
Gavin’s Spectacular Data Tampering In The 1990’s
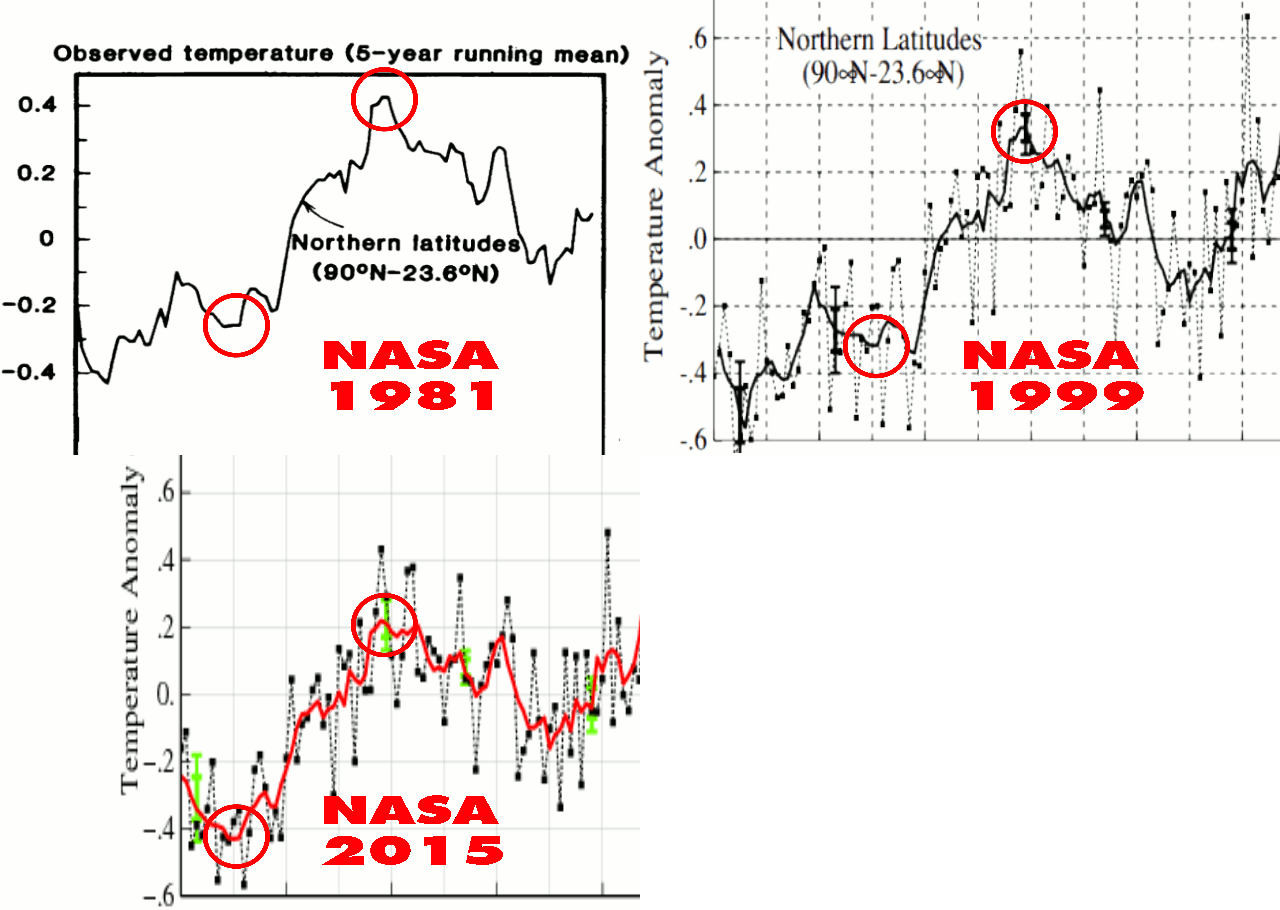
Earlier today I showed Gavin’s spectacular data tampering before 1980, to create the lower half of the hockey stick.
1981 version : 1981_Hansen_etal_1.pdf
1999 version : 1999_Hansen_etal_1.pdf
Current version : Fig.B.gif (407×678)
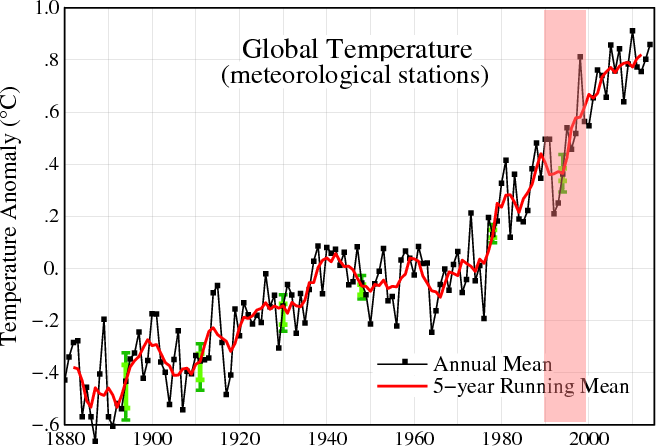
But that is only half of the hockey stick. Some of Gavin’s finest tampering is done in the 1990’s data.
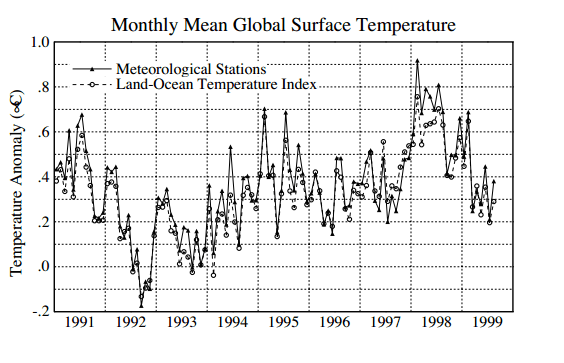
Hansen 1999 showed no net warming during the 1990’s
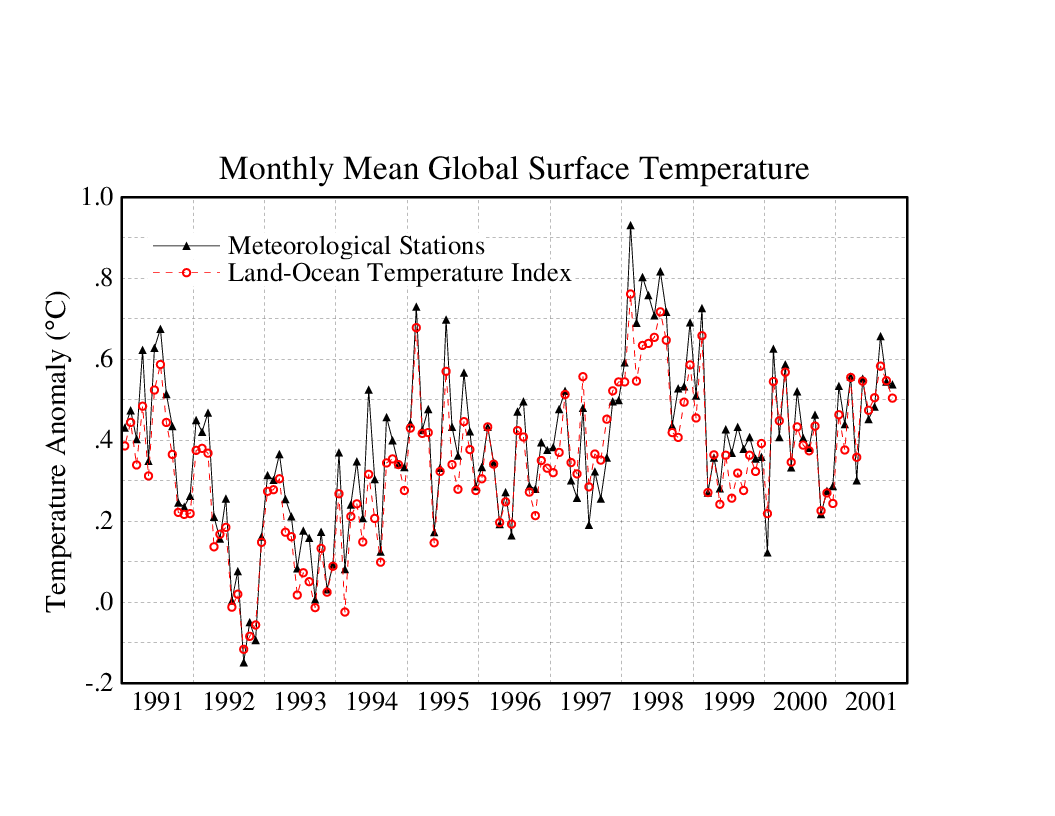
In 2001, the GISS website also showed no net warming during the 1990’s
But GISS now shows the 1990’s as the fastest warming decade.
They built the rest of the hockey stick by simply making up data.
This image shows how the 1990’s station data has been altered since Hansen 1999.
The animation below shows the spectacular alterations to GISS 1990’s surface between 2001 and 2015, tripling the warming during the decade.
We also know that the post 2000 warming is fake, because none of the other data sets show any warming post 2000.
In summary, the entire blade of the hockey stick is a fraud, from one end to the other.
Posted in Uncategorized
33 Comments