Disrupting the Borg is expensive and time consuming!
Google Search
-
Recent Posts
- Vandalism At The Reflecting Pool
- Fifty Years Ago Today
- Truth Or Consequences
- US Climate Trend Maps
- Declining Spring Snow Cover In Northern New Mexico
- You Can’t Fool Mother Nature
- Cattle And The Climate
- One Atomic Bomb Per Hour
- New Video : Analyzing Oil And Gas
- Is Antarctica Melting?
- High Speed Analysis And Visualization
- El Nino To The Rescue?
- Fake News Update
- Growth Of Antarctic Sea Ice
- 65 Years Of Progress!
- El Nino To The Rescue?
- Worst March Drought On Record
- ChartGL Process Control Demo
- The Biggest Money Laundering Scam
- Drought In The Headwaters Of Lake Powell
- Unrealistic Expectations Of Water Availability
- Did Bill Gates Do This?
- Worst March Drought On Record In The US
- The Real Hockey Stick Graph
- Analyzing The Western Water Crisis
August 2026 M T W T F S S 1 2 3 4 5 6 7 8 9 10 11 12 13 14 15 16 17 18 19 20 21 22 23 24 25 26 27 28 29 30 31 Recent Comments
- Chuck on Truth Or Consequences
- Gerald Machnee on Fifty Years Ago Today
- conrad ziefle on Fifty Years Ago Today
- Bob G on Truth Or Consequences
- Weylan McAnally on One Atomic Bomb Per Hour
- conrad ziefle on Declining Spring Snow Cover In Northern New Mexico
- Bob G on You Can’t Fool Mother Nature
- Ivan G Wainwright on You Can’t Fool Mother Nature
- conrad ziefle on You Can’t Fool Mother Nature
- Bob G on You Can’t Fool Mother Nature
Great Lakes Ice Cover Far Above Normal Again
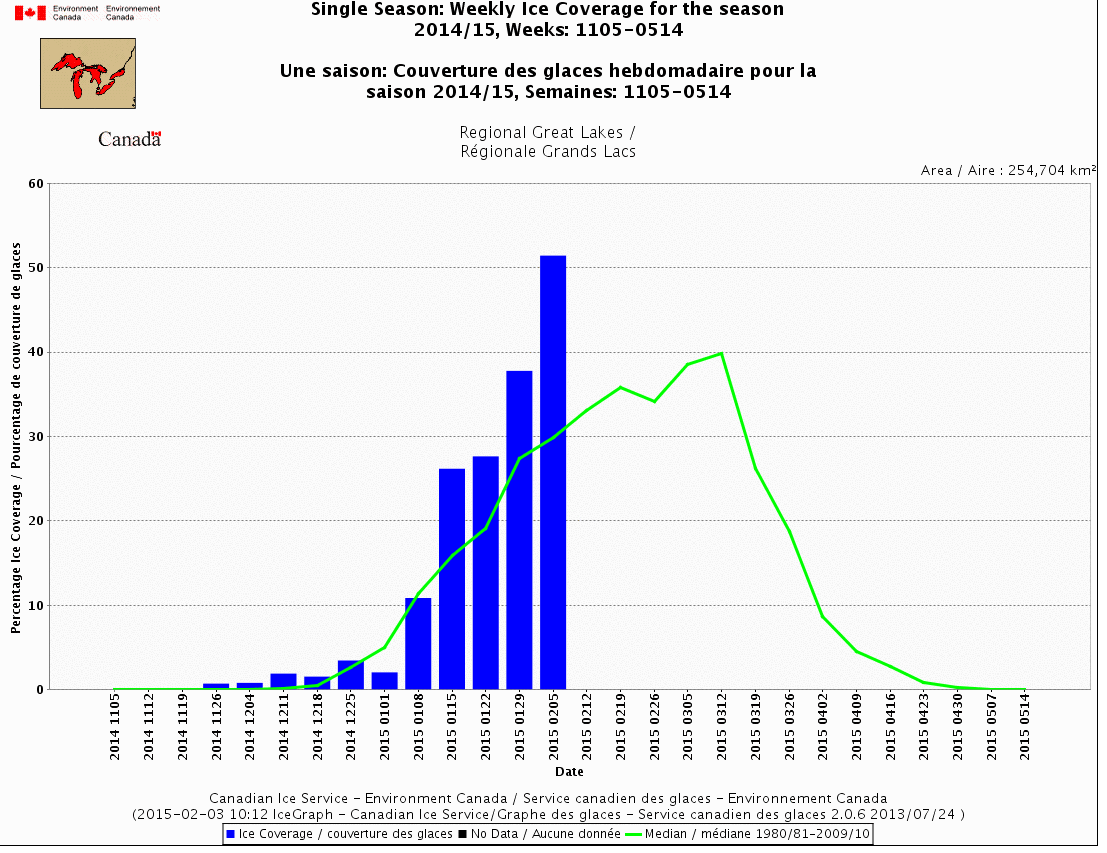
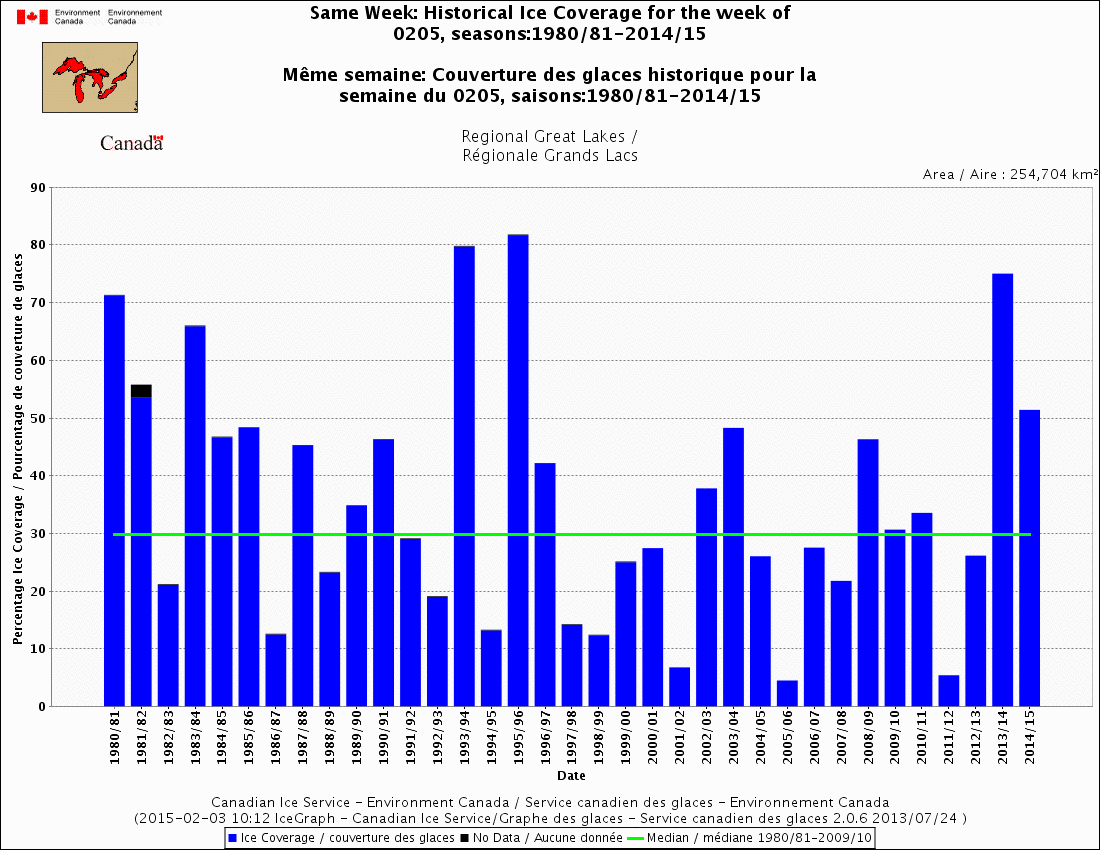
Great Lakes ice cover has been above normal five of the last seven years, and seven of the last thirteen years. It is already far above the normal annual maximum, with another month of growth left.
Many experts claim the exact opposite, because their career depends on lying about the climate.
Posted in Uncategorized
44 Comments
Hansen and Schmidt Removing The 1940’s Blip
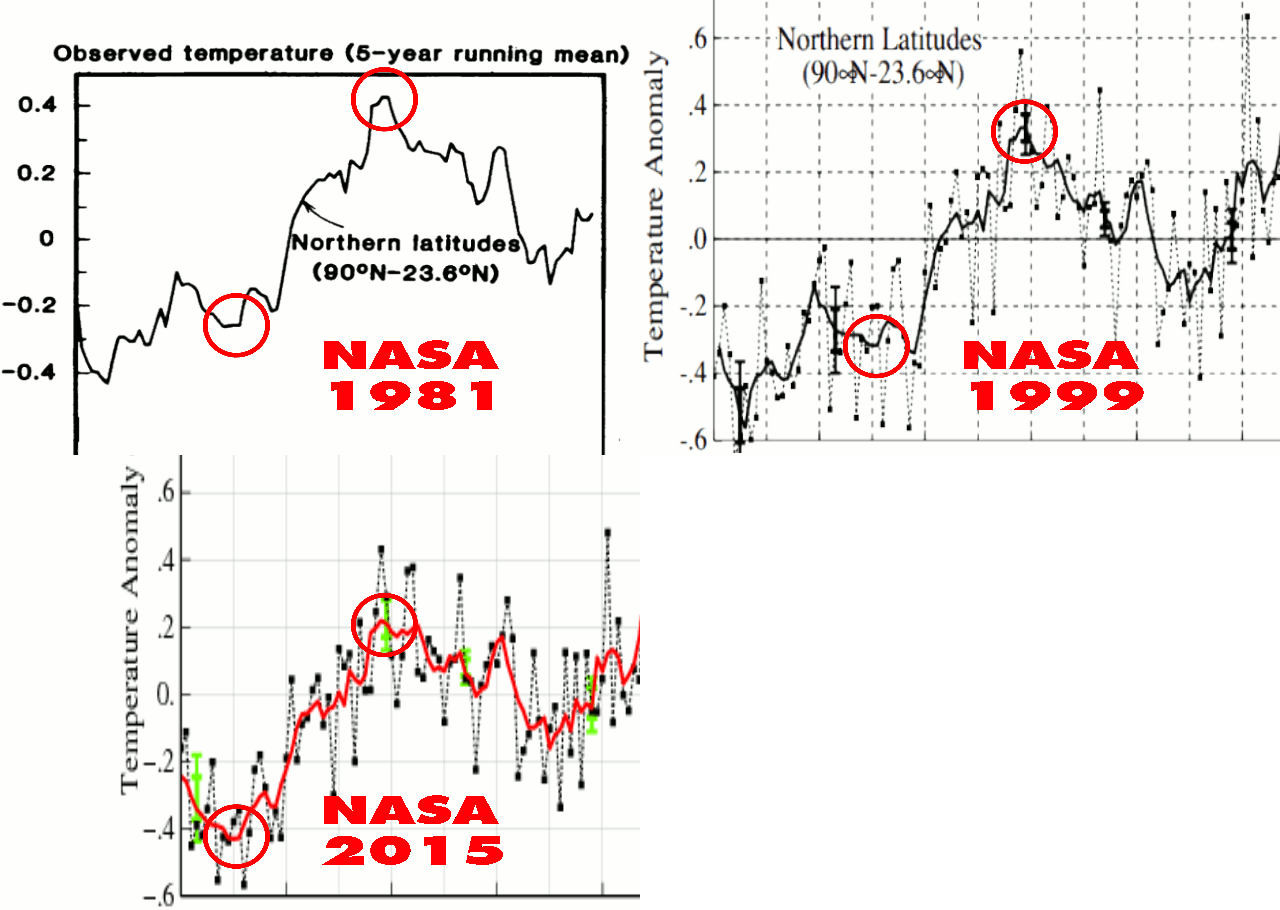
In 1981, Hansen reported high temperatures at the Northern Latitudes (23.6N – 90N) around 1940, followed by a strong cooling. But that didn’t support the theory, so NASA’s finest simply made the 1940’s blip disappear through repeated data tampering.
1981 version : 1981_Hansen_etal_1.pdf
1999 version : 1999_Hansen_etal_1.pdf
Current version : Fig.B.gif (407×678)
They climategate team didn’t like the 1940’s blip, so they disappeared it.
From: Tom Wigley <[email protected]>
To: Phil Jones <[email protected]>
Subject: 1940s
Date: Sun, 27 Sep 2009 23:25:38 -0600
Cc: Ben Santer <[email protected]>It would be good to remove at least part of the 1940s blip, but we are still left with “why the blip”.
Posted in Uncategorized
21 Comments
Hot Days Are A Thing Of The Past In Minnesota
Ninety degree days used to be fairly common in Minnesota, but over they almost never happen any more. The last really hot summer was 1988 – apparently Hansen’s 1988 Congressional testimony ended global warming in Minnesota
Posted in Uncategorized
6 Comments
A Change Of Tack
Skeptics need to stop being defensive.
A Mann-made shortage of fossil fuels would be an environmental catastrophe. Every tree in the forest would be chopped down for firewood, Every animal in the wild would be hunted to extinction for food. The air would be unbreathable from the smoke of burning wood.
Alarmists are lying about everything. They lie about the past climate. They lie about the current climate. They lie about the future climate. They lie about the potential for wind and solar. They lie about their fake climate deals with China. They lie about their motivations for blocking pipelines.
These people are the scum of the Earth, and they threaten our children’s future. Why are so called conservative politicians pandering to them?
Posted in Uncategorized
42 Comments
More Than Half Of NCDC December Land Temperatures Were Fake
After the announcement of hottest year ever, the reason given to ignore satellite temperatures was because “we don’t live in the troposphere.” Apparently we must be fish, because the land temperatures were not the hottest ever. And I am pretty sure that we do actually live in the troposphere.
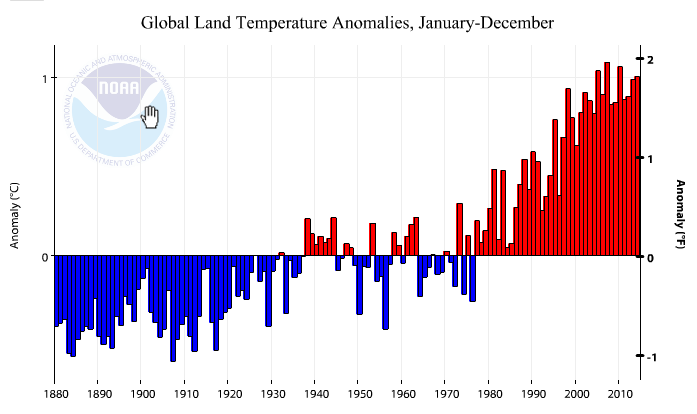
Climate at a Glance: Time Series | National Climatic Data Center (NCDC)
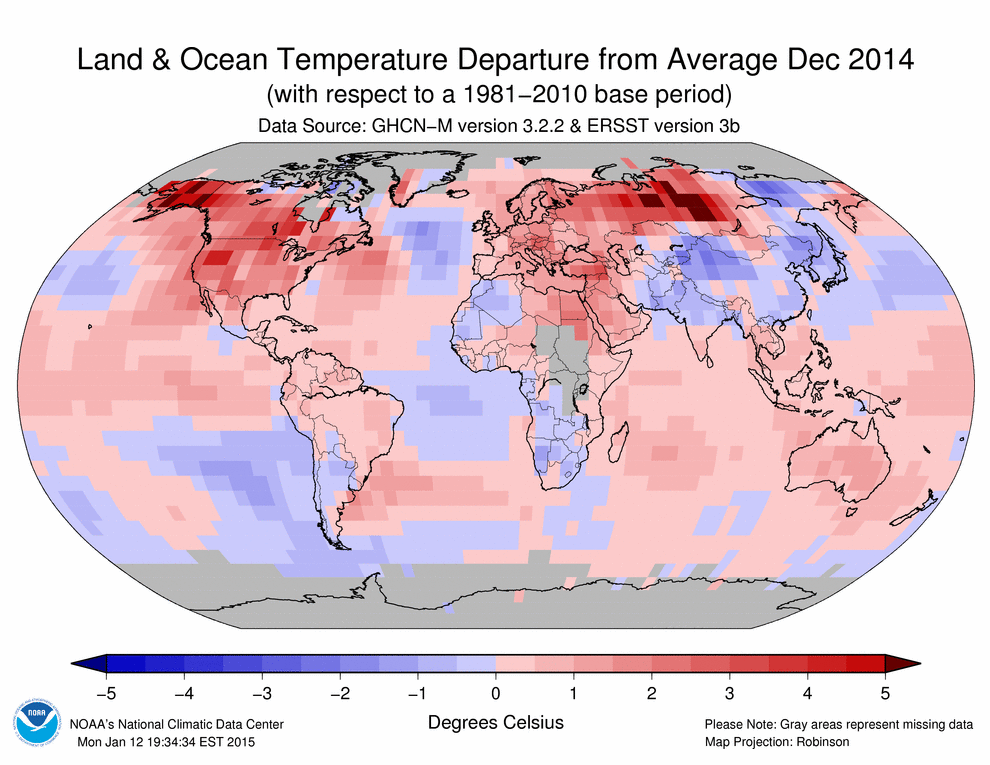
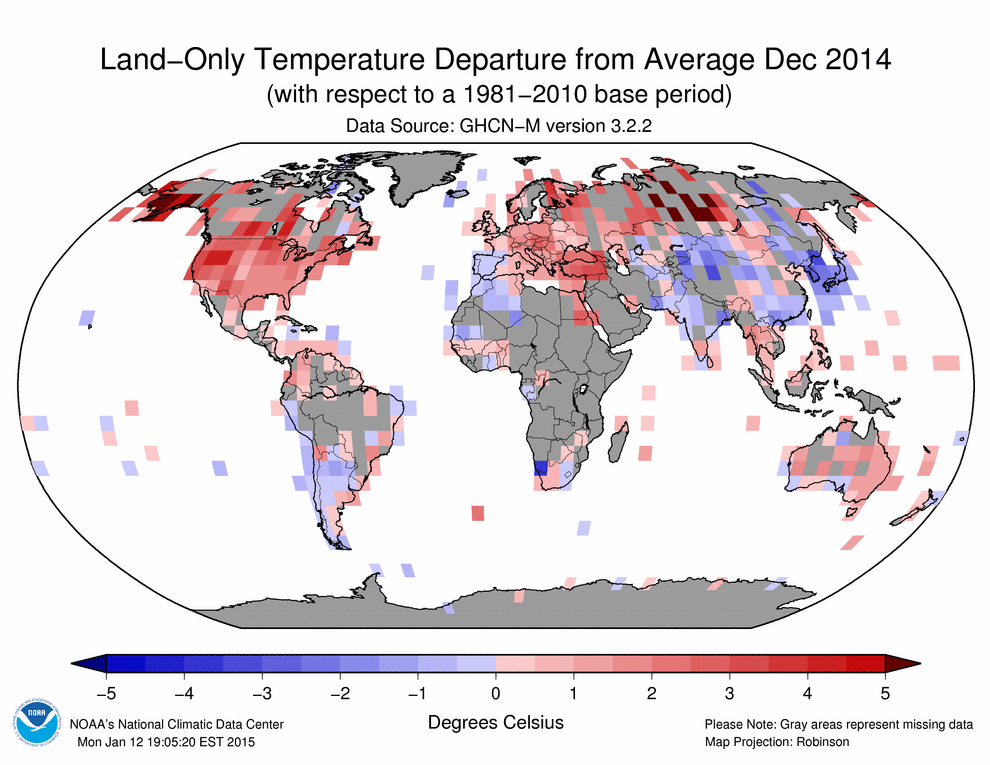
But it is much worse than it seems. 58% of the land temperatures reported by NCDC for December were completely fake – as shown in the animation below which has ocean temperatures masked out.
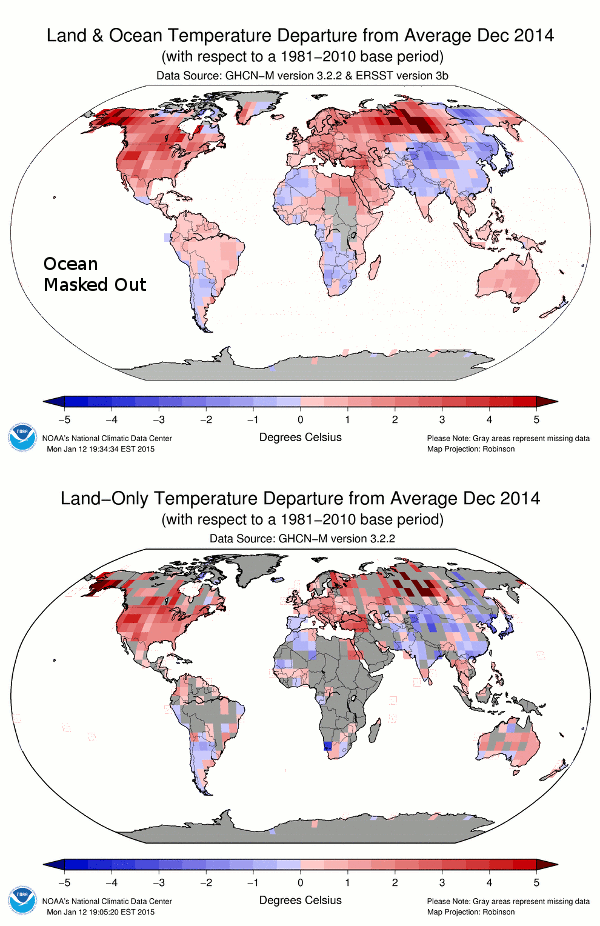
Land-ocean 201412.gif (990×765)
Land 201412.gif (990×765)
The graph below shows the pixel counts of measured and published land temperatures. As you can see, the vast majority of fake pixels have positive anomalies. Their algorithms (which “work as designed”) skew fake data towards high temperatures..
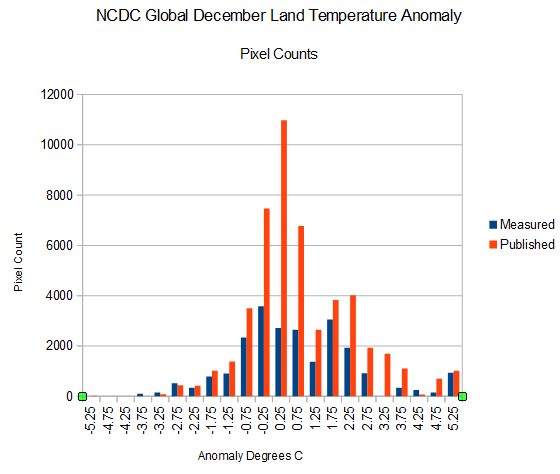
The reported December land anomaly was 1.36C, but the average anomaly of the measured data showed only 0.71C. Mind boggling temperature fraud by NCDC.

Posted in Uncategorized
10 Comments
Pattern Matching Quiz
Posted in Uncategorized
26 Comments
IT Must Be A High CO2 Day
I woke up this morning and immediately sensed that CO2 levels were up 0.000001 mole fraction from last year. Then I removed the pea from under the 14th mattress, and went back to sleep.
Posted in Uncategorized
9 Comments