We Have New Winners For Stupidest Scientists Of The Day

Arctic Ice Melt Seen Doubling Risk of Harsh Winter in EU
By Stefan Nicola
Oct 26, 2014 2:00 PM ET

The decline in Arctic sea ice has doubled the chance of severe winters in Europe andAsia in the past decade, according to researchers in Japan.

Sea-ice melt in the Arctic, Barents and Kara seas since 2004 has made more than twice as likely atmospheric circulations that suck cold Arctic air to Europe and Asia, a group of Japanese researchers led by the University of Tokyo’s Masato Mori said in a study published today in Nature Geoscience.

“This counterintuitive effect of the global warming that led to the sea ice decline in the first place makes some people think that global warming has stopped. It has not,” Colin Summerhayes, emeritus associate of the Scott Polar Research Institute, said in a statement provided by the journal Nature Geoscience, where the study is published.

To reach their findings, they had performed about 200 computer simulations of the global atmospheric circulation using a model based on two distinct settings for Arctic sea-ice concentrations.

Arctic Ice Melt Seen Doubling Risk of Harsh Winter in EU – Bloomberg

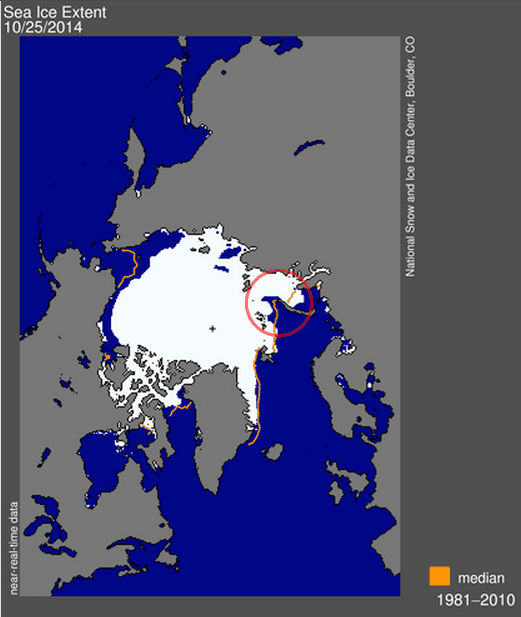
Sea ice extent in the Barents and Kara Seas is normal. More expensive taxpayer funded fact-free science from the team.
ScreenHunter_4099 Oct. 26 18.18

N_daily_extent.png (420×500)

Posted in Uncategorized | 34 Comments

Another Graphical View Of NCDC Fraud

ScreenHunter_3924 Oct. 22 07.21

High and Low Temperatures | Climate Change | US EPA

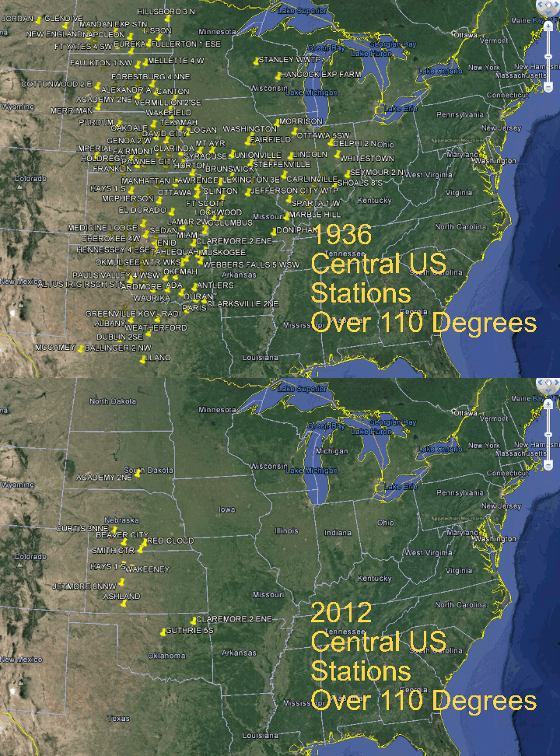
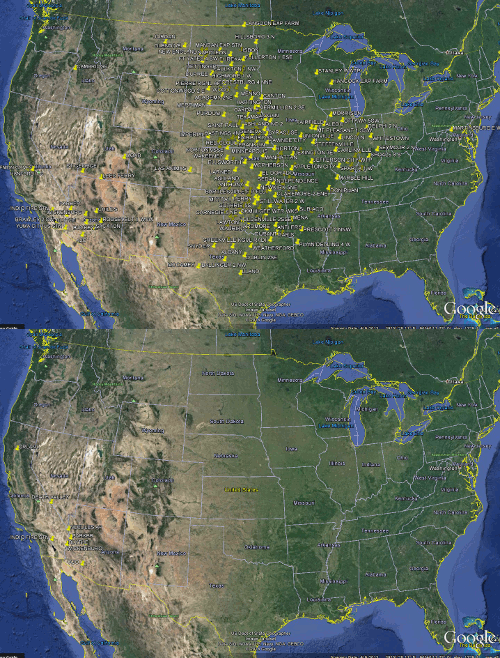
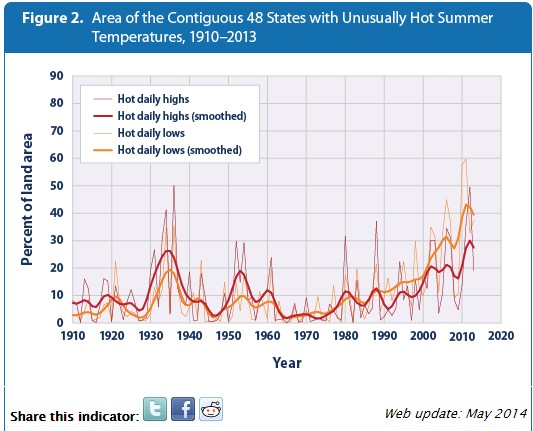
NCDC and EPA claim that hot summer maximums were more widespread in 2012 than they were in 1936. The animation below shows how spectacularly fraudulent those claims are.

CentralUS2012vs1936_110

2012 wasn’t even in the same ballpark as 1936. This is just blatant fraud.

There were no 110 degree temperatures in the central US this year.

ScreenHunter_4097 Oct. 26 16.27

Posted in Uncategorized | 9 Comments

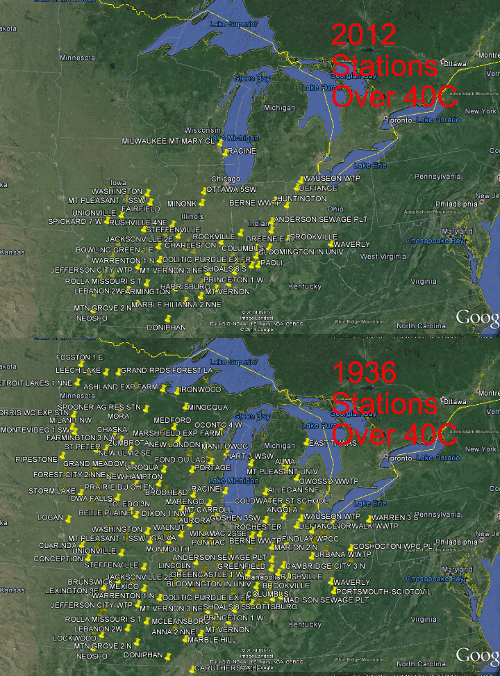
Heat In The Midwest Was Far More Widespread In 1936

Contrary to the BS being propagated by NCDC, heat in the midwest was far hotter and more widespread in 1936 than it was in 2012.

Midwest2012vs1936_110

Posted in Uncategorized | 1 Comment

More From The NCDC Fraud Department

NCDC claims that the summer of 2012 had more widespread “unusually hot daily high temperatures” than the summer of 1936.

ScreenHunter_3924 Oct. 22 07.21

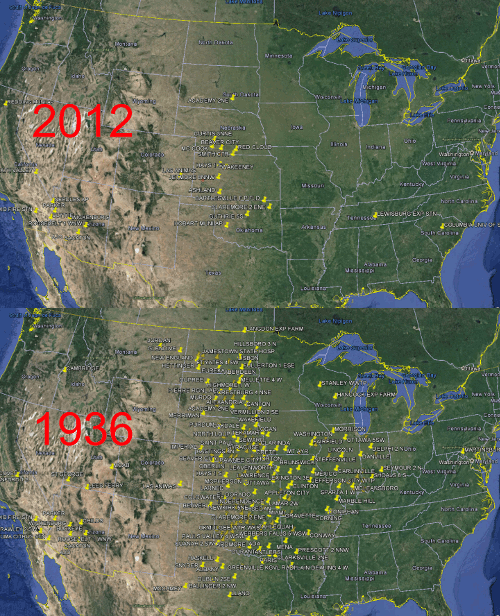
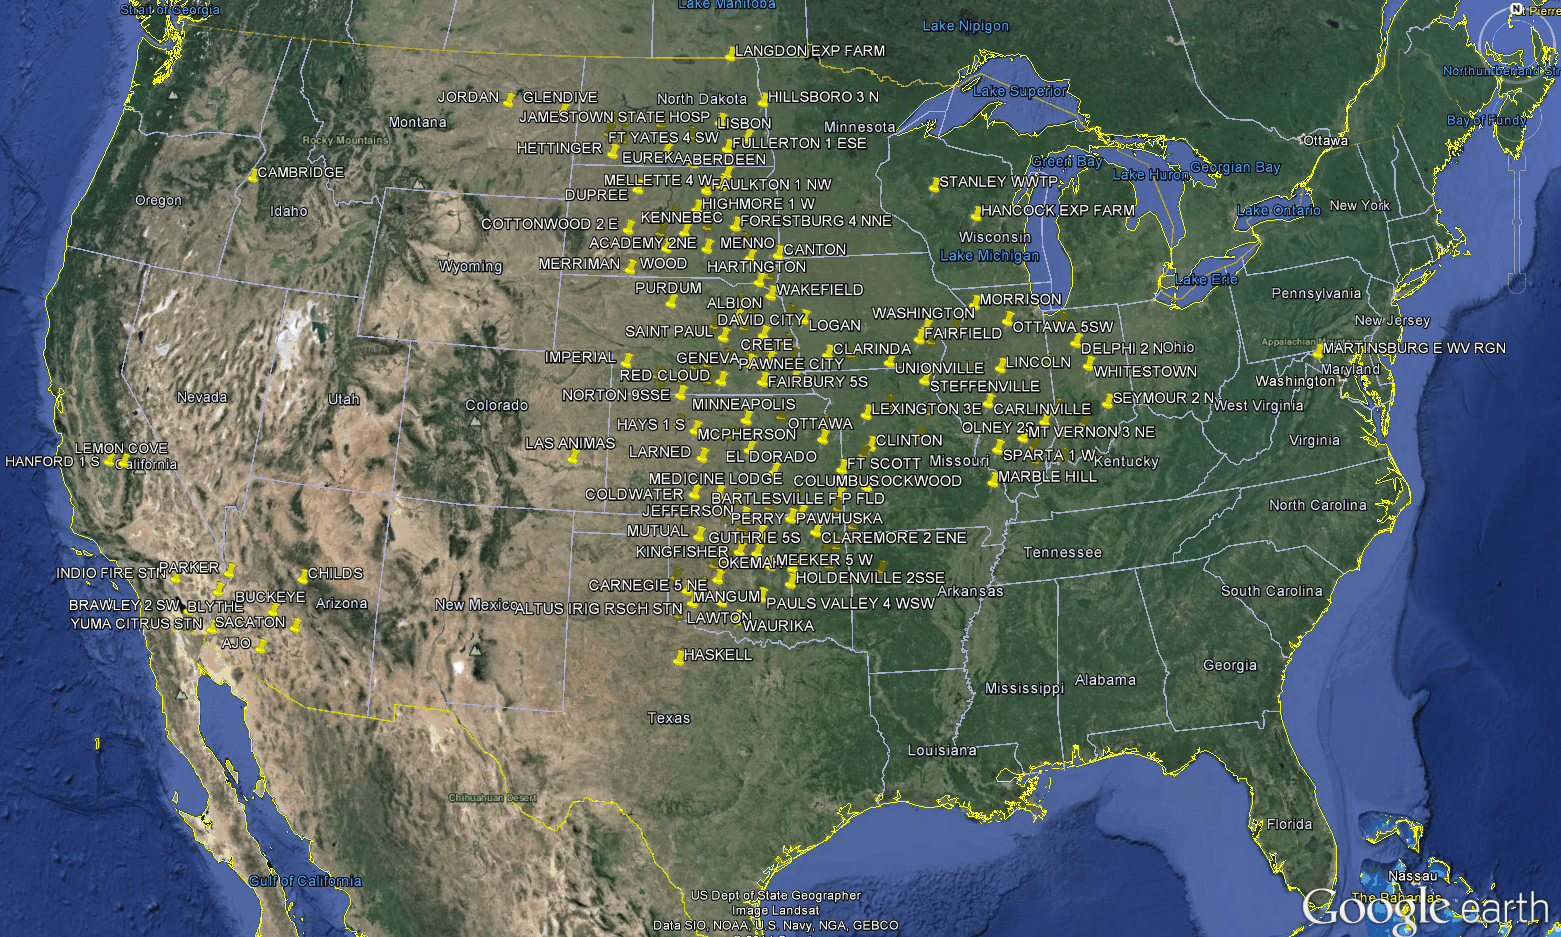
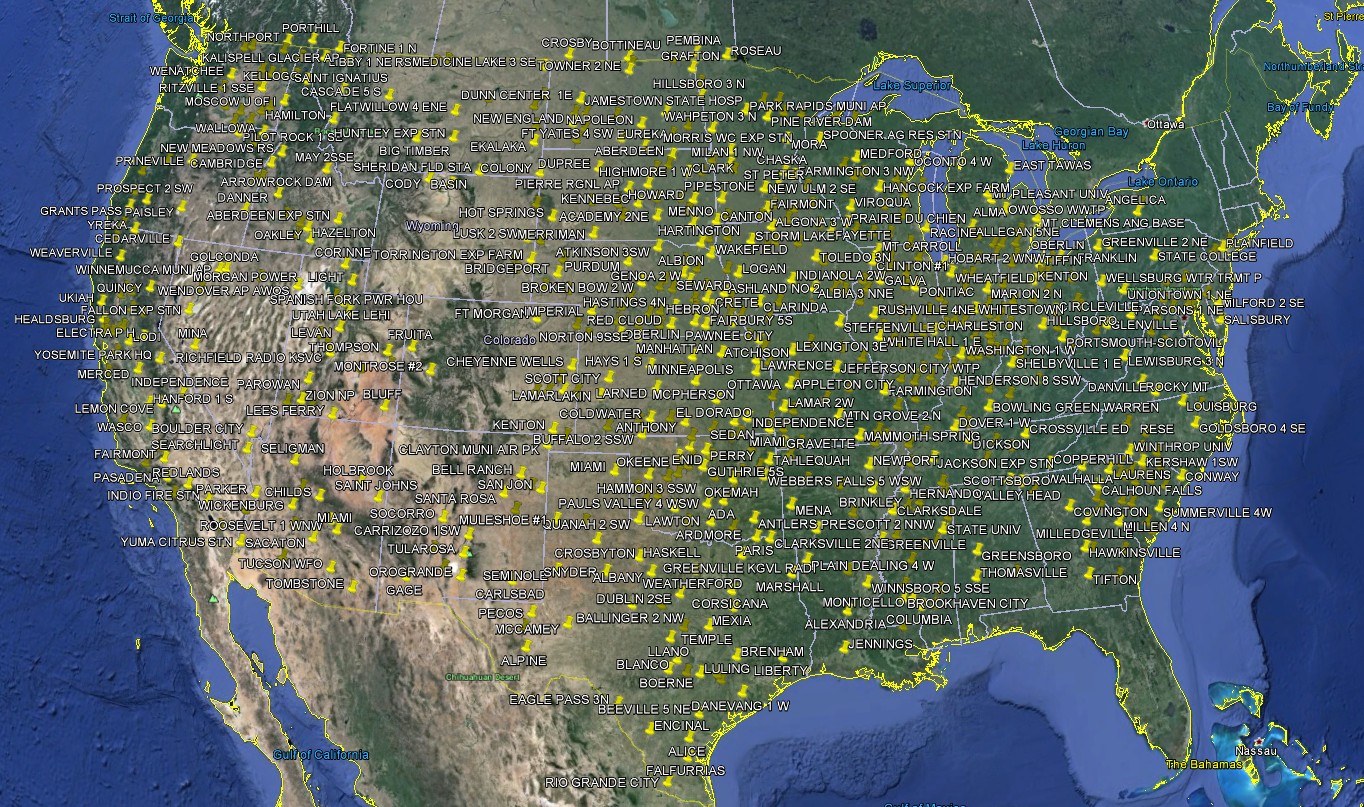
This is complete bullshit. The maps below show the HCN stations over 110 degrees during the summers of 2012 and 1936. Hot weather was much more widespread in 1936 than it was in 2012.

Summer2012 Summer1936 The animation below flashes between the two summers. As you can see, NCDC is committing blatant fraud.

Summer2012vs1936_110

Posted in Uncategorized | 4 Comments

A Good Visualization Of The Magnitude Of Data Tampering At NCDC

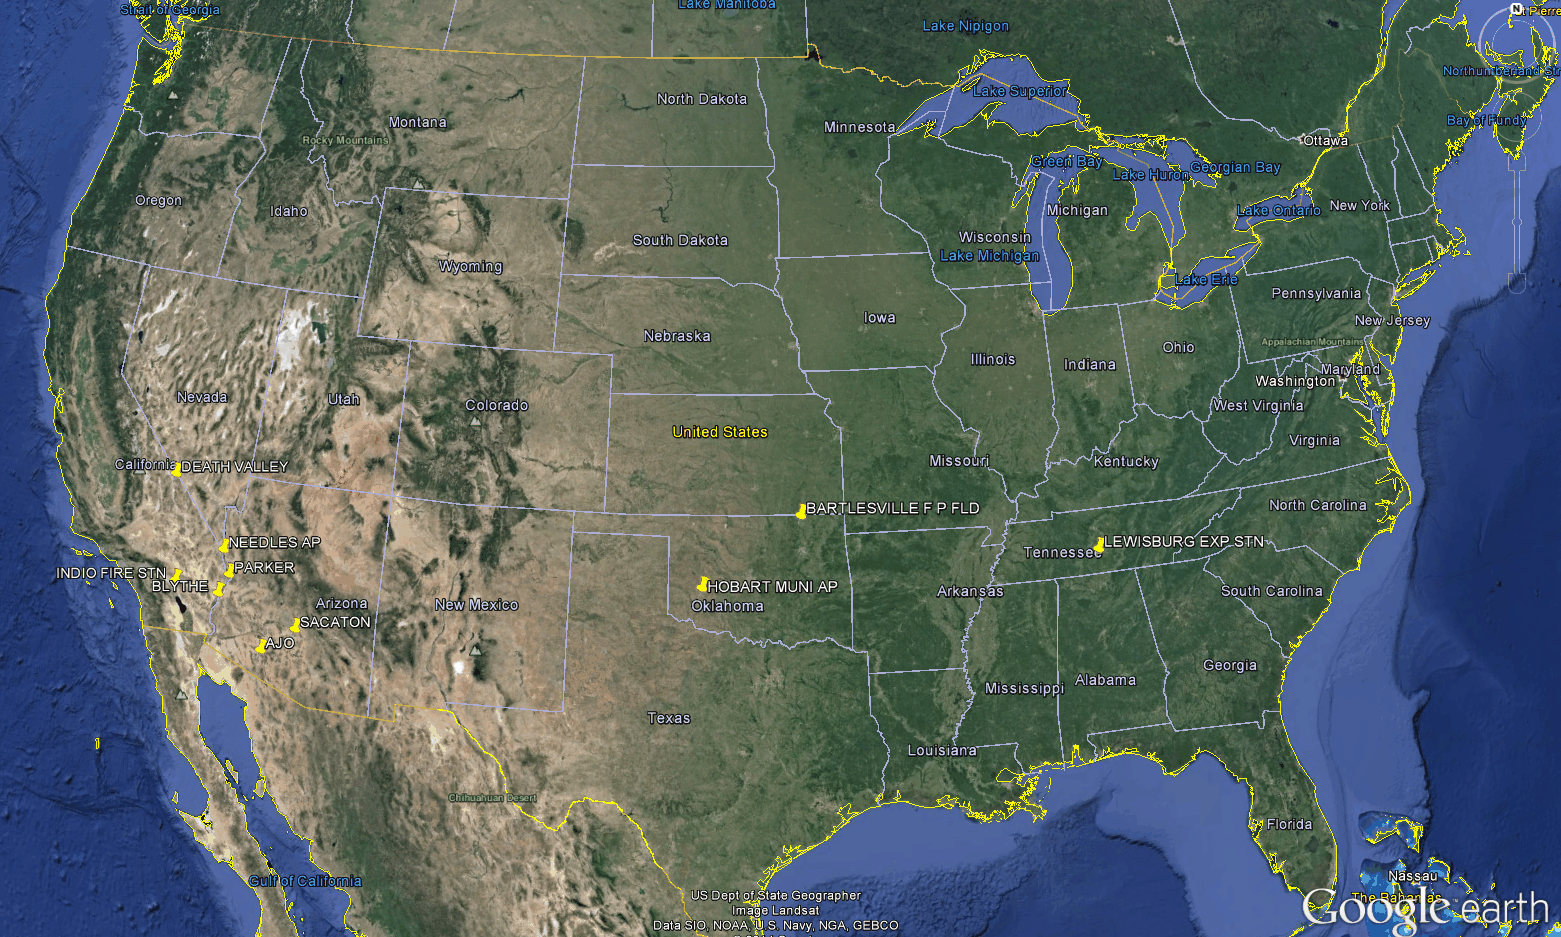
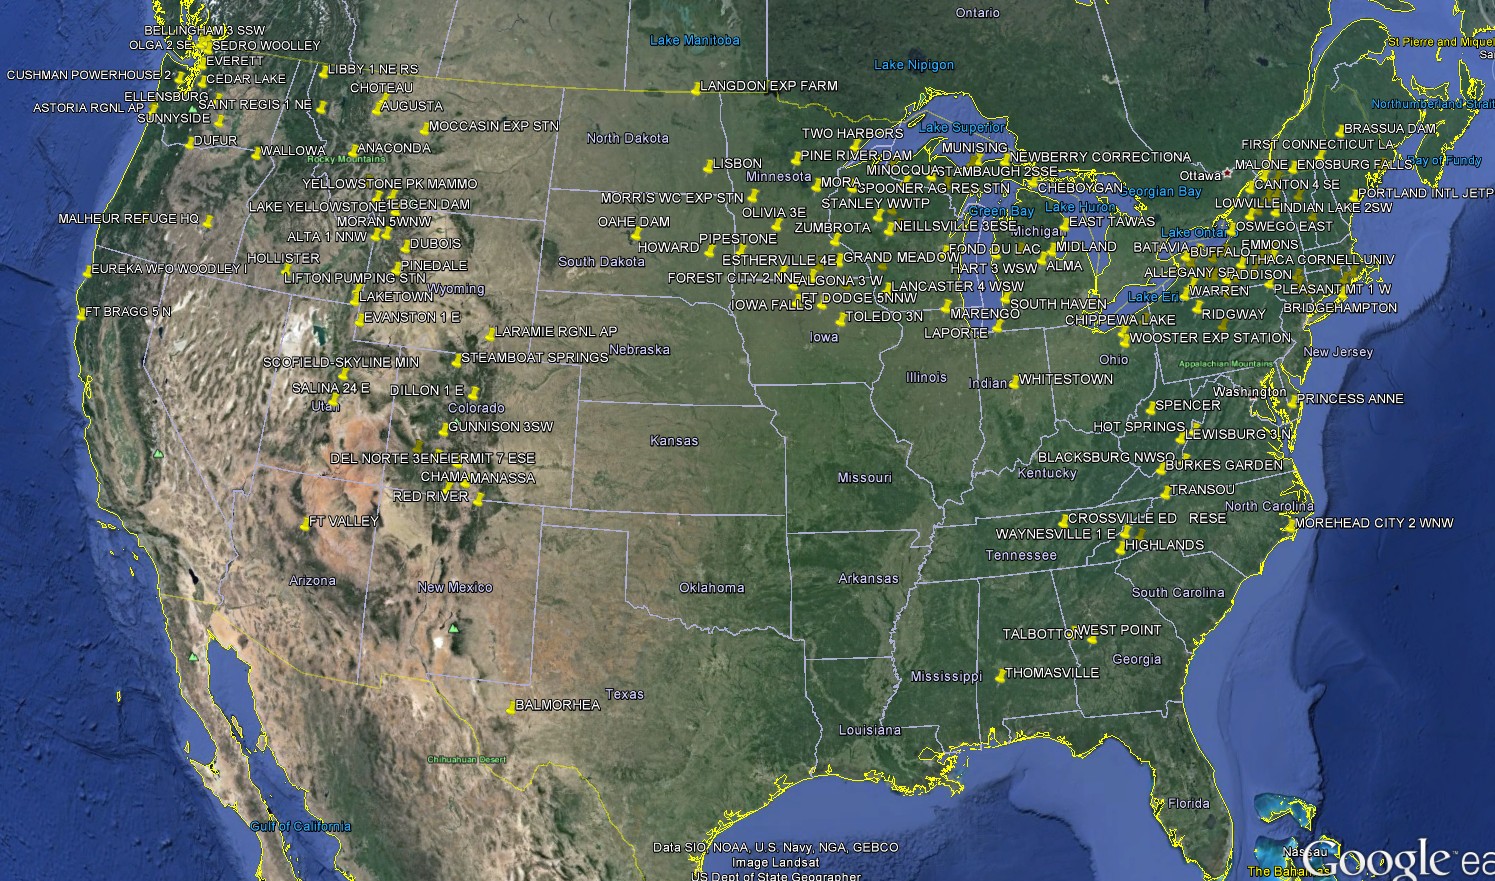
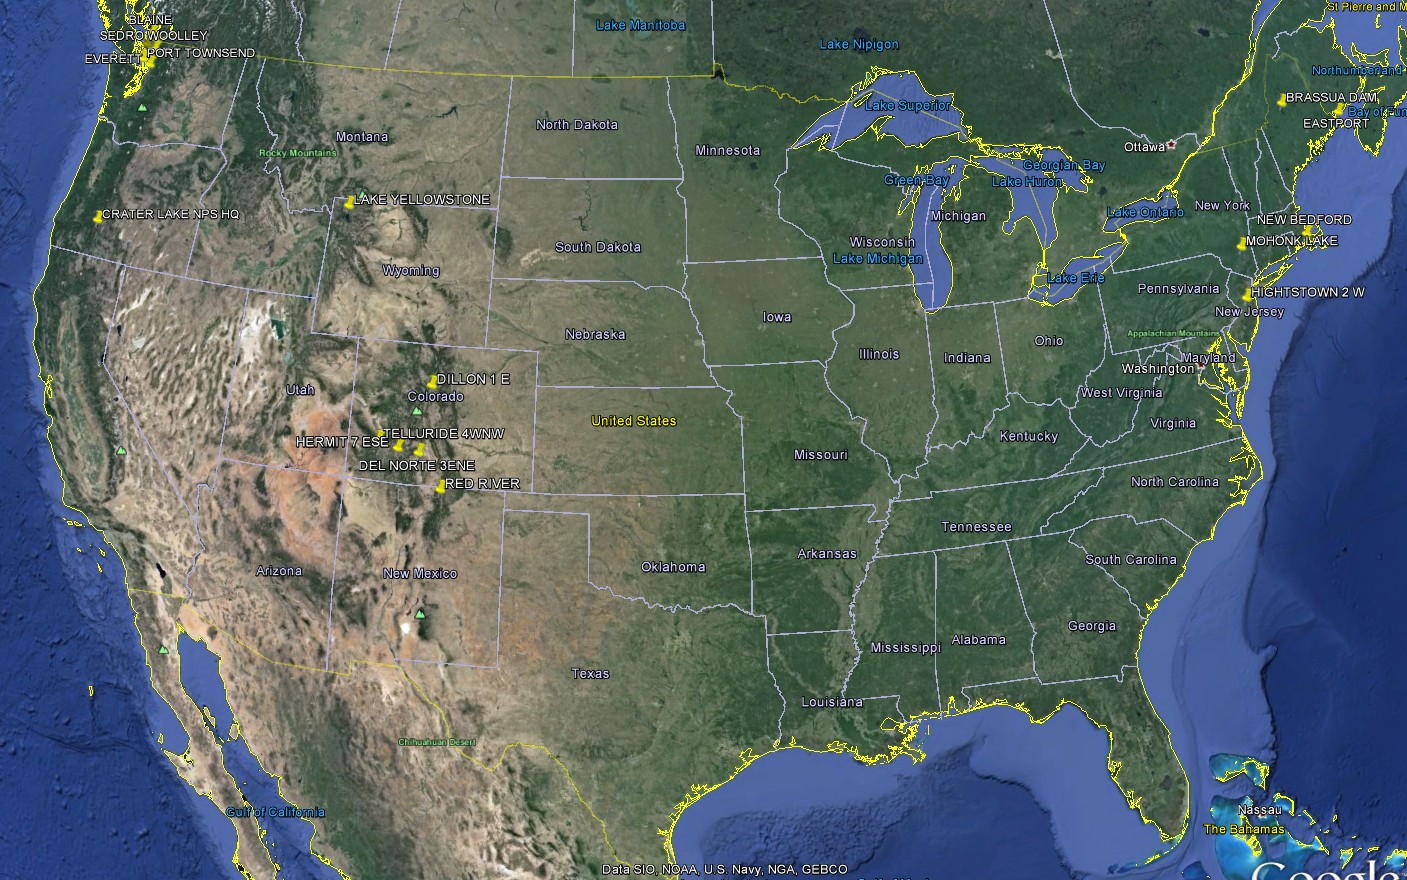
NCDC claimed July, 2012 was the hottest on record in the US. The map below shows all of the stations which reached 110 degrees in July, 2012

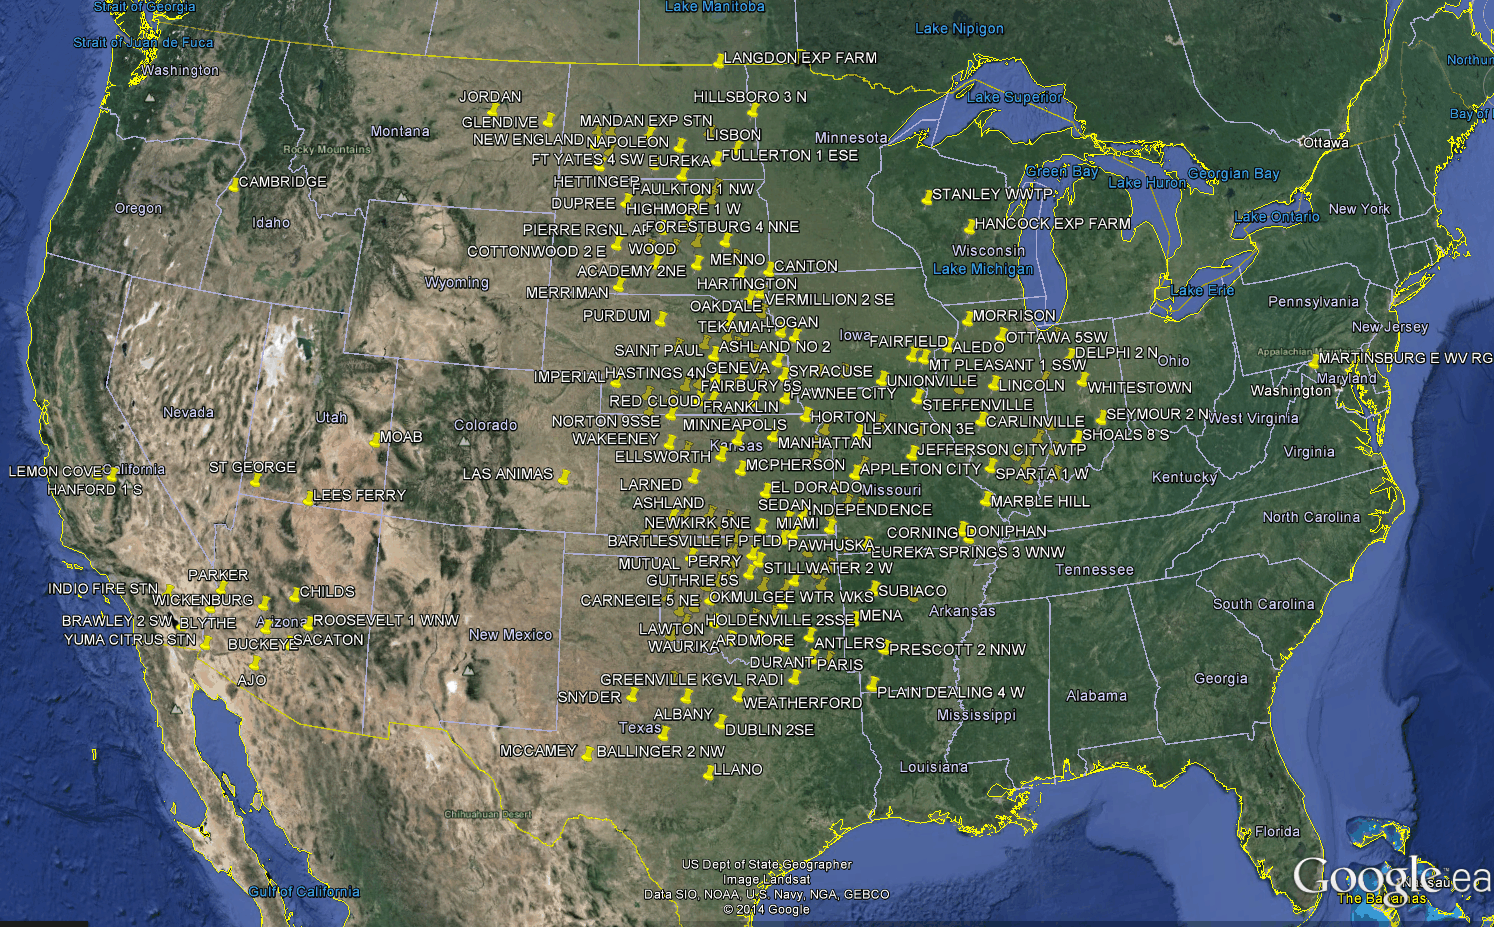
July2012  Now compare vs. July 1936, which had nearly 150 stations over 110 degrees.

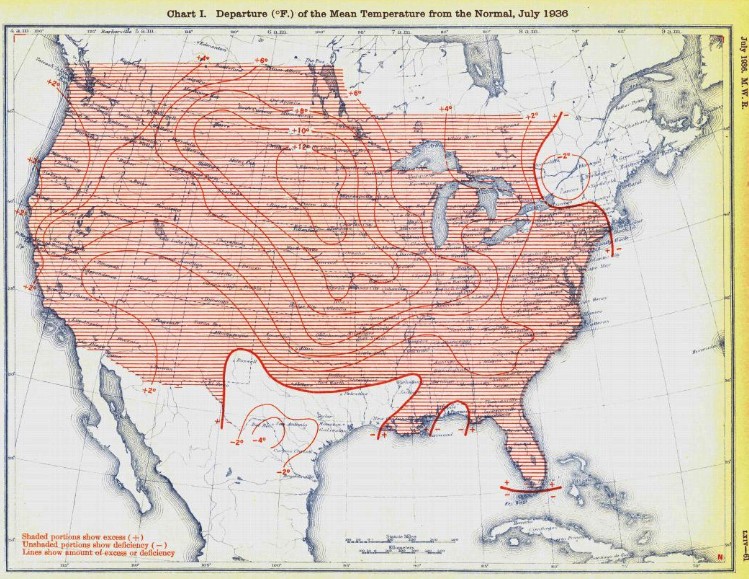
July1936 This agrees with the original Weather Bureau map from July, 1936

ScreenHunter_3935 Oct. 22 21.08

The animation below flashes between the two years.

 July2012vs1936

The fraudsters at NCDC claim that the area of hot maximum summer temperatures in 2012 was much higher than 1936.

ScreenHunter_3924 Oct. 22 07.21

Their data tampering is completely wrecking the US temperature record.

Posted in Uncategorized | 3 Comments

Sometimes You Just Have To Gloat

From April, 2013

“See You At Chelsea In July” | Real Science

ScreenHunter_4070 Oct. 26 11.44

Posted in Uncategorized | 6 Comments

How Hot Was 1936?

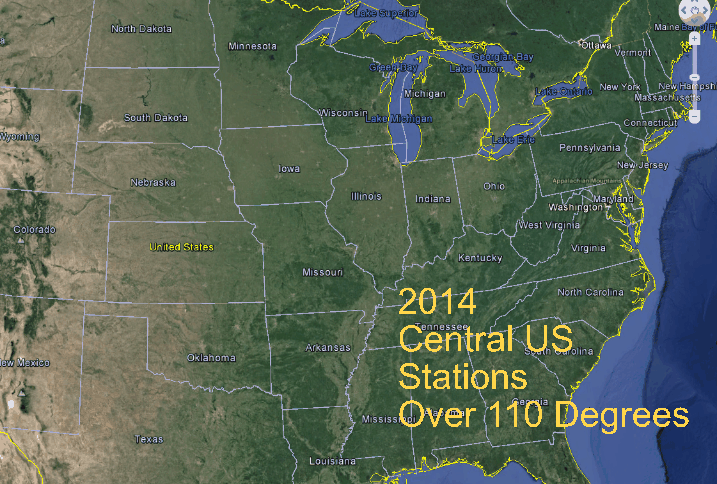
During 1936, a huge swath of the country was over 110 degrees.

ScreenHunter_4069 Oct. 26 11.34

This year, there were only a few stations which reached 110 degrees. The animation below flashes between 1936 and 2014

 1936vs2014_110degrees

Posted in Uncategorized | 2 Comments

100 Degree Weather In 1934

In 1934, almost the entire country reached 100 degrees.

ScreenHunter_4055 Oct. 26 11.12


The fraudsters at NCDC claim that the area of hot maximum temperatures in the US is higher now than 1934

ScreenHunter_3924 Oct. 22 07.21

Posted in Uncategorized | Leave a comment

Visualization Of How Cool 2014 Has Been

This map shows all the HCN stations which didn’t reach 90 degrees this year


ScreenHunter_4052 Oct. 26 10.54

Compare vs. the same map from 1931

ScreenHunter_4051 Oct. 26 10.50

Posted in Uncategorized | 1 Comment

A Pair Of Climate Hawks

B03o9RmCAAA4Zf1

h/t to Tom Nelson

Posted in Uncategorized | 32 Comments