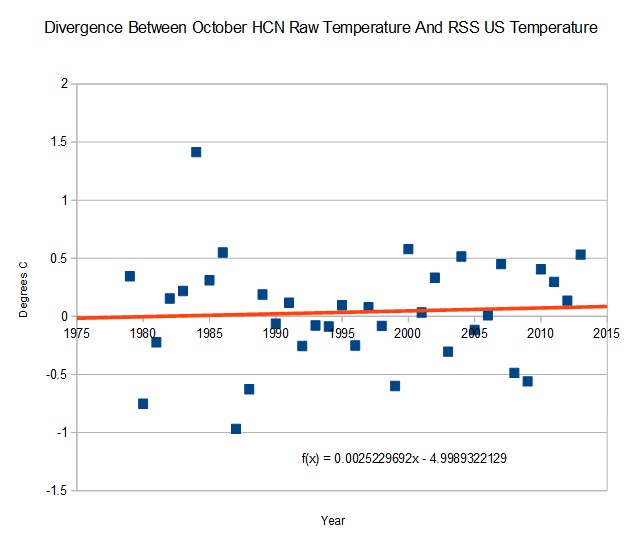
RSS US temperatures match raw US temperatures pretty closely.
rss_monthly_msu_amsu_channel_tlt_anomalies_land_and_ocean_v03_3.txt
RSS US temperatures match raw US temperatures pretty closely.
rss_monthly_msu_amsu_channel_tlt_anomalies_land_and_ocean_v03_3.txt
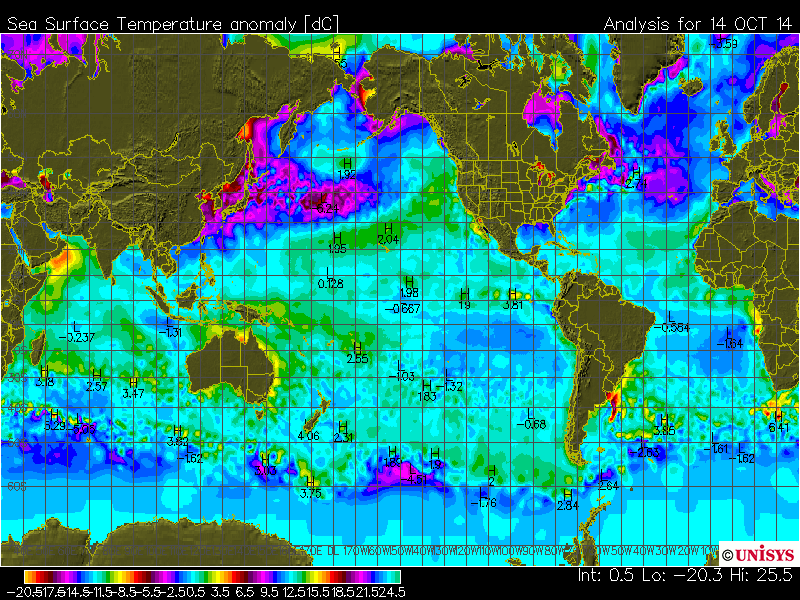
Experts at NOAA see the hottest sea surface temperatures ever.
Apparently too much weed in Boulder has been hard on them.
It has been four months since the geniuses at Scientific American wrote this :
June 11, 2014
The Midwest drought of 2012, which pushed corn prices to a record $8 per bushel, are “a taste of what is predicted to become the new normal in many parts of the Corn Belt thanks to climate change,”
Climate Change Hits America in Its Sweet Tooth – Scientific American
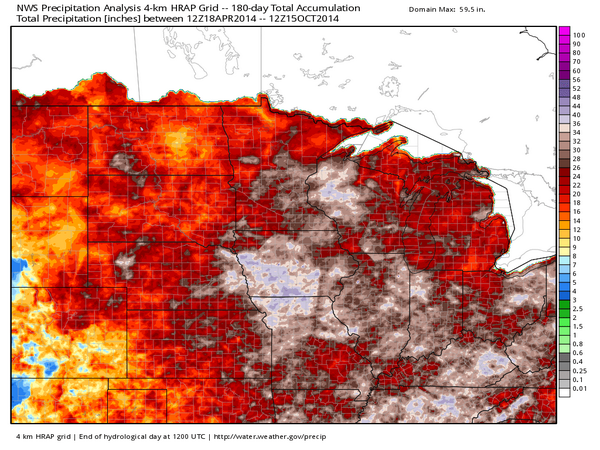
Only 60 inches of rain this summer
I apologize for enjoying nature, while progressives are hysterical about it falling apart – inside their minds.
Here is a video I took this morning of a levitating leaf in Maryland.
[youtube=https://www.youtube.com/watch?v=MG7cLfXnwKo]
10 Jan 1871 – IMAGINARY CHANGES OF CLIMATE. (Pall Mall Gazette.)
When Gavin claims “hottest September ever” – he is making the identical mistake which people have been making throughout history.
Much observation, which ought to correct a tendency to exaggerate, seems in some minds to have rather a tendency to increase it.
– January 10, 1871
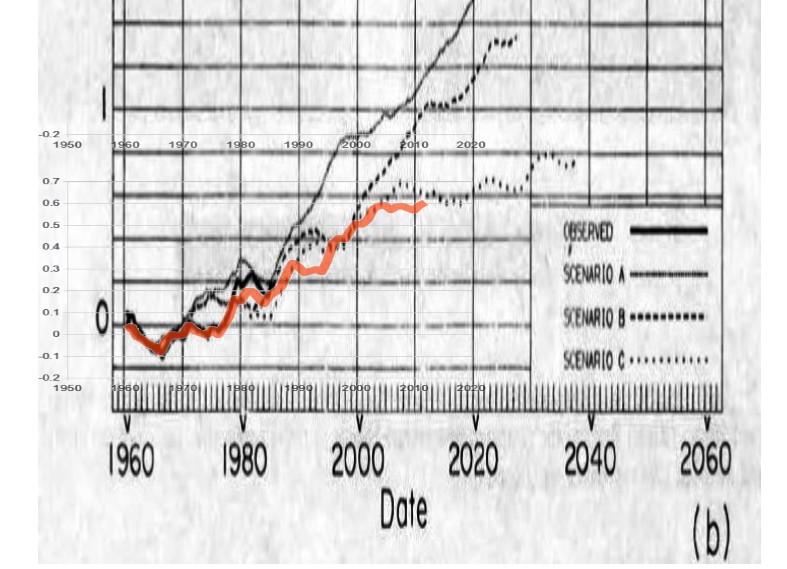
Even with Gavin’s best data tampering, he still can’t get temperatures above Hansen’s zero emissions after Y2K Scenario C.
The red line below shows the latest GISS five year mean.
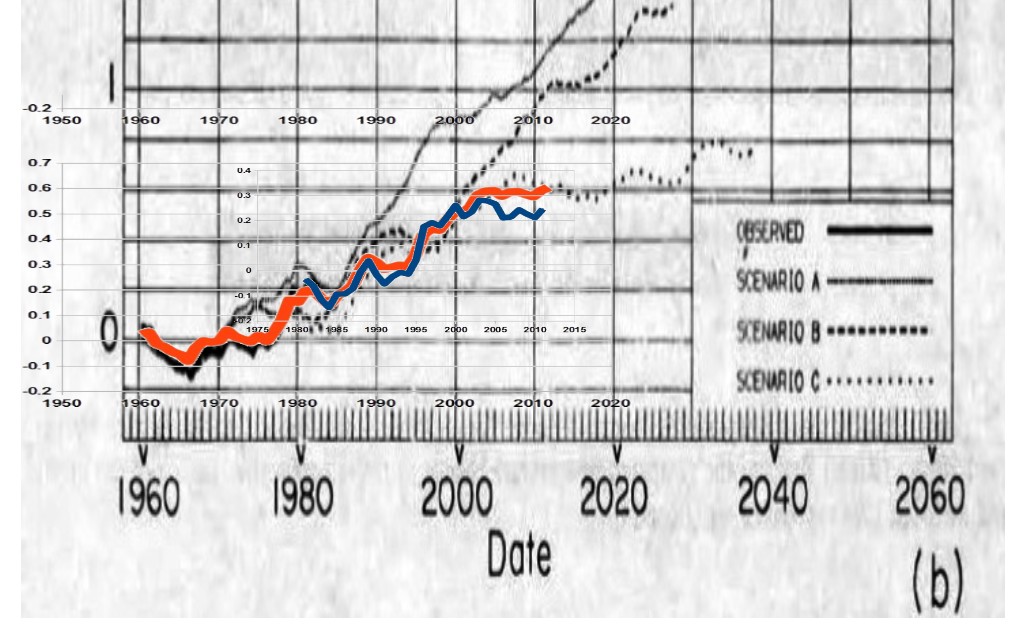
But it is worse than it seems. When the Y-axis is normalized to the 1960s, current temperatures are below Scenario C

But even that is worse than it seems. RSS TLT satellite temperatures (blue below) are far below Scenario C, and dead flat this century.
Below Scenario C indicates a climate sensitivity of zero.
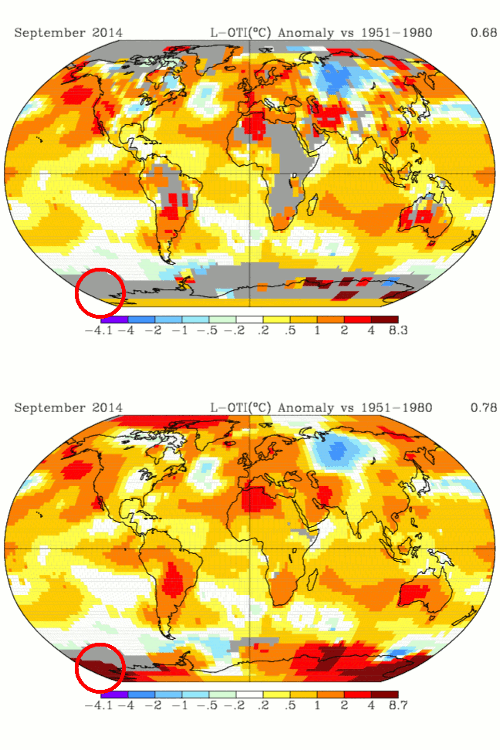
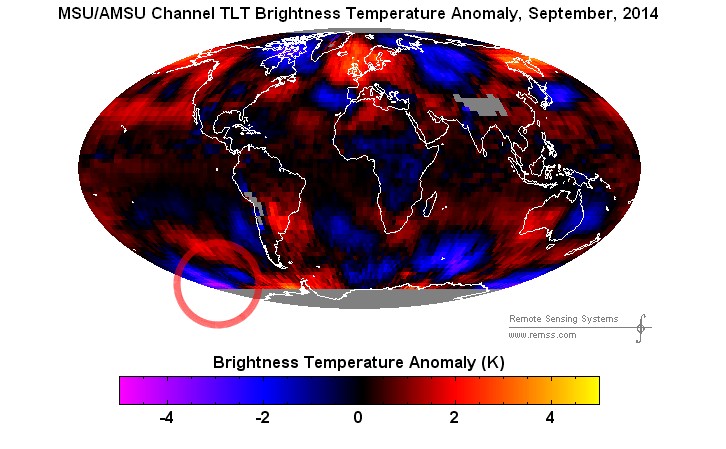
Gavin increases the September temperature anomaly by 0.1°C (from 0.68°C to 0.78°C) by faking +4°C anomalies around Antarctica
The region which he is faking actually had a -4C anomaly. Creating a +8°C error is a great way to get temperatures up 0.1°C
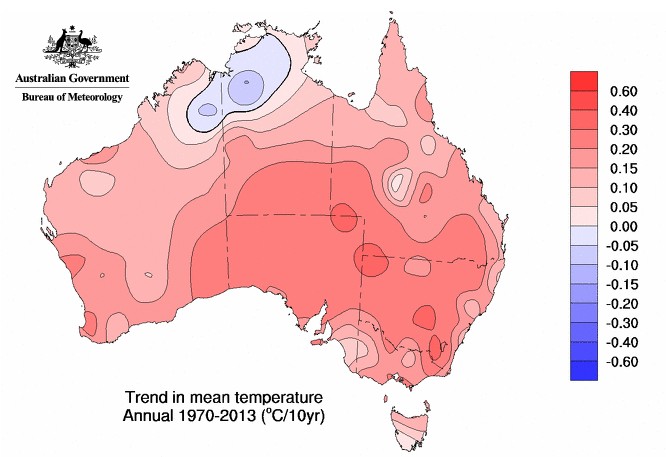
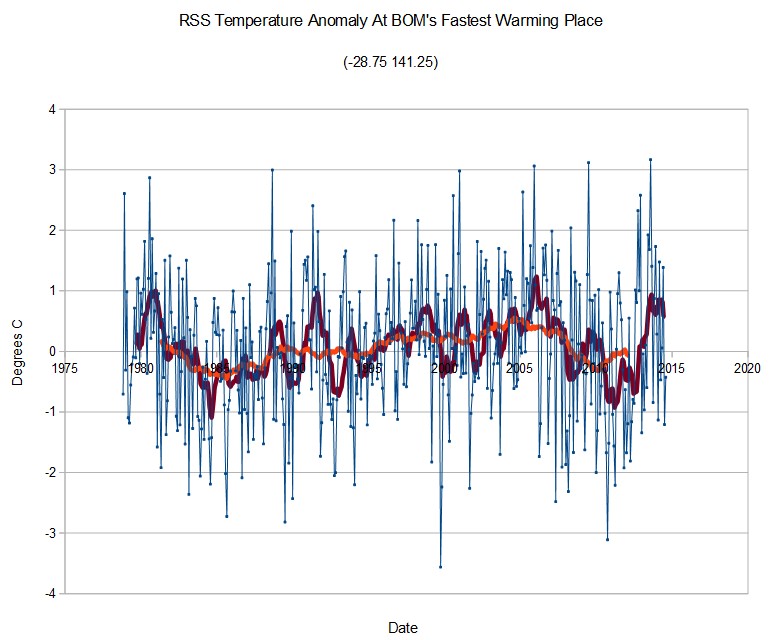
BOM shows the corner of NSW, Queensland and SA as the fastest warming place in Australia
RSS shows no net warming there, and that 1980 and 2006 were warmer there than 2013
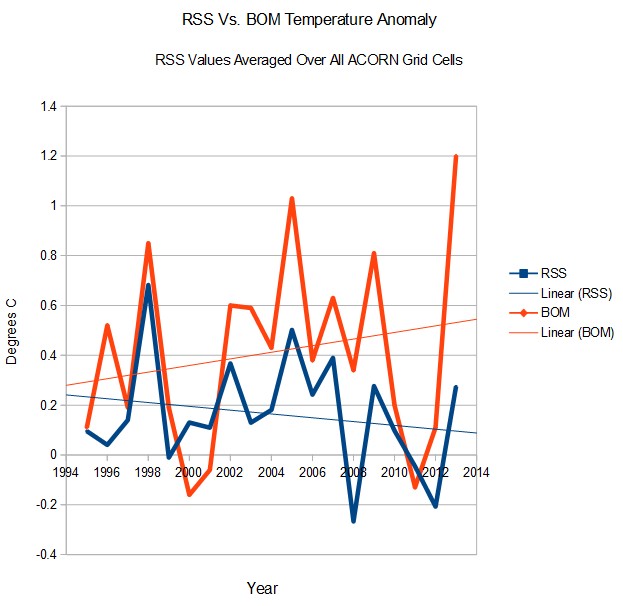
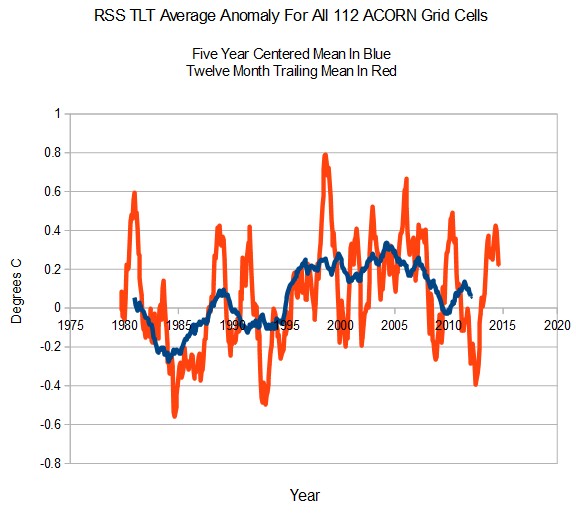
I tried an experiment today, and calculated the average RSS TLT anomaly for all 112 ACORN grid cells.
Last year was not even close to being the hottest year, and is diverging from BOM surface temperatures at a rate of 2.2°C per century over the last two decades.
Temperatures in Australia are about the same as they were at the start of the satellite record. Many years were warmer than 2013.