Obama doesn’t like Americans who “cling to guns and religion”, but he does like these bitter clingers

Obama doesn’t like Americans who “cling to guns and religion”, but he does like these bitter clingers
An article from “Washington Weather” written by contributor Andy DC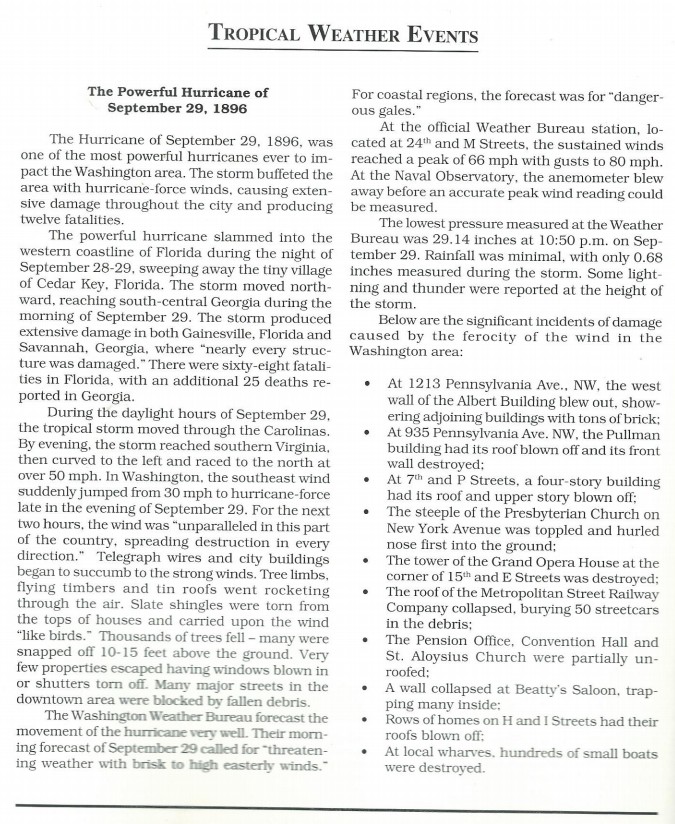
8 October 2014, 8.02pm BST
An independent inquiry into the Bureau of Meteorology? Bring it on
Maurice Newman, chair of the Prime Minister’s Business Advisory Council, has called for an independent review of the Bureau of Meteorology’s climate data, following a stream of recent articles in The Australian newspaper attacking the Bureau’s methods.
I support his call for an open and public inquiry into the Bureau’s climate data and the techniques that the Bureau’s scientists have used to reduce the influence of changes in instrumentation, exposure, and weather station location on its climate records.
I support it because I don’t think the Bureau gets enough opportunities to demonstrate to the public its scientific integrity, hard work, and valuable results.
An independent inquiry into the Bureau of Meteorology? Bring it on
I’m happy to bring it on.
Nicholls used the graph below, purporting to show that BOM surface data closely matches UAH satellite data. But he did a little nature trick – he expanded the scale of the satellite data (right side) to make it appear to match,the surface data! A realistic adjustment would be to do the opposite and shrink the satellite scale, because the troposphere should warm faster than the surface
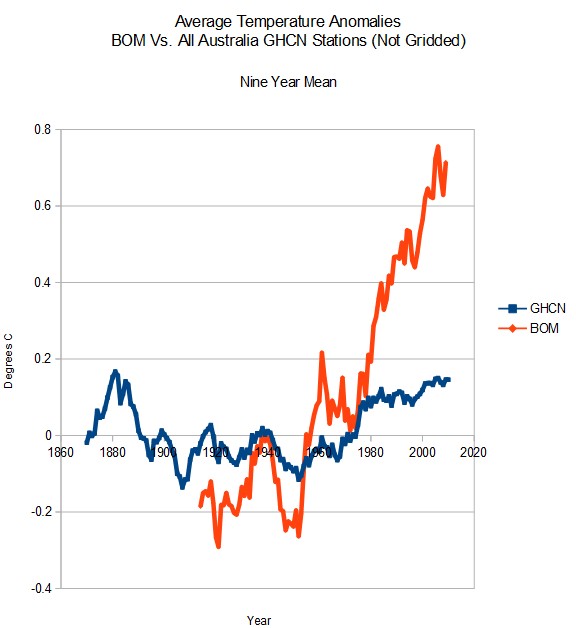
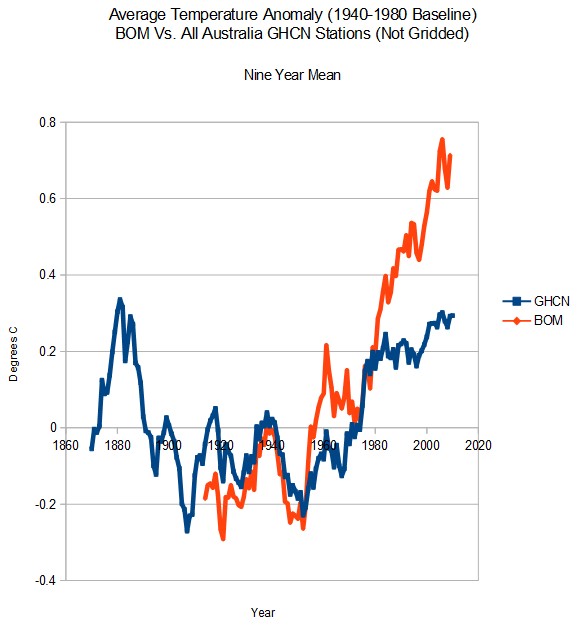
Next, let’s compare the BOM data from Nicholls graph above to all 1,655 GHCN (Global Climatology Historical Network) stations in Australia. The GHCN data shows no net warming since 1880, but the BOM (Bureau of Meteorology) data shows a hockey stick since 1950, and hides all temperatures before 1910.
This is not a perfect comparison, because the ungridded GHCN data skews towards temperatures in the populated areas near the coasts, and under counts temperatures in the interior. But at a minimum, it shows that there has been little or no net warming over a large swath of Australia, and a strong disagreement with the BOM data.
The BOM anomalies were calculated relative to a 1940-1980 baseline, and the GHCN anomalies were calculated as the differences of each monthly average from the 1940-1980 baseline for that month.
Below is the list of GHCN stations used.
End of September Arctic sea ice volume is up 84% since 2012, and second highest since 2006. Experts say it is in a “Death Spiral”

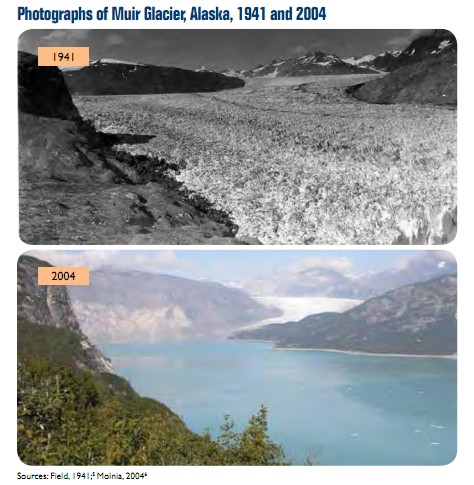
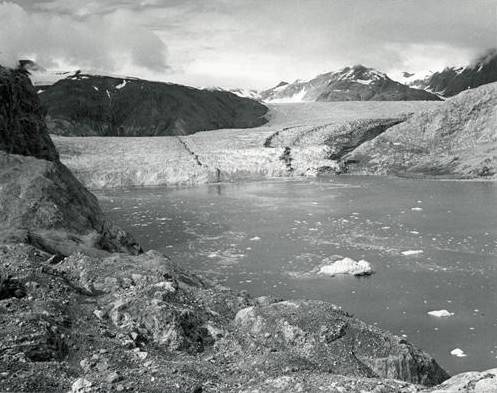
The EPA has these images on their web site – claiming to show how global warming is causing the Muir Glacier to disappear.
What they forgot to mention is that most of the retreat pictured above occurred between 1941 and 1950.
This August 1950 photo documents the significant changes that occurred during the 9 years between photographs A and B. Muir Glacier has retreated more than 2 miles, exposing Muir Inlet, and thinned 340 feet or more.
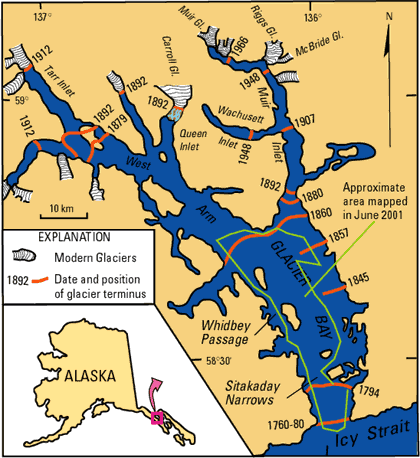
And of course this retreat had been going on for centuries
For nearly two centuries before 1941, Muir Glacier had been retreating. In places, a thickness of more than two-thirds of a mile of ice had been lost.
USGS Multimedia Gallery: Muir Glacier in Glacier Bay National Monument 1941
http://soundwaves.usgs.gov/2001/07/glacierbaymap.gif
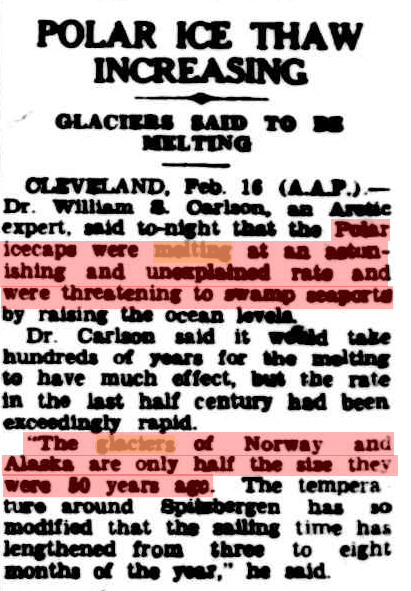
18 Feb 1952 – POLAR ICE THAW INCREASING GLACIERS SAID TO [?]
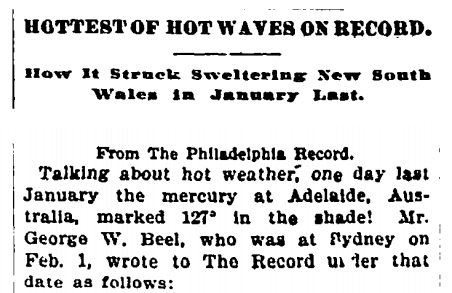
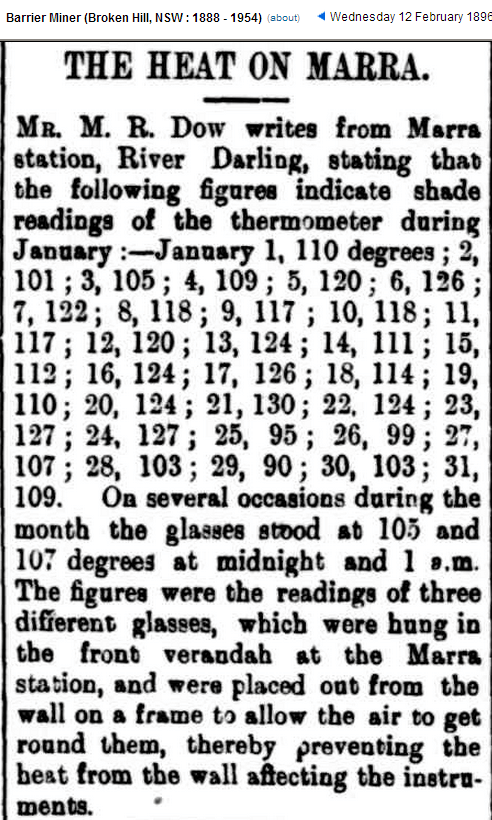
http://trove.nla.gov.au/ndp/del/article/44153166
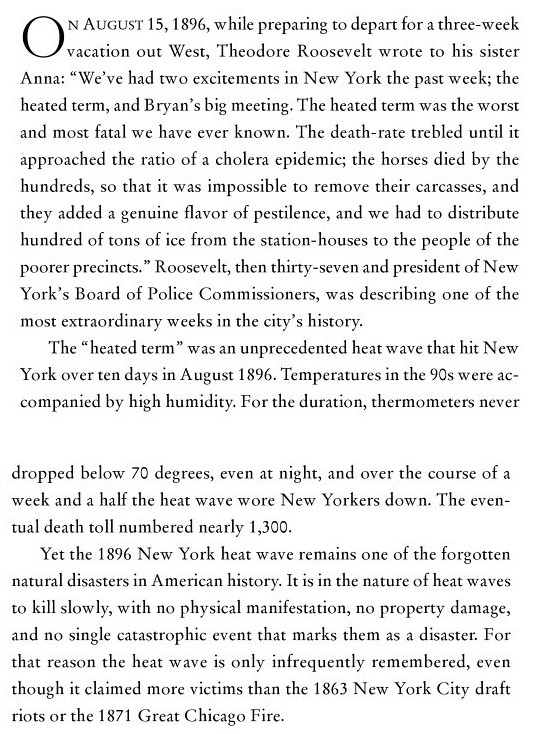
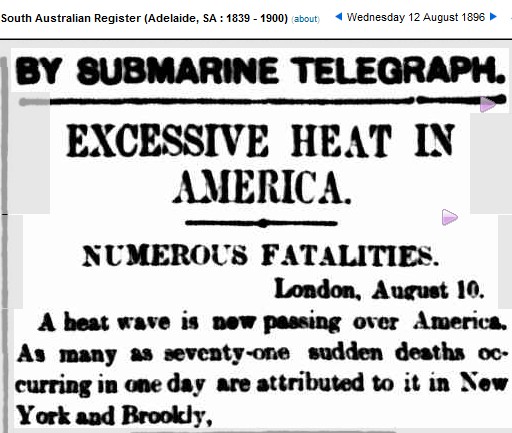
12 Aug 1896 – EXCESSIVE HEAT IN AMERICA. NUMEROUS FATALITIES. …
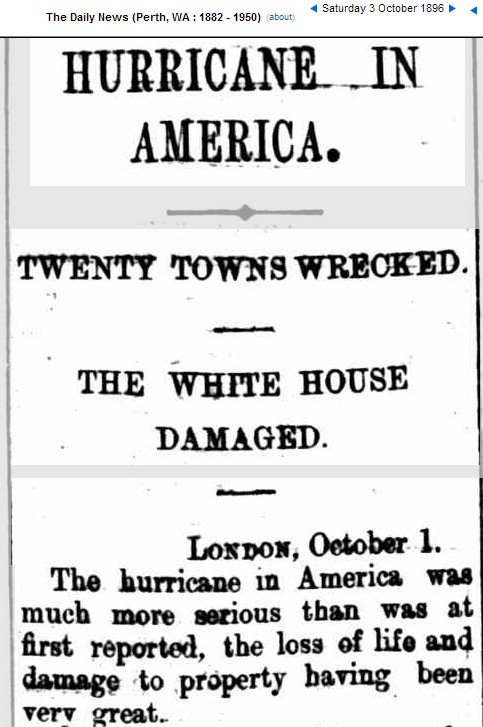
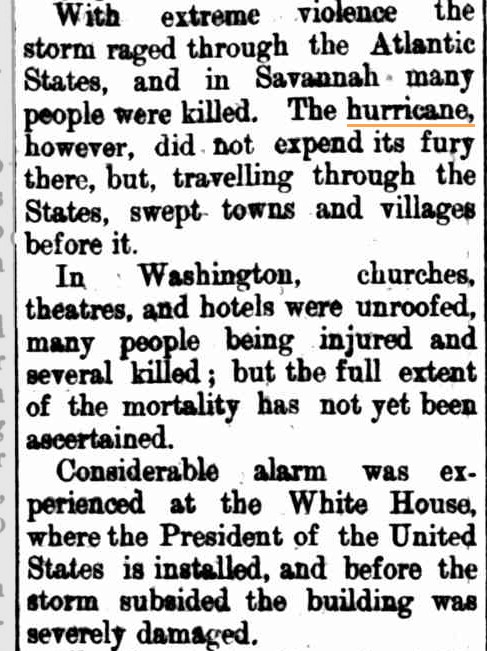
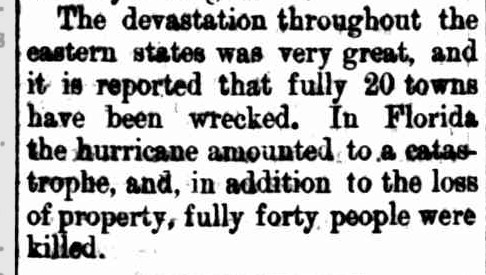
03 Oct 1896 – HURRICANE IN AMERICA. TWENTY TOWNS WRECKED. THE …
This is a particularly possible scenario if the disease gets to Haiti or Central America, he said. If the disease gets to countries like Guatemala, Honduras or El Salvador, it will cause a panic and people will flee the region, the general said.
“If it breaks out, it’s literally, ‘Katie bar the door,’ and there will be mass migration into the United States,” Kelly said. “They will run away from Ebola, or if they suspect they are infected, they will try to get to the United States for treatment.”
Also, transnational criminal networks smuggle people and those people can be carrying Ebola, the general said. Kelly spoke of visiting the border of Costa Rica and Nicaragua with U.S. embassy personnel. At that time, a group of men “were waiting in line to pass into Nicaragua and then on their way north,” he recalled.
Defense.gov News Article: Kelly: Southcom Keeps Watch on Ebola Situation
h/t to tom0mason
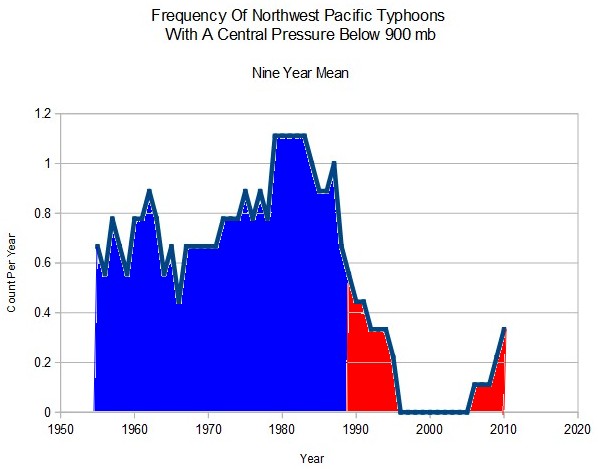
Think Progress is hysterical about the Japan Typhoon, because for progressives one point is enough to determine a trend.
In the real world, intense Northwest Pacific typhoons were far more common below 350 PPM
List of the most intense tropical cyclones – Wikipedia, the free encyclopedia
h/t to Andy DC