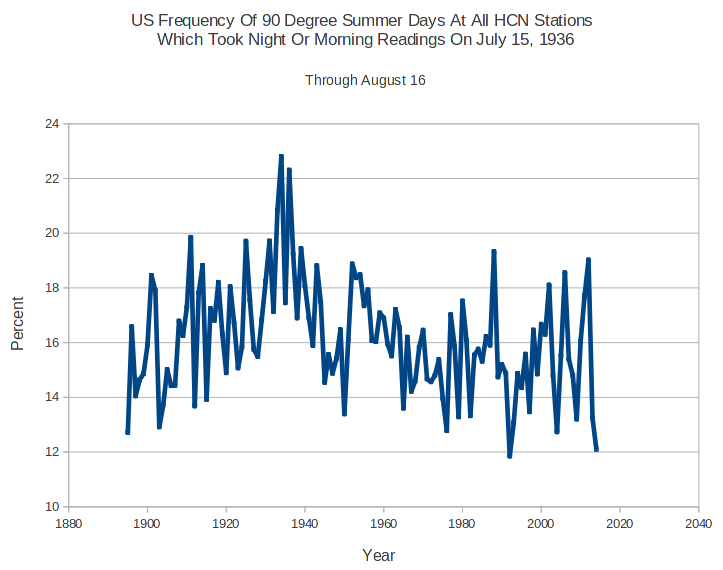
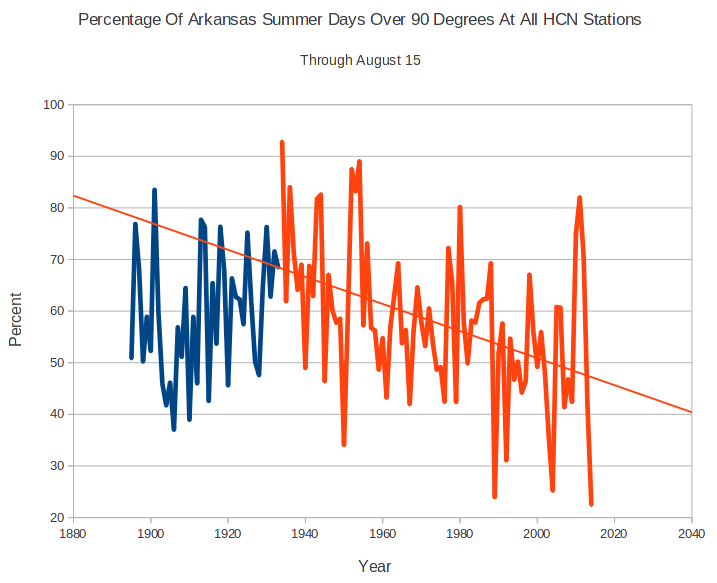
According to this EPA document, only 50% of the US was unusually hot in 1936, and 60% of the US was hot in 2012.
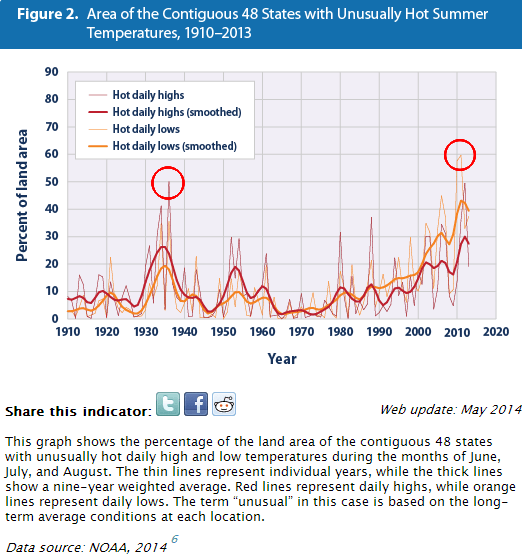
High and Low Temperatures | Climate Change | US EPA
This document was derived from NOAA’s Climate Extremes Index (CEI.) It is trivial to demonstrate that the NOAA CEI is wrong.
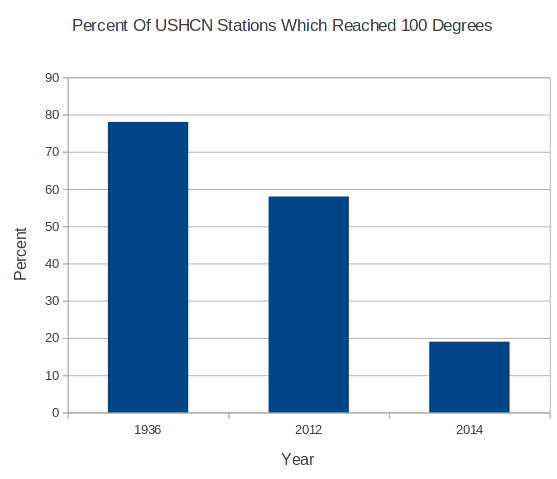
In 1936, 78% of USHCN stations recorded 100 degree temperatures, compared to 58% in 2012. Forty-four states had temperatures over 100 degrees in 1936. The CEI shows accurate numbers for 2012, but the 1936 numbers are massively understated. The average peak temperature of the 78% over 100 degrees in 1936 was an incredible 108 degrees.
But it is worse than it seems – the 1936 temperatures were not just over 100 degrees, but they were way over 100 degrees. In 1936, 24% of the US reached 110 degrees – compared to only 4% in 2012.
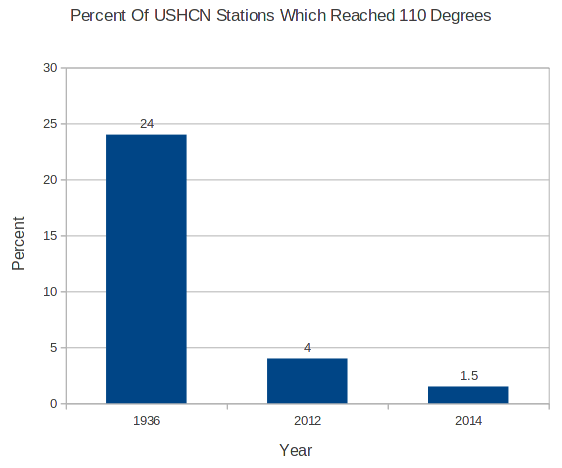
During the summer of 1936, the entire country was hot.
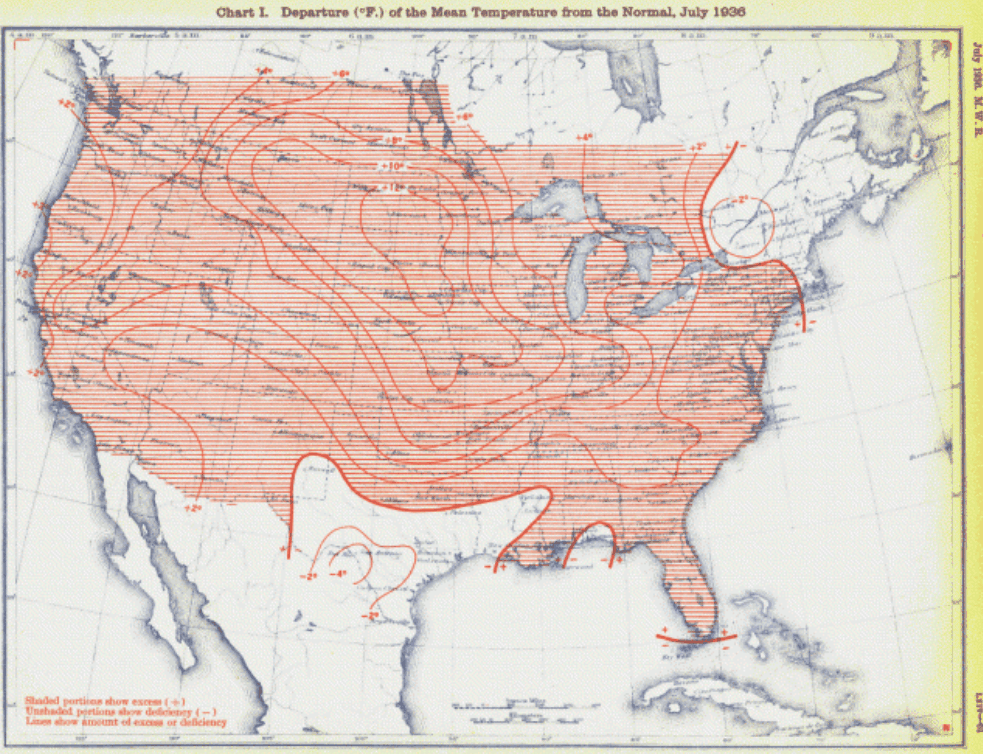
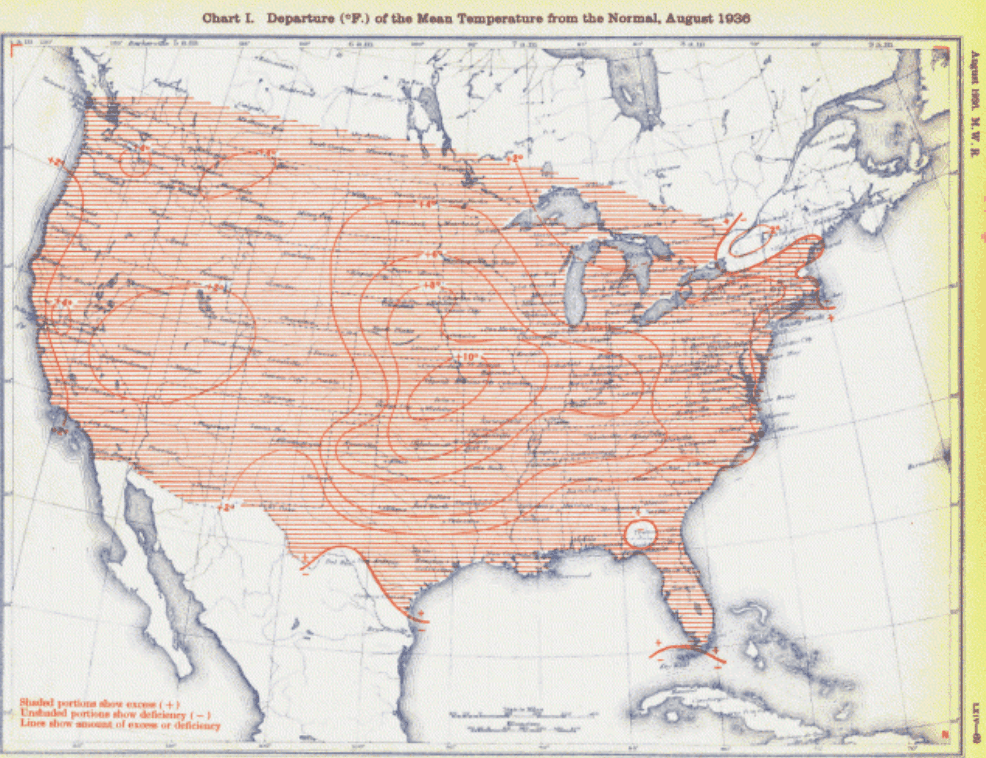
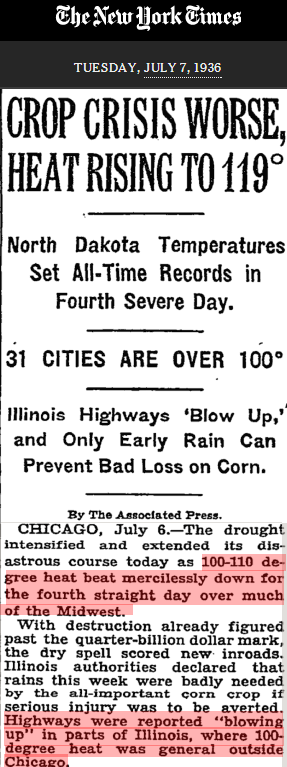
They can’t account for this discrepancy with any of their adjustments. TOBS does not affect the peak temperature for the year. This is flat out fraud or incompetence by NOAA.
Below is a list of the peak temperatures for 1936
Continue reading →